Department of Earth & Climate Sciences Spring 2016 Meteorology 260
|
|
|
- Amice Stafford
- 6 years ago
- Views:
Transcription
1 Department of Earth & Climate Sciences Spring 2016 Meteorology 260 Name Laboratory #9 Key: Joplin Tornado Day Subsynoptic, Thermodynamic, and Wind Shear Setting Part A: 1600 UTC Surface Chart Subsynoptic Analyses (100 pts) Part B: 1200 UTC Sounding Analyses (100 pts) Part C: 1200 UTC CAPE Analyses (100 pts) Part D: 1200 UTC Hodograph Analyses (100 pts) Last day to work on in class will be Wednesday April 27, 2016; Lab #10 turn in date is beginning of class 29 April Purpose of this Assignment: Operational and Practical Purposes: o To study the subsynoptic, thermodynamic, and wind shear environments in which the Joplin tornadic thunderstorm developed; Skills and Techniques Learned or Applied o To have the students apply the techniques they have learned in the Skew-T/log P Sounding and hodograph analyses part of the class; o To give students an opportunity to visualize how instability manifests itself in the morning environment in severe weather settings; o To show students how severe weather meteorologists estimate afternoon instability by transforming the morning sounding; o o To show students how to evaluate the instability graphically, and computationally; To introduce students to the finite difference approximation of summation;(integration) graphically and computationally;
 1.")
2 Part A: 1600 UTC Surface Chart Subsynoptic Analyses Fig. 1: Surface plot with isobars, 1600 UTC 22 May 2011 Figure 1 is the 1600 UTC surface chart on 22 May Isobars are drawn at two millibar intervals, with two labeled. You are also provided a separate clean copy of this chart for your final analyses. (100 pts) 1. On the copy above, draw blue, brown, and red streamlines, as we have have done in class many times to help find important boundaries (10 pts); 2. On the copy above, label all the isobars NEATLY (10 pts); 3. On the copy ablove, label lows and highs (if present) using the correct color convention (10 pts); 4. On the copy above, note that the isobars are strongly kinked away from low pressure in certain locations. It turns out that isobars are strongly kinked usually in areas in which they 2
 6.")
3 cross boundaries. Using this knowledge, and your results in (1) above, now draw in all the boundaries, using correct symbols and color conventions. (40 pts) 5. Transfer all that you ve done above to the final clean copy. This is what you will turn in and what will be graded. Neatness counts here. (10 pts for Neat Analysis) 6. How does your analysis show that the pre-thunderstorm environment generally matched the prototype associated with severe weather in the Great Plains (20 pts) The prototype surface severe weather pattern in the Great Plains consists of a wave cyclone located over the western Great Plains, with a dry line extending southward. Moist air moves northward ahead of the dry line and is ofen the locus for severe thunderstorm development. The subsynoptic analysis aboves shows such a pattern, with the dry line extending southwestward from the surface wave cyclone over western Oklahoma and into the Texas Panhandle. High dew point air ws moving northward ahead of the dry line over eastern Oklahoma and western Missouri. Part B: 1200 UTC Sounding Analyses (100 pts) You are provided with two color copies of Fig. 1 below, the Springfield MO sounding and hodograph for 12 UTC 22 May
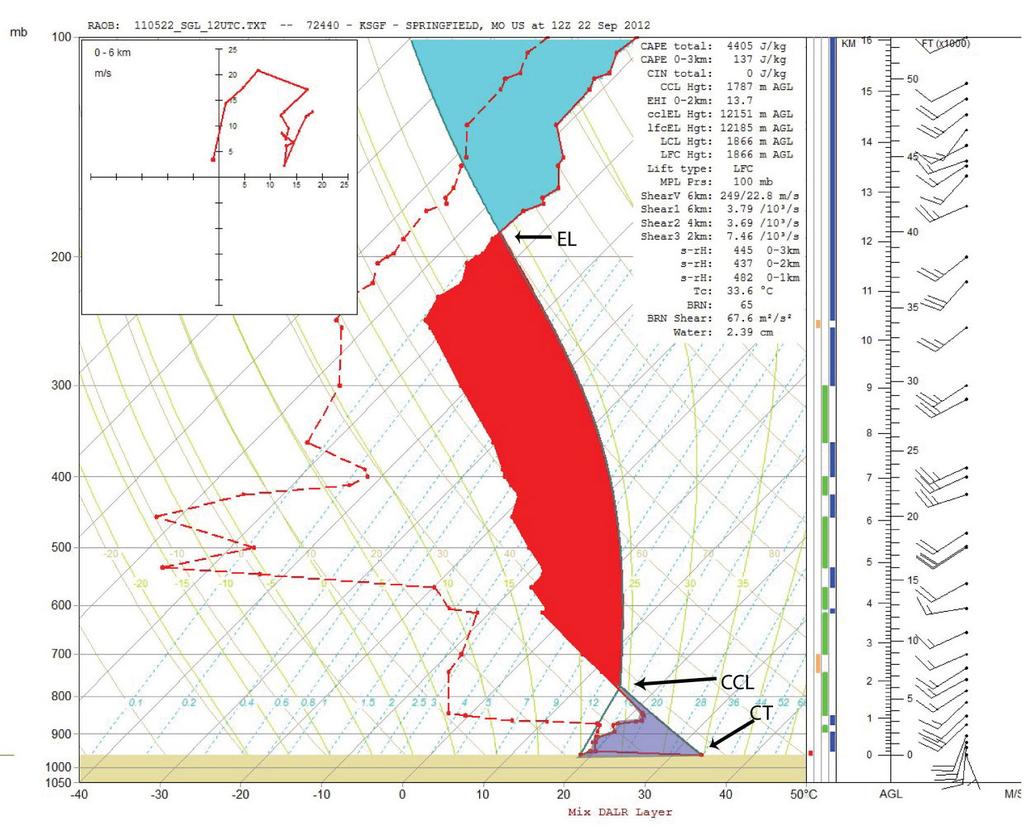
4 Fig. 1: KSGF Sounding and Hodograph, 12 UTC 5/22/11 1. Determine the morning stability at KSGF (Springfield, MO) by analysis of one of the copies of the morning sounding for 1200 UTC 22 May 2011 by completing the following tasks: a. Estimate the height (in millibars) of the Lifting Condensation Level, Level of Free Convection, 500 mb Lifted Index, Equilibrium Level. Be sure to indicate the parcel ascent curve, LCL, LFC and EL right on the diagram. And shade in the areas of CAPE and CIN with proper colors; (30 pts) b. Is the sounding absolutely unstable, absolutely stable or conditionally unstable for a surface lifted parcel. Explain your answer in several sentences. (20 pts) This is a conditionally unstable sounding. The LCL is at about 950 mb (129 m AGL), the LFC is at about 700 mb (~2702 m AGL), and the EL is at about 230 mb (~11,018 m AGL). The Lifted Index is On the second copy of the sounding for for 1200 UTC 22 May 2011 (second copy), estimate the afternoon stability at KSGF (Springfield, MO by completing the following tasks: a. Estimate the Convective Temperature, Convective Condensation Level and determine if the sounding is potentially unstable. Indicate the Convective Temperature (CT), Convective Condensation Level (CCL), and afternoon parcel ascent curve, positive area on sounding (CAPE) (shaded red), and negative area on sounding (CIN) (shaded blue); (30 pts) b. Is the sounding you modified for afternoon surface heating potentially stable or unstable for a surface lifted parcel. Explain your answer in several sentences. (20 pts) This is an potentially and absolutely unstable sounding because the CAPE area greatly exceeds the area of CIN (below the CCL). The CCL is at about 775 mb (1787 m AGL), the CT is at about 34C (93F), and the EL is at about180 mb (~12,151 m AGL). The Lifted Index is -12. The CAPE value is 4405 J/kg.. 4
5 5
 by summing up the indidividual contributions of layers approximately 1500 m thick. The table below should get you started.")
6 Part C: Calculation of CAPE 1. Calculate the CAPE from the morning sounding using the method discussed in class. You'll be approximating the CAPE crudely (explained in class) by summing up the indidividual contributions of layers approximately 1500 m thick. The table below should get you started. (95 points) The CAPE I calculated was 1065 m 2 /s 2 2. Using the results from (1) above, calculate the maximum vertical velocity at the EL in the morning. (Started in class) (5 points) (Bottom of Table below) The convective vertical velocity I calculated was 46 m/s. Table 1: Temperature Information Obtained from Sounding Analyses (completed in Part B) for KSGF 12 UTC 5/22/11 6
7 Part D: 1200 UTC Hodograph Analyses (100 pts) Table 1 shows the wind directions and speeds observed in the Springfield sounding 12 UTC 22 May Figure 2 is a blank diagram called a hodograph. It allows us to visualize the way wind directions and speeds vary with height. Table 1: Winds and pressures observed in KSGL radiosonde launch, 12 UTC 22 May
8 Figure 2: Blank hodograph paper. Pressure (mb) Height (m) AGL Direction (deg) Speed (kts)
9 Table 2: Wind Directions (deg) and speeds (kts) at selected pressure levels Storm-Relative Helicity (m 2 /s 2 ) Midlevel Mesocyclone Strength 100 Weak No 150 Moderate Yes 250 Strong Yes >350 Violent Yes Meets Strength Threshold for Categorization as Supercell Table 3: Storm Relative Helicity and Mesocyclone Strength 1. Fill in Table 2 with the wind directions and speeds extracted from the radiosonde information in Table 1; (2 pts each for 24 points) 2. Plot an arrow (vector) for each level given in Table 2, as shown in class. Label each arrow near its end with the appropriate level (for example, Sfc). (2 pts each for a total of 10 pts) 3. Put a black dot at the tip of each arrow; (2 pts each for a total of 10 pts) 4. Draw (neatly) straight line segments connecting each dot. (2 pts each for a total of 10 pts) In plain english describe how the the wind in the lowest 6 km, as visualized by the hodograph you just constructed, varied with height. (16 pts) The winds change in a clockwise sense from the surface to around the 700 mb level, and then a slight counterclockwise change and then straight. The winds also generally increasd with height except between 850 mb and 700 mb. Also, noteworthy, is that the surface wind is nearly right angles to the wind in the middle troposphere. 5. The 0-3 km storm relative helicity calculated for this hodograph can be found in the box on the upper right of the sounding. Positive values of this parameter indicate that inflow air entering the updraft of any developing thunderstorm would be rotating. Answer in complete sentences. a. Using the information given in Table 3, categorize the potential strength of the midlevel mesocyclone of any developing thunderstorm; (20 pts) The 0-3 km storm-relative helicity for this case is 445 m 2 /s 2. According to the values given in Table 3, any thunderstorm devleoping in this environment would develop a rotating updraft characterized as a violent mesocyclone. b. How do your values in Table 2 and the plotted hodograph conceptually indicate that the updraft of any developing thunderstorm on this day would be helical (rotating)? (20 pts) 9
10 Both the values in Table 2 and the wind plots on the hodograph indicate that the surface wind field is nearly at right angles to the winds at 500 mb. This suggests that the surface wind flow would develop great rotation that, when tilted into the vertical by the updraft of the thunderstorm, would be associated with a significant counterclockwise rotating updraft, a mesocyclone. 10
Department of Earth & Climate Sciences Spring 2016 Meteorology 260
 Department of Earth & Climate Sciences Spring 2016 Meteorology 260 Name Laboratory #9: Joplin Tornado Day Subsynoptic, Thermodynamic, and Wind Shear Setting Part A: 1600 UTC Surface Chart Subsynoptic Analyses
Department of Geosciences San Francisco State University Spring Metr 201 Monteverdi Quiz #5 Key (100 points)
") Department of Geosciences Name San Francisco State University Spring 2012 Metr 201 Monteverdi Quiz #5 Key (100 points) 1. Fill in the Blank or short definition. (3 points each for a total of 15 points)
Department of Geosciences Name San Francisco State University Spring 2012 Metr 201 Monteverdi Quiz #5 Key (100 points) 1. Fill in the Blank or short definition. (3 points each for a total of 15 points)
Department of Geosciences San Francisco State University Spring Metr 201 Monteverdi Quiz #5 Key 150 pts.
 Department of Geosciences Name San Francisco State University Spring 2013 Metr 201 Monteverdi Quiz #5 Key 150 pts. 1. Definitions. (5 points each for a total of 20 points in this section). (a) Coriolis
Chapter 14 Thunderstorm Fundamentals
 Chapter overview: Thunderstorm appearance Thunderstorm cells and evolution Thunderstorm types and organization o Single cell thunderstorms o Multicell thunderstorms o Orographic thunderstorms o Severe
Solutions to Comprehensive Final Examination Given on Thursday, 13 December 2001
 Name & Signature Dr. Droegemeier Student ID Meteorology 1004 Introduction to Meteorology Fall, 2001 Solutions to Comprehensive Final Examination Given on Thursday, 13 December 2001 BEFORE YOU BEGIN!! Please
Monteverdi Metr 201 Quiz #4 100 pts.
 DEPARTMENT OF GEOSCIENCES Name San Francisco State University April 27, 2012 Monteverdi Metr 201 Quiz #4 100 pts. A. Definitions. (5 points each for a total of 25 points in this section). (a) Convective
Practical Use of the Skew-T, log-p diagram for weather forecasting. Primer on organized convection
 Practical Use of the Skew-T, log-p diagram for weather forecasting Primer on organized convection Outline Rationale and format of the skew-t, log-p diagram Some basic derived diagnostic measures Characterizing
Jonathan M. Davies* Private Meteorologist, Wichita, Kansas
 4.3 RUC Soundings with Cool Season Tornadoes in Small CAPE Settings and the 6 November 2005 Evansville, Indiana Tornado Jonathan M. Davies* Private Meteorologist, Wichita, Kansas 1. Introduction Several
AT351 Lab Seven Skew-T Stability Analysis
 AT351 Lab Seven Skew-T Stability Analysis Twice a day, all around the planet, small instrument packages called radiosondes are launched into the atmosphere using balloons. These instruments record the
ANSWER KEY. Part I: Synoptic Scale Composite Map. Lab 12 Answer Key. Explorations in Meteorology 54
 ANSWER KEY Part I: Synoptic Scale Composite Map 1. Using Figure 2, locate and highlight, with a black dashed line, the 500-mb trough axis. Also, locate and highlight, with a black zigzag line, the 500-mb
Hurricane and Tropical Cyclone Tornado Environments from RUC Proximity Soundings
 P8.1 Hurricane and Tropical Cyclone Tornado Environments from RUC Proximity Soundings Jonathan M. Davies* Private Meteorologist, Wichita, Kansas 1. Introduction Studies such as those by McCaul (1991, 1996)
Warm season forecasting! Some material adapted from Material Produced at COMET for their Residence Course in Hydrometeorology
 Warm season forecasting! Some material adapted from Material Produced at COMET for their Residence Course in Hydrometeorology 1 Outline! Types of stability and application to forecasting! Dry and moist
Type of storm viewed by Spotter A Ordinary, multi-cell thunderstorm. Type of storm viewed by Spotter B Supecell thunderstorm
 ANSWER KEY Part I: Locating Geographical Features 1. The National Weather Service s Storm Prediction Center (www.spc.noaa.gov) has issued a tornado watch on a warm spring day. The watch covers a large
Tornadogenesis in Supercells: The Three Main Ingredients. Ted Funk
 Tornadogenesis in Supercells: The Three Main Ingredients Ted Funk NWS Louisville, KY Spring 2002 Environmental Parameters Supercells occur within environments exhibiting several wellknown characteristics
Metr 201 Quiz #4 Key 100 pts. A. Short Answer and Definitions. (3 points each for a total of 18 points in this section).
.") Department of Earth & Climate Sciences Name San Francisco State University March 30, 2015 Metr 201 Quiz #4 Key 100 pts. A. Short Answer and Definitions. (3 points each for a total of 18 points in this
Department of Earth & Climate Sciences Name San Francisco State University March 30, 2015 Metr 201 Quiz #4 Key 100 pts. A. Short Answer and Definitions. (3 points each for a total of 18 points in this
PLOTTING WEATHER DATA to perform a SURFACE ANALYSIS
 PLOTTING WEATHER DATA to perform a SURFACE ANALYSIS The surface analysis permits one to identify and locate the large scale features of the sea level pressure field and the surface fronts. Isobars with
Meteorology Lecture 19
 Meteorology Lecture 19 Robert Fovell rfovell@albany.edu 1 Important notes These slides show some figures and videos prepared by Robert G. Fovell (RGF) for his Meteorology course, published by The Great
A Detailed Analysis of a Long-Tracked Supercell. Jason T. Martinelli and Andrew Elliott. Fred Glass
 A Detailed Analysis of a Long-Tracked Supercell Jason T. Martinelli and Andrew Elliott Department of Atmospheric Sciences, Creighton University, Omaha, Nebraska Fred Glass National Weather Service Forecast
P12.7 MESOCYCLONE AND RFD INDUCED DAMAGING WINDS OBSERVED IN THE 27 MAY 2004 SOUTHWEST OHIO SUPERCELL
 P12.7 MESOCYCLONE AND RFD INDUCED DAMAGING WINDS OBSERVED IN THE 27 MAY 2004 SOUTHWEST OHIO SUPERCELL John T. DiStefano* National Weather Service Office, Wilmington, Ohio 1. INTRODUCTION During the early
Advanced Spotter Training Lesson 4: The Nature of Thunderstorms
 Advanced Spotter Training 2009 Lesson 4: The Nature of Thunderstorms From Last Time We discussed the different ways to make air rise. We discussed convection, convergence, and the different kinds of fronts.
Metr 201 Quiz #2 100 pts. A. Short Answer and Definitions. (4 points each for a total of 28 points in this section).
.") Department of Earth & Climate Sciences Name San Francisco State University February 23, 2015 Metr 201 Quiz #2 100 pts. A. Short Answer and Definitions. (4 points each for a total of 28 points in this section).
Department of Earth & Climate Sciences Name San Francisco State University February 23, 2015 Metr 201 Quiz #2 100 pts. A. Short Answer and Definitions. (4 points each for a total of 28 points in this section).
ATS 351, Spring 2010 Lab #11 Severe Weather 54 points
 ATS 351, Spring 2010 Lab #11 Severe Weather 54 points Question 1 (10 points): Thunderstorm development a) Sketch and describe the stages of development of a single cell thunderstorm. About how long does
Tornadoes forecasting, dynamics and genesis. Mteor 417 Iowa State University Week 12 Bill Gallus
 Tornadoes forecasting, dynamics and genesis Mteor 417 Iowa State University Week 12 Bill Gallus Tools to diagnose severe weather risks Definition of tornado: A vortex (rapidly rotating column of air) associated
Analyzing Severe Weather Data
 Chapter Weather Patterns and Severe Storms Investigation A Analyzing Severe Weather Data Introduction Tornadoes are violent windstorms associated with severe thunderstorms. Meteorologists carefully monitor
A Case Study on Diurnal Boundary Layer Evolution
 UNIVERSITY OF OKLAHOMA A Case Study on Diurnal Boundary Layer Evolution Meteorological Measurement Systems Fall 2010 Jason Godwin 12/9/2010 Lab partners: Sam Irons, Charles Kuster, Nathan New, and Stefan
Evolution and Maintenance of the June 2003 Nocturnal Convection
 Evolution and Maintenance of the 22-23 June 2003 Nocturnal Convection Jerilyn Billings NOAA/NWS Wichita, KS August 6 th, 2011 Work Completed at North Carolina State University for MS Thesis During the
Science Olympiad Meteorology Quiz #2 Page 1 of 8
 1) The prevailing general direction of the jet stream is from west to east in the northern hemisphere: 2) Advection is the vertical movement of an air mass from one location to another: 3) Thunderstorms
Anthony A. Rockwood Robert A. Maddox
 Anthony A. Rockwood Robert A. Maddox An unusually intense MCS produced large hail and wind damage in northeast Kansas and northern Missouri during the predawn hours of June 7 th, 1982. Takes a look at
Tornadoes forecasting, dynamics and genesis. Mteor 417 Iowa State University Week 12 Bill Gallus
 Tornadoes forecasting, dynamics and genesis Mteor 417 Iowa State University Week 12 Bill Gallus Tools to diagnose severe weather risks Definition of tornado: A vortex (rapidly rotating column of air) associated
ERTH 260 In-class Exercise 3 Key: Weather Map Features Introduction to Boundaries
 San Francisco State University Name Department of Earth & Climate Sciences Spring 2018 ERTH 260 In-class Exercise 3 Key: Weather Map Features Introduction to Boundaries 100 points Due Wednesday 14 February
I. Convective Available Potential Energy (CAPE)
") Reading 4: Procedure Summary-- Calcluating CAPE, Lifted Index and Strength of Maximum Convective Updraft CAPE Calculation Lifted Index Calculation Maximum Updraft Strength Calculation I. Convective Available
Reading 4: Procedure Summary-- Calcluating CAPE, Lifted Index and Strength of Maximum Convective Updraft CAPE Calculation Lifted Index Calculation Maximum Updraft Strength Calculation I. Convective Available
Analysis of Severe Storm Initiation Along Drylines in the Southern Plains
 Analysis of Severe Storm Initiation Along Drylines in the Southern Plains NICOLE L. BARBEE Meteorology Program, Iowa State University, Ames Mentor: Dr. William Gallus 1 1 Department of Geological and Atmospheric
Development of new products by operational forecasters
 Development of new products by operational forecasters Probability of Thunder -algorithm Paavo Korpela Operational meteorologist & developer Safety Weather Centre Finnish Meteorological Institute Content
Environmental Characteristics Associated with Nighttime Tornadoes
 National Weather Association, Electronic Journal of Operational Meteorology, 2009-EJ3 Environmental Characteristics Associated with Nighttime Tornadoes Jonathan M. Davies Private Meteorologist, Trimble/Kansas
ATS 351, Spring 2010 Lab #9 Weather Radar - 55 points
 ATS 351, Spring 2010 Lab #9 Weather Radar - 55 points 1. (5 points) If a radar has a maximum unambiguous range of 300km, what is its PRF? (The speed of light, c, is equal to 3x10 8 m/s) 2. (5 points) Explain
2. What are the four most common gasses in the atmosphere and their percentages?
 Meteorology Review Directions: Answer the following open ended review questions. Utilize a diagram where appropriate and do make sure that you label and describe the drawing. Atmospheric Composition 1.
I. Convective Available Potential Energy (CAPE)
") Calculating CAPE, Lifted Index and Strength of Maximum Convective Updraft CAPE Calculation Lifted Index Calculation Maximum Updraft Strength Calculation I. Convective Available Potential Energy (CAPE)
Calculating CAPE, Lifted Index and Strength of Maximum Convective Updraft CAPE Calculation Lifted Index Calculation Maximum Updraft Strength Calculation I. Convective Available Potential Energy (CAPE)
Thunderstorm Dynamics. Helicity and Hodographs and their effect on thunderstorm longevity. Bluestein Vol II. Page
 Thunderstorm Dynamics Helicity and Hodographs and their effect on thunderstorm longevity Bluestein Vol II. Page471-476. Dowsell, 1991: A REVIEW FOR FORECASTERS ON THE APPLICATION OF HODOGRAPHS TO FORECASTING
Boundary-layer Decoupling Affects on Tornadoes
 Boundary-layer Decoupling Affects on Tornadoes Chris Karstens ABSTRACT The North American low-level jet is known to have substantial impacts on the climatology of central and eastern regions of the United
Department of Earth & Climate Sciences San Francisco State University
 Department of Earth & Climate Sciences San Francisco State University Name ERTH 260: Inclass Exercise #5 Working With Weather Maps and Soundings: Finding Pressure Features and Fronts Due Wednesday 28 February
THE SYNOPTIC ENVIRONMENT OF THE 11 APRIL 2001 CENTRAL PLAINS TORNADO OUTBREAK VIEWED IN THREE DIMENSIONS
 P1.1 THE SYNOPTIC ENVIRONMENT OF THE 11 APRIL 2001 CENTRAL PLAINS TORNADO OUTBREAK VIEWED IN THREE DIMENSIONS Daniel D. Nietfeld * NOAA/NWS/WFO Omaha/Valley, NE 1. INTRODUCTION A powerful low pressure
dv dt = f (M M g ) (1)
 (1)") Inertial, Symmetric and Conditional Symmetric Instability (CSI) The following is not meant to be a self-contained tutorial. It is meant to accompany active discussion and demonstration in the classroom.
Inertial, Symmetric and Conditional Symmetric Instability (CSI) The following is not meant to be a self-contained tutorial. It is meant to accompany active discussion and demonstration in the classroom.
P3.17 THE DEVELOPMENT OF MULTIPLE LOW-LEVEL MESOCYCLONES WITHIN A SUPERCELL. Joshua M. Boustead *1 NOAA/NWS Weather Forecast Office, Topeka, KS
 P3.17 THE DEVELOPMENT OF MULTIPLE LOW-LEVEL MESOCYCLONES WITHIN A SUPERCELL Joshua M. Boustead *1 NOAA/NWS Weather Forecast Office, Topeka, KS Philip N. Schumacher NOAA/NWS Weather Forecaster Office, Sioux
Weather report 28 November 2017 Campinas/SP
 Weather report 28 November 2017 Campinas/SP Summary: 1) Synoptic analysis and pre-convective environment 2) Verification 1) Synoptic analysis and pre-convective environment: At 1200 UTC 28 November 2017
Advanced Spotter Training: Anticipating Severe Weather Threats. Professor Paul Sirvatka College of DuPage Meteorology
 Advanced Spotter Training: Anticipating Severe Weather Threats College of DuPage Meteorology Preparing for Severe Weather Preparedness involves understanding the probable and potential threats. Understanding
Oakfield, WI Tornado of July 18 th, 1996: "Everything in its Right Place"
 Oakfield, WI Tornado of July 18 th, 1996: "Everything in its Right Place" Arian Sarsalari Department of Atmospheric and Oceanic Sciences, University of Wisconsin Madison ABSTRACT This paper will serve
P12.6 Multiple Modes of Convection in Moderate to High Wind Shear Environments
 P12.6 Multiple Modes of Convection in Moderate to High Wind Shear Environments Adam J. French and Matthew D. Parker North Carolina State University, Raleigh, North Carolina 1. INTRODUCTION A principle
Charles A. Doswell III, Harold E. Brooks, and Robert A. Maddox
 Charles A. Doswell III, Harold E. Brooks, and Robert A. Maddox Flash floods account for the greatest number of fatalities among convective storm-related events but it still remains difficult to forecast
Using the Golden Ratio as a Model for Tornadogenesis. George McGivern Brad Walton Dr. Mikhail Shvartsman
 Using the Golden Ratio as a Model for Tornadogenesis George McGivern Brad Walton Dr. Mikhail Shvartsman 1. Introduction: Intro to tornadoes and tornado forecasting. Problem and Goals: The main problems
contact with ground for 1 hour plus, starting 1500 MDT moved N., covered about 37 km width varied m
 Goal for today: Finish Ch. 11 Lightning, Thunder & Tornadoes 16 Nov., 2011 Edmonton tornado 31 July 1987 contact with ground for 1 hour plus, starting 1500 MDT moved N., covered about 37 km width varied
Feel free to ask me if you are confused about the meaning of any question. Good luck, and have a great spring break!
 Name: _ MEA 214 Midterm Exam, Spring 2011 Feel free to ask me if you are confused about the meaning of any question. Good luck, and have a great spring break! 1.) For each of the characteristics listed
The Impact of the Typhoon to East Malaysia on Orographic Effect
 Proceeding of the 2011 IEEE International Conference on Space Science and Communication (IconSpace) 12-13 July 2011, Penang, Malaysia The Impact of the Typhoon to East Malaysia on Orographic Effect Tan
Name: Section/TA Name: Atmospheric Science 101, Spring 2003 Midterm 2 Thursday 22 May 2003 Version A
 Name: Section/TA Name: Atmospheric Science 101, Spring 2003 Midterm 2 Thursday 22 May 2003 Version A Multiple Choice (2 points each) Choose the best answer and mark it on a Scantron sheet. 1. Choose the
DEPARTMENT OF EARTH & CLIMATE SCIENCES NAME SAN FRANCISCO STATE UNIVERSITY Fall ERTH FINAL EXAMINATION KEY 200 pts
 DEPARTMENT OF EARTH & CLIMATE SCIENCES NAME SAN FRANCISCO STATE UNIVERSITY Fall 2016 Part 1. Weather Map Interpretation ERTH 365.02 FINAL EXAMINATION KEY 200 pts Questions 1 through 9 refer to Figure 1,
11A.2 Forecasting Short Term Convective Mode And Evolution For Severe Storms Initiated Along Synoptic Boundaries
 11A.2 Forecasting Short Term Convective Mode And Evolution For Severe Storms Initiated Along Synoptic Boundaries Greg L. Dial and Jonathan P. Racy Storm Prediction Center, Norman, Oklahoma 1. Introduction
Dryline Convective Case Study: May 5th 2003 Severe Storm Outbreak
 Dryline Convective Case Study: May 5th 2003 Severe Storm Outbreak Abstract During the spring, thunderstorms develop ahead of a boundary called the dryline. This was the case with the May 4rd, 2003 Outbreak.
Mid-Latitude Cyclones and Fronts. Lecture 12 AOS 101
 Mid-Latitude Cyclones and Fronts Lecture 12 AOS 101 Homework 4 COLDEST TEMPS GEOSTROPHIC BALANCE Homework 4 FASTEST WINDS L Consider an air parcel rising through the atmosphere The parcel expands as it
Severe Weather with a strong cold front: 2-3 April 2006 By Richard H. Grumm National Weather Service Office State College, PA 16803
 Severe Weather with a strong cold front: 2-3 April 2006 By Richard H. Grumm National Weather Service Office State College, PA 16803 1. INTRODUCTION A strong cold front brought severe weather to much of
P1.3 Tornadoes in a Deceptively Small CAPE Environment: The 4/20/04 Outbreak in Illinois and Indiana
 P1.3 Tornadoes in a Deceptively Small CAPE Environment: The 4/20/04 Outbreak in Illinois and Indiana Albert E. Pietrycha* Jonathan M. Davies #, Mark Ratzer*, and Paul Merzlock* *National Weather Service,
WARM SECTOR TORNADOES WITHOUT DISCERNIBLE SURFACE BOUNDARIES AND WITH MINIMAL DEEP LAYER SHEA
 2.1 WARM SECTOR TORNADOES WITHOUT DISCERNIBLE SURFACE BOUNDARIES AND WITH MINIMAL DEEP LAYER SHEA * Joshua M. Boustead and Philip N. Schumacher National Weaer Service Sioux Falls, SD 1. INTRODUCTION On
Kenneth L. Pryor* and Gary P. Ellrod Center for Satellite Applications and Research (NOAA/NESDIS) Camp Springs, MD
 Camp Springs, MD") P1.57 GOES WMSI PROGRESS AND DEVELOPMENTS Kenneth L. Pryor* and Gary P. Ellrod Center for Satellite Applications and Research (NOAA/NESDIS) Camp Springs, MD 1. INTRODUCTION A multi-parameter index has
P1.57 GOES WMSI PROGRESS AND DEVELOPMENTS Kenneth L. Pryor* and Gary P. Ellrod Center for Satellite Applications and Research (NOAA/NESDIS) Camp Springs, MD 1. INTRODUCTION A multi-parameter index has
Aviation Hazards: Thunderstorms and Deep Convection
 Aviation Hazards: Thunderstorms and Deep Convection TREND Empirical thunderstorm forecasting techniques Contents Necessary conditions for convection: Instability Low-level moisture Trigger mechanism Forecasting
Multi-day severe event of May 2013
 Abstract: Multi-day severe event of 18-22 May 2013 By Richard H. Grumm and Charles Ross National Weather Service State College, PA A relatively slow moving Trough over the western United States and a ridge
Chapter 3 Convective Dynamics Part VI. Supercell Storms. Supercell Photos
 Chapter 3 Convective Dynamics Part VI. Supercell Storms Photographs Todd Lindley (This part contains materials taken from UCAR MCS training module) Supercell Photos 1 Introduction A supercel storm is defined
3. As warm, moist air moves into a region, barometric pressure readings in the region will generally 1. decrease 2. increase 3.
 Teacher: Mr. Prizzi Castle Learning Review 1 1. Which process most directly results in cloud formation? 1. condensation 3. precipitation 2. transpiration 4. radiation 2. An air mass originating over north
Chapter 3 Convective Dynamics
 Chapter 3 Convective Dynamics Photographs Todd Lindley 3.2 Ordinary or "air-mass storm 3.2.1. Main Characteristics Consists of a single cell (updraft/downdraft pair) Forms in environment characterized
Module 11: Meteorology Topic 6 Content: Severe Weather Notes
 Severe weather can pose a risk to you and your property. Meteorologists monitor extreme weather to inform the public about dangerous atmospheric conditions. Thunderstorms, hurricanes, and tornadoes are
b. The boundary between two different air masses is called a.
 NAME Earth Science Weather WebQuest Part 1. Air Masses 1. Find out what an air mass is. http://okfirst.mesonet.org/train/meteorology/airmasses.html a. What is an air mass? An air mass is b. The boundary
NOTES AND CORRESPONDENCE. Aspects of a Tornadic Left-Moving Thunderstorm of 25 May 1999
 614 WEATHER AND FORECASTING NOTES AND CORRESPONDENCE Aspects of a Tornadic Left-Moving Thunderstorm of 25 May 1999 JOHN F. DOSTALEK Cooperative Institute for Research in the Atmosphere, Colorado State
Weather Systems III: Thunderstorms and Twisters
 Weather Systems III: Thunderstorms and Twisters Review 1. Definition of airmasses? Bergeron classification of air masses 2. Surface weather analysis: Station model, wind speed code, present weather 3.
Thermodynamics We Can See! Adapted from ATS 541 notes (Dr. Susan van den Heever)
") Thermodynamics We Can See! Adapted from ATS 541 notes (Dr. Susan van den Heever) What we have learned so far ~ Moist Adiabatic Latent Heating ρ ρ Condensation ~ Dry Adiabatic Cloud Types Skew- T log- P
Thermodynamics We Can See! Adapted from ATS 541 notes (Dr. Susan van den Heever) What we have learned so far ~ Moist Adiabatic Latent Heating ρ ρ Condensation ~ Dry Adiabatic Cloud Types Skew- T log- P
CHAPTER 11 THUNDERSTORMS AND TORNADOES MULTIPLE CHOICE QUESTIONS
 CHAPTER 11 THUNDERSTORMS AND TORNADOES MULTIPLE CHOICE QUESTIONS 1. A thunderstorm is considered to be a weather system. a. synoptic-scale b. micro-scale c. meso-scale 2. By convention, the mature stage
ESCI 1010 Lab 6 Midlatitude Cyclones and Thunderstorms
 ESCI 1010 Lab 6 Midlatitude Cyclones and Thunderstorms Before Lab: Review pages 244-324 in your Weather and Climate textbook. Pay special attention to the sections entitled Fronts, Life Cyclone of a Midlatitude
An Unprecedented Wisconsin Tornado Outbreak on 18 August 2005
 An Unprecedented Wisconsin Tornado Outbreak on 18 August 2005 Zachary P. Uttech Department of Atmospheric and Oceanic Sciences University of Wisconsin-Madison May 5, 2009 ABSTRACT On 18 August 2005, a
SEVERE AND UNUSUAL WEATHER
 SEVERE AND UNUSUAL WEATHER Basic Meteorological Terminology Adiabatic - Referring to a process without the addition or removal of heat. A temperature change may come about as a result of a change in the
1 of 8 5/23/03 9:43 AM
 1 of 8 5/23/03 9:43 AM Interpreting Skew-Ts (Part One) Now that the basics of a Skew-T are understood, we can now talk about how to put all of it together, and learn how to interpret a Skew-T. It s important
Science Olympiad Meteorology Quiz #1 Page 1 of 7
 1) What is generally true about the stratosphere: a) Has turbulent updrafts and downdrafts. b) Has either a stable or increasing temperature profile with altitude. c) Where the auroras occur. d) Both a)
Pressure Conversion in Millibars
 Name Date The Weather Map Biggie Lab: Make it Colorful and Purty! Now that you have learned about all of the different variables that contribute to daily changes in weather, it is now time to bring it
2/27/2015. Big questions. What can we say about causes? Bottom line. Severe Thunderstorms, Tornadoes, and Climate Change: What We Do and Don t Know
 Severe Thunderstorms, Tornadoes, and Climate Change: What We Do and Don t Know Big questions How and why are weather hazards distributed? Are things changing in time and will they? HAROLD BROOKS NOAA/NSSL
Thermodynamics and Tornado Prediction. Tierney Dillon, Alex Lopez, Paddy Halloran. CAM Summer Research Summary Report August 31, 2015
 Thermodynamics and Tornado Prediction Tierney Dillon, Alex Lopez, Paddy Halloran CAM Summer Research Summary Report August 31, 2015 Advisors: Misha Shvartsman and Pavel Bělík 1 Introduction and Problem
Go With the Flow From High to Low Investigating Isobars
 Go With the Flow From High to Low Investigating Isobars Science 10 Mrs. Purba Air Masses The air over a warm surface can be heated, causing it to rise above more dense air. The result is the formation
San Francisco State University Department of Earth & Climate Sciences Fall 2017
 San Francisco State University Name Department of Earth & Climate Sciences Fall 2017 Part 1: Fronts Final Inclass Exercise (Inclass Exercise 11) Diagnosing Fronts and Upper Tropospheric Divergence Patterns
4/18/2010. National Weather Service. Severe Weather Forecasting: A Western North Carolina Case Study
 National Weather Service Severe Weather Forecasting: A Western North Carolina Case Study Laurence G. Lee Science and Operations Officer National Weather Service Greer, SC Plus 13 River Forecast Centers
DOPPLER RADAR OBSERVATIONS OF THE INTERACTIONS OF GRAVITY WAVES WITH MESOCYCLONES
 P13A.17 DOPPLER RADAR OBSERVATIONS OF THE INTERACTIONS OF GRAVITY WAVES WITH MESOCYCLONES Timothy A. Coleman* and Kevin R. Knupp The University of Alabama, Huntsville, Alabama 1. INTRODUCTION Several cases
Investigating the Environment of the Indiana and Ohio Tornado Outbreak of 24 August 2016 Using a WRF Model Simulation 1.
 Investigating the Environment of the Indiana and Ohio Tornado Outbreak of 24 August 2016 Using a WRF Model Simulation Kevin Gray and Jeffrey Frame Department of Atmospheric Sciences, University of Illinois
The Earth System - Atmosphere III Convection
 The Earth System - Atmosphere III Convection Thunderstorms 1. A thunderstorm is a storm that produces lightning (and therefore thunder) 2. Thunderstorms frequently produce gusty winds, heavy rain, and
1 of 7 Thunderstorm Notes by Paul Sirvatka College of DuPage Meteorology. Thunderstorms
 1 of 7 Thunderstorm Notes by Paul Sirvatka College of DuPage Meteorology Thunderstorms There are three types of thunderstorms: single-cell (or air mass) multicell (cluster or squall line) supercell Although
Air stability. About. Precipitation. air in unstable equilibrium will move--up/down Fig. 5-1, p.112. Adiabatic = w/ no exchange of heat from outside!
 Air stability About clouds Precipitation A mass of moist, stable air gliding up and over these mountains condenses into lenticular clouds. Fig. 5-CO, p.110 air in unstable equilibrium will move--up/down
1. Which weather map symbol is associated with extremely low air pressure? A) B) C) D) 2. The diagram below represents a weather instrument.
 B) C) D) 2. The diagram below represents a weather instrument.") 1. Which weather map symbol is associated with extremely low air pressure? 2. The diagram below represents a weather instrument. Which weather variable was this instrument designed to measure? A) air pressure
1. Which weather map symbol is associated with extremely low air pressure? 2. The diagram below represents a weather instrument. Which weather variable was this instrument designed to measure? A) air pressure
(Severe) Thunderstorms and Climate HAROLD BROOKS NOAA/NSSL
 Thunderstorms and Climate HAROLD BROOKS NOAA/NSSL") (Severe) Thunderstorms and Climate HAROLD BROOKS NOAA/NSSL HAROLD.BROOKS@NOAA.GOV Big questions How and why are weather hazards distributed? Are things changing in time and will they? Begin with thunderstorm
(Severe) Thunderstorms and Climate HAROLD BROOKS NOAA/NSSL HAROLD.BROOKS@NOAA.GOV Big questions How and why are weather hazards distributed? Are things changing in time and will they? Begin with thunderstorm
5.0 WHAT IS THE FUTURE ( ) WEATHER EXPECTED TO BE?
 WEATHER EXPECTED TO BE?") 5.0 WHAT IS THE FUTURE (2040-2049) WEATHER EXPECTED TO BE? This chapter presents some illustrative results for one station, Pearson Airport, extracted from the hour-by-hour simulations of the future period
5.0 WHAT IS THE FUTURE (2040-2049) WEATHER EXPECTED TO BE? This chapter presents some illustrative results for one station, Pearson Airport, extracted from the hour-by-hour simulations of the future period
1. Static Stability. (ρ V ) d2 z (1) d 2 z. = g (2) = g (3) T T = g T (4)
 d2 z (1) d 2 z. = g (2) = g (3) T T = g T (4)") NCAR (National Center for Atmospheric Research) has an excellent resource for education called COMET-MetEd. There you can find some really great tutorials on SkewT-LogP plots: visit http://www.meted.ucar.edu/mesoprim/skewt/index.htm.
NCAR (National Center for Atmospheric Research) has an excellent resource for education called COMET-MetEd. There you can find some really great tutorials on SkewT-LogP plots: visit http://www.meted.ucar.edu/mesoprim/skewt/index.htm.
Supercells. Base lecture and Graphics created by The COMET Program May University Corporation for Atmospheric Research
 Supercells Base lecture and Graphics created by The COMET Program May 2002 University Corporation for Atmospheric Research Objective To be able to forecast and better recognize supercell storms in all
AN INVESTIGATION OF THE JUNE 1984 BARNEVELD, WI TORNADO
 AN INVESTIGATION OF THE JUNE 1984 BARNEVELD, WI TORNADO BRANDON SWEDLUND Department of Atmospheric and Oceanic Sciences, University of Wisconsin, Madison, Wisconsin 13 May 2007 I. Introduction On the morning
24 TH CONFERENCE ON SEVERE LOCAL STORMS, OCTOBER 2008, SAVANNAH, GEORGIA
 P9.13 SUPER-RESOLUTION POLARIMETRIC OBSERVATIONS OF A CYCLIC TORNADIC SUPERCELL MATTHEW R. KUMJIAN*, ALEXANDER V. RYZHKOV, AND VALERY M. MELNIKOV Cooperative Institute for Mesoscale Meteorological Studies,
P4.6 DOCUMENTATION OF THE OVERLAND REINTENSIFICATION OF TROPICAL STORM ERIN OVER OKLAHOMA, AUGUST 18, 2007
 P4.6 DOCUMENTATION OF THE OVERLAND REINTENSIFICATION OF TROPICAL STORM ERIN OVER OKLAHOMA, AUGUST 18, 2007 John P. Monteverdi* San Francisco State University, San Francisco, CA Roger Edwards Storm Prediction
10/21/2012. Chapter 10 Thunderstorms. Part II. Growth and Development of ordinary Cell Thunderstorms Thunderstorm Electrification.
 Chapter 10 Thunderstorms Part I Growth and Development of ordinary Cell Thunderstorms Thunderstorm Electrification Tornadoes Part II Simplified model depicting the life cycle of an ordinary thunderstorm
Earth and Space Science. Teacher s Guide
 Earth and Space Science Teacher s Guide WALCH PUBLISHING Table of Contents To the Teacher............................................................. vi Classroom Management....................................................
Massive Storms! 8.10C Identify the role of the oceans in the formation of weather systems such as hurricanes
 Massive Storms! 8.10C Identify the role of the oceans in the formation of weather systems such as hurricanes Instructional page: Each person in group will take on one portion or set of questions: Each
Joshua M. Boustead *1, and Barbara E. Mayes NOAA/NWS WFO Omaha/Valley, NE. William Gargan, George Phillips, and Jared Leighton NOAA/NWS WFO Topeka, KS
 7B.3 Composite Analysis of Environmental Conditions Favorable for Significant Tornadoes across Eastern Kansas Joshua M. Boustead *1, and Barbara E. Mayes NOAA/NWS WFO Omaha/Valley, NE William Gargan, George