Oakfield, WI Tornado of July 18 th, 1996: "Everything in its Right Place"
|
|
|
- Dominick Lewis
- 5 years ago
- Views:
Transcription
1 Oakfield, WI Tornado of July 18 th, 1996: "Everything in its Right Place" Arian Sarsalari Department of Atmospheric and Oceanic Sciences, University of Wisconsin Madison ABSTRACT This paper will serve the purpose of proving that the storm that produced the 1996 Oakfield Tornado was different from other storms in the way that so many atmospheric phenomena lined up to create it. Many atmospheric circumstances have the characteristic that they make it difficult to predict the occurrence of weather events, supercell thunderstorms to be exact. On July 18 th, 1996, however, it should have been clear to any meteorologist with any amount of experience that things were to blow up in a quite electrifying way. This was extremely clear due to the amazing amount of atmospheric phenomena that fell in to place at exactly the right time.
2 1. Introduction In today s day and age, it still proves difficult to predict the occurrence of tornadic thunderstorms. This is so because even with all of the supercell indexes that have been created, atmospheric phenomena really have to cooperate with the forecaster in order for him to make a solid forecast. Early in the morning on July 18 th, 1996, short term quasi-geostrophic and mesoscale forecasting was made easy by the arrangement of the atmosphere. It is difficult to explain just how many things went right in order that these monster supercell storms flared up in the evening. 2. Data A wide variety of tools were utilized in the creation of the information to be presented. The tools implemented ETA forecast information (surface and upper air), GOES-8 (Geostationary Operational Environmental Satellite) infrared data at 4km resolution, NCDC storm reports, CIMSS case study information, NEXRAD composite radar data at 1km resolution, surface observations, and radiosonde data plotted in skew-t form. The combination of these mechanisms made it possible to create an in depth analysis of the Oakfield, WI tornado of July 18 th, Synoptic Overview The state of the troposphere, on the synoptic scale, will be investigated on many levels. To begin, the nucleus of the upper level flow was strewn across the northern end of the United States. This is clear to see in figure 1 due to the strong gradient of geopotential height at 500mb over the northern US. This point is further proven by figures 2 and 3, in which jet streams at 500mb and 200mb, respectively, are shown. In both of these plots, it is clear to see that the prevailing winds cover the northern half of the country, with the most intense winds, in fact, being just west of the area of interest. The fact that these plots were analyzed ten hours prior to the formation of the supercell of interest, coupled with the fact that the major features in the jet were centered over northeastern MN and northwestern WI, means that at the time of interest (22Z-00Z), the upper level vertical motion forcing associated with the jet streaks certainly must have been a factor in the creation of the supercells formed on that day. Allow us to analyze the 250mb jet streak (figure 3) in depth. At 12Z, the right entrance region (favorable for vertical ascent) is centered over southern MN. The left exit region, at this time, is centered over the northwestern edge of the upper peninsula of MI. If we follow the general flow of the area, it is clear to see that the left exit region does not come into the area of interest, so it is therefore thrown out as a possible cause
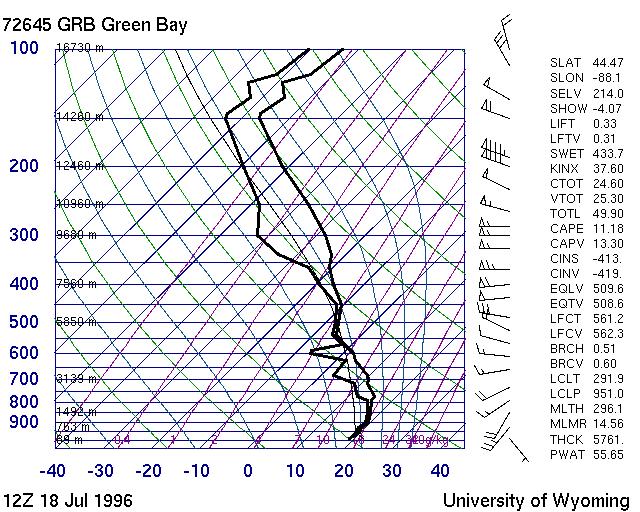
3 for vertical lifting. The right entrance region, however, follows the flow to be directly centered over central WI at the time of interest. The upward vertical motion associated with the upper level ageostrophic wind divergence eventually broke the capping inversion (which will be discussed later) which had built up to be so strong throughout the day. In addition to upward vertical motion associated with the upper level jet streaks, synoptic forcing also provided the right type of air mass collision to occur in exactly the right spot. Referring to figure 4, we can clearly see two major features. A low pressure system is centered over central Minnesota, while a strong High pressure system is centered over central Georgia. As the low pressure system pushed through, it brought cold air from the north behind the cold front associated with the cyclone. At the same time, the western tier of the anticyclone advected warm, moist air from the Gulf of Mexico into the northern Midwest. The clash of these two types of air masses certainly gives way to the development of intense convection, as air stability is dramatically lowered. 4. Mesoscale Discussion In the presence of a nearly perfect synoptic setup for the occurrence of thunderstorms, mesoscale dynamics also played a huge role in the formation of the ever famous supercells of July 18, To begin, allow us to investigate 850mb dewpoint contours at 12Z (figure 5). Because a strong gradient of dewpoint characterizes a dryline, it is clear to see a concentrated dryline ranging from northeastern Nebraska all the way through northeastern Wisconsin. At the time analyzed by this figure, the dryline sat west of the area of interest, but in the radar loop, it is clear to see that a large amount of supercells form along this dryline, as it progresses to the east, while tilting counterclockwise. Drylines represent the area between two clashing air masses (warm moist, and cool dry), and thunderstorms typically form along them in the spring and summer due to the intense instability of the air associated with the dryline. Also worth mentioning, surface winds converged heavily over central Minnesota at 12Z. This can be seen clearly in figure 10, where surface level streamlines are analyzed. Surface convergence is associated with upper level divergence, and consequently can be linked to convection. Another mesoscale tool used worth mentioning is the radiosonde data from 12Z on July18 th. Shown on figure 6 are an intensely moist boundary layer, and an equally as moist layer all the way up to 350mb. The most important piece of information gained from this sounding, however, is the extreme inversion at low levels. This inversion caused a capping effect, which means that due to the inversion, air is trapped at the bottom of the atmosphere and collects for hours, making the air more and more unstable. The inversion itself does not cause supercell thunderstorms to occur. Rather, the forcing provided by an outside source which breaks the inversion is responsible for causing the explosion associated with capping inversions, and ultimately causing severe weather. In this case, the right entrance region of the jet triggered the explosion with upward vertical motion. I believe that in the case of the Oakfield supercell, the inversion was so strong, and the
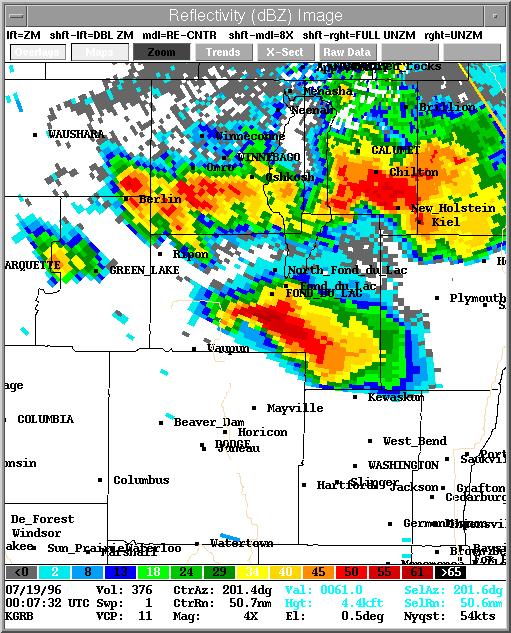
4 amount of trapped air so great, that the events of July 18 th, 1996 were unique compared to other thunderstorm outbreaks. It is also necessary to characterize the storm s appearance as having an intense hook-echo structure, which is a basically sure sign that a mesoscale circulation with the power to produce a tornado is takes place just prior to the tornado s touchdown (figure 7). When diagnosing the stability of the atmosphere, it is essential to calculate stability indices, as each tells you something different about the strength of the instability. The K index was calculated to be 38, meaning that there was an 80-90% chance of thunderstorms. Total Totals were at 51, meaning that a few isolated tornados would be possible. Also, the SWEAT index indicated, with a value of 434, that severe T-storms were probable, and tornados were possible. All of these stability indices pointed at the chance of tornadic thunderstorms as probable; however, the CAPE value measured at 12Z was slightly above 10. This is an extremely low value for CAPE, so the question must be asked: why? The only feasible explanation that can be that the inversion, at the time measured (12Z), was not in place long enough to destabilize the atmosphere enough to produce a high CAPE value. 5. Conclusion The Oakfield Tornado of July 18 th, 1996 created a large amount of damage and caused a large economical disaster. Many tornados create damage, and many storms create tornados. What sets this weather event apart from other similar events is that in the case of the Oakfield Tornado, an extremely large amount of convection-inducing factors took place on the synoptic, and mesoscale level. The combination of synoptic scale flow being directed along the upper US, synoptic scale upward vertical motion, the collision warm, moist air with cool, dry air, the sub sequential formation of a dryline, and most importantly, the extremely strong capping inversion that took place on July 18 th made it so unique.
5 REFERENCES Achtor, Tom, John Mecikalski, Scott Bachmeier, Mark Whipple, Pete Polkrandt, Ray Garcia, Wayne Feltz, Joleen Feltz, and Tony Wendricks. "The Oakfield, Wisconsin Case Study." CIMSS/UW-Madison Meteorology. CIMSS, UW-Madison Department of Atmospheric Sciences. Apr.-May 2006 < "Thunderstorms." Weatherbuff: Backyard Meteorology on the Web. Weatherbuff. Apr.-May 2006 <
6 figure 1
7 figure 2
8 figure 3
9 figure 4
10 figure 5
11 figure 6
12 figure 7
13
14 Figure 8
15 Figure 9
16 Figure 10
Case Study 3: Dryline in TX and OK 3 May 1999
 Case Study 3: Dryline in TX and OK 3 May 1999 Brandy Lumpkins Department of Atmospheric and Oceanic Sciences University of Wisconsin Madison 8 May 2006 ABSTRACT A massive tornadic outbreak swept across
The Jarrell Tornado of May 27, 1997
 The Jarrell Tornado of May 27, 1997 ANDREW MANKOWSKI University of Wisconsin Madison Atmospheric and Oceanic Sciences ABSTRACT A tornado outbreak occurred over Central Texas on May 27, 1997. This outbreak
Investigation of the Arizona Severe Weather Event of August 8 th, 1997
 Investigation of the Arizona Severe Weather Event of August 8 th, 1997 Tim Hollfelder May 10 th, 2006 Abstract Synoptic scale forcings were very weak for these thunderstorms on August 7-8, 1997 over the
The Oakfield, Wisconsin, Tornado from July Brett Berenz Student at the University of Wisconsin
 The Oakfield, Wisconsin, Tornado from 18-19 July 1996 Brett Berenz Student at the University of Wisconsin Abstract On July 18 th, 1996 an F5 tornado affected the region of Oakfield, Wisconsin. Leading
April 13, 2006: Analysis of the Severe Thunderstorms that produced Hail in Southern Wisconsin
 April 13, 2006: Analysis of the Severe Thunderstorms that produced Hail in Southern Wisconsin Danielle Triolo UW Madison Undergraduate 453 Case Study May 5, 2009 ABSTRACT On April 13, 2006 the states of
Science Olympiad Meteorology Quiz #2 Page 1 of 8
 1) The prevailing general direction of the jet stream is from west to east in the northern hemisphere: 2) Advection is the vertical movement of an air mass from one location to another: 3) Thunderstorms
ANSWER KEY. Part I: Synoptic Scale Composite Map. Lab 12 Answer Key. Explorations in Meteorology 54
 ANSWER KEY Part I: Synoptic Scale Composite Map 1. Using Figure 2, locate and highlight, with a black dashed line, the 500-mb trough axis. Also, locate and highlight, with a black zigzag line, the 500-mb
Anthony A. Rockwood Robert A. Maddox
 Anthony A. Rockwood Robert A. Maddox An unusually intense MCS produced large hail and wind damage in northeast Kansas and northern Missouri during the predawn hours of June 7 th, 1982. Takes a look at
WISCONSIN TORNADO OUTBREAK OF 18 AUGUST 2005: AN EXAMINATION OF THE VIOLA, WISCONSIN TORNADO
 WISCONSIN TORNADO OUTBREAK OF 18 AUGUST 2005: AN EXAMINATION OF THE VIOLA, WISCONSIN TORNADO Charles D. Koch University of Wisconsin Madison AOS 453: Mesoscale Meteorology Professor Greg Tripoli 13 May
Ki-Hong Min 1*, Seonhee Choo 2, and Gyuwon Lee 1, and Kyung-Eak Kim 1,3
 Ki-Hong Min 1*, Seonhee Choo 2, and Gyuwon Lee 1, and Kyung-Eak Kim 1,3 1 School of Earth System Sciences, Major in Atmospheric Science, Kyungpook National University, Daegu, South Korea 2 Forecast Technology
Summary of November Central U.S. Winter Storm By Christopher Hedge
 Summary of November 12-13 2010 Central U.S. Winter Storm By Christopher Hedge Event Overview The first significant snowfall of the 2010-2011 season affected portions of the plains and upper Mississippi
Summary of High Wind Event of 7 March 2004
 Summary of High Wind Event of 7 March 2004 This event was characterized by a very strong jet streak that developed over North Carolina by 00 UTC 8 March, as seen in the Eta model analysis at 300 mb, with
Ch. 3: Weather Patterns. Sect. 1: Air Mass & Fronts Sect. 2: Storms Sect. 3: Predicting the Weather
 Ch. 3: Weather Patterns Sect. 1: Air Mass & Fronts Sect. 2: Storms Sect. 3: Predicting the Weather Sect. 1: Air Masses & Fronts An air mass is a huge body of air that has similar temperature, humidity,
Quasi-Geostrophic Implications
 Chapter 10 Quasi-Geostrophic Implications When you look at a weather chart with all its isolines and plotted data, you need a framework upon which to interpret what you see. Quasi-geostrophic theory provides
The 13 April 2006 Severe Thunderstorm and Large Hail Event in Iowa & Wisconsin:A Case Study
 The 13 April 2006 Severe Thunderstorm and Large Hail Event in Iowa & Wisconsin:A Case Study David M. DeMeuse Undergraduate University of Wisconsin Department of Atmospheric & Oceanic Science Mesoscale
Chapter 12 Fronts & Air Masses
 Chapter overview: Anticyclones or highs Air Masses o Classification o Source regions o Air masses of North America Fronts o Stationary fronts o Cold fronts o Warm fronts o Fronts and the jet stream o Frontogenesis
Air Masses, Fronts, Storm Systems, and the Jet Stream
 Air Masses, Fronts, Storm Systems, and the Jet Stream Air Masses When a large bubble of air remains over a specific area of Earth long enough to take on the temperature and humidity characteristics of
Manuscript Received on 13 May Image Courtesy of Progressive Democrats of Wisconsin
 The Labor Day Tornadoes of 02 September 2002: An In-Depth Analysis of the Synoptic and Mesoscale Dynamics of the Rusk and Taylor Counties, WI Tornado Events Nickolas G. Grunseth, Atmospheric & Oceanic
and 24 mm, hPa lapse rates between 3 and 4 K km 1, lifted index values
 3.2 Composite analysis 3.2.1 Pure gradient composites The composite initial NE report in the pure gradient northwest composite (N = 32) occurs where the mean sea level pressure (MSLP) gradient is strongest
Multi-day severe event of May 2013
 Abstract: Multi-day severe event of 18-22 May 2013 By Richard H. Grumm and Charles Ross National Weather Service State College, PA A relatively slow moving Trough over the western United States and a ridge
P3.17 THE DEVELOPMENT OF MULTIPLE LOW-LEVEL MESOCYCLONES WITHIN A SUPERCELL. Joshua M. Boustead *1 NOAA/NWS Weather Forecast Office, Topeka, KS
 P3.17 THE DEVELOPMENT OF MULTIPLE LOW-LEVEL MESOCYCLONES WITHIN A SUPERCELL Joshua M. Boustead *1 NOAA/NWS Weather Forecast Office, Topeka, KS Philip N. Schumacher NOAA/NWS Weather Forecaster Office, Sioux
Final Examination, MEA 443 Fall 2008, Lackmann
 Place an X here to count it double! Name: Final Examination, MEA 443 Fall 2008, Lackmann If you wish to have the final exam count double and replace your midterm score, place an X in the box above. As
Name SOLUTIONS T.A./Section Atmospheric Science 101 Homework #6 Due Thursday, May 30 th (in class)
") Name SOLUTIONS T.A./Section Atmospheric Science 101 Homework #6 Due Thursday, May 30 th (in class) 1. General Circulation Briefly describe where each of the following features is found in the earth s general
Name SOLUTIONS T.A./Section Atmospheric Science 101 Homework #6 Due Thursday, May 30 th (in class) 1. General Circulation Briefly describe where each of the following features is found in the earth s general
Feel free to ask me if you are confused about the meaning of any question. Good luck, and have a great spring break!
 Name: _ MEA 214 Midterm Exam, Spring 2011 Feel free to ask me if you are confused about the meaning of any question. Good luck, and have a great spring break! 1.) For each of the characteristics listed
Practical Use of the Skew-T, log-p diagram for weather forecasting. Primer on organized convection
 Practical Use of the Skew-T, log-p diagram for weather forecasting Primer on organized convection Outline Rationale and format of the skew-t, log-p diagram Some basic derived diagnostic measures Characterizing
Type of storm viewed by Spotter A Ordinary, multi-cell thunderstorm. Type of storm viewed by Spotter B Supecell thunderstorm
 ANSWER KEY Part I: Locating Geographical Features 1. The National Weather Service s Storm Prediction Center (www.spc.noaa.gov) has issued a tornado watch on a warm spring day. The watch covers a large
1 of 7 Thunderstorm Notes by Paul Sirvatka College of DuPage Meteorology. Thunderstorms
 1 of 7 Thunderstorm Notes by Paul Sirvatka College of DuPage Meteorology Thunderstorms There are three types of thunderstorms: single-cell (or air mass) multicell (cluster or squall line) supercell Although
Climate vs. Weather. Weather: Short term state of the atmosphere. Climate: The average weather conditions in an area over a long period of time
 Weather and Climate Climate vs. Weather Weather: Short term state of the atmosphere. Temperature, humidity, cloud cover, precipitation, winds, visibility, air pressure, air pollution, etc Climate: The
CHAPTER 11 THUNDERSTORMS AND TORNADOES MULTIPLE CHOICE QUESTIONS
 CHAPTER 11 THUNDERSTORMS AND TORNADOES MULTIPLE CHOICE QUESTIONS 1. A thunderstorm is considered to be a weather system. a. synoptic-scale b. micro-scale c. meso-scale 2. By convention, the mature stage
p = ρrt p = ρr d = T( q v ) dp dz = ρg
 dp dz = ρg") Chapter 1: Properties of the Atmosphere What are the major chemical components of the atmosphere? Atmospheric Layers and their major characteristics: Troposphere, Stratosphere Mesosphere, Thermosphere
Chapter 1: Properties of the Atmosphere What are the major chemical components of the atmosphere? Atmospheric Layers and their major characteristics: Troposphere, Stratosphere Mesosphere, Thermosphere
ATS 351, Spring 2010 Lab #11 Severe Weather 54 points
 ATS 351, Spring 2010 Lab #11 Severe Weather 54 points Question 1 (10 points): Thunderstorm development a) Sketch and describe the stages of development of a single cell thunderstorm. About how long does
Thunderstorm: a cumulonimbus cloud or collection of cumulonimbus clouds featuring vigorous updrafts, precipitation and lightning
 Thunderstorm: a cumulonimbus cloud or collection of cumulonimbus clouds featuring vigorous updrafts, precipitation and lightning Thunderstorms are responsible for most of what we refer to as severe weather,
MET Lecture 29 Tornadoes IV
 MET 4300 Lecture 29 Tornadoes IV Outline Definition, life cycle, & climatology of tornadoes Tornado formation within supercells Tornado formation within nonsupercell thunderstorms Fujita scale Tornado
How Can You Predict Weather Changes?
 How Can You Predict Weather Changes? How to Predict Weather Meteorologists make weather predictions daily. They use the same processes that you will. They collect weather data. They plot the data on maps.
An Unprecedented Wisconsin Tornado Outbreak on 18 August 2005
 An Unprecedented Wisconsin Tornado Outbreak on 18 August 2005 Zachary P. Uttech Department of Atmospheric and Oceanic Sciences University of Wisconsin-Madison May 5, 2009 ABSTRACT On 18 August 2005, a
Department of Geosciences San Francisco State University Spring Metr 201 Monteverdi Quiz #5 Key (100 points)
") Department of Geosciences Name San Francisco State University Spring 2012 Metr 201 Monteverdi Quiz #5 Key (100 points) 1. Fill in the Blank or short definition. (3 points each for a total of 15 points)
Department of Geosciences Name San Francisco State University Spring 2012 Metr 201 Monteverdi Quiz #5 Key (100 points) 1. Fill in the Blank or short definition. (3 points each for a total of 15 points)
Global Wind Patterns
 Name: Earth Science: Date: Period: Global Wind Patterns 1. Which factor causes global wind patterns? a. changes in the distance between Earth and the Moon b. unequal heating of Earth s surface by the Sun
severe VOLUME 5, NUMBER 1, FEBRUARY 1980
 severe VOLUME 5, NUMBER 1, FEBRUARY 1980 TORNADIC THUNDERSTORM DEVELOPMENT IN WEST TEXAS 27 MAY 1978 by Richard E. Peterson Atmospheric Science Group Texas University Lubbock, TX and Alan Johnson National
Advanced Spotter Training Lesson 4: The Nature of Thunderstorms
 Advanced Spotter Training 2009 Lesson 4: The Nature of Thunderstorms From Last Time We discussed the different ways to make air rise. We discussed convection, convergence, and the different kinds of fronts.
Weather Systems III: Thunderstorms and Twisters
 Weather Systems III: Thunderstorms and Twisters Review 1. Definition of airmasses? Bergeron classification of air masses 2. Surface weather analysis: Station model, wind speed code, present weather 3.
AOSC201: Weather and Climate Lab
 AOSC201: Weather and Climate Lab Week 8: Forecasting - Analysis Section 107/108 Instructor: Agniv Sengupta q Lab #7 of Lab Manual (pages 41-49) q 50 points in total q INDIVIDUAL Work for the entire lab
Chapter 9. Weather Patterns & Midlatitude Cyclones
 Chapter 9 Weather Patterns & Midlatitude Cyclones Frontal Weather Fronts are boundary surfaces between different air masses. Warm front Cold front Stationary front Occluded front Drylines Frontal Weather
A Mesoscale Analysis of the March 29, 1998 Comfrey Tornado
 A Mesoscale Analysis of the March 29, 1998 Comfrey Tornado Joseph D. Hoechst Undergraduate Atmospheric and Oceanic Sciences University of Wisconsin Madison Email: hoechst@wisc.edu Department of Atmospheric
Chapter 1. Introduction
 Chapter 1. Introduction In this class, we will examine atmospheric phenomena that occurs at the mesoscale, including some boundary layer processes, convective storms, and hurricanes. We will emphasize
Thunderstorm: a cumulonimbus cloud or collection of cumulonimbus clouds featuring vigorous updrafts, precipitation and lightning
 Thunderstorm: a cumulonimbus cloud or collection of cumulonimbus clouds featuring vigorous updrafts, precipitation and lightning Thunderstorm: a cumulonimbus cloud or collection of cumulonimbus clouds
Tornadogenesis in Supercells: The Three Main Ingredients. Ted Funk
 Tornadogenesis in Supercells: The Three Main Ingredients Ted Funk NWS Louisville, KY Spring 2002 Environmental Parameters Supercells occur within environments exhibiting several wellknown characteristics
Climate versus Weather
 Climate versus Weather What is climate? Climate is the average weather usually taken over a 30-year time period for a particular region and time period. Climate is not the same as weather, but rather,
P0.98 Composite Analysis of Heavy-Rain-Producing Elevated Thunderstorms in the MO-KS-OK region of the United States
 P0.98 Composite Analysis of Heavy-Rain-Producing Elevated Thunderstorms in the MO-KS-OK region of the United States Laurel P. McCoy and Patrick S. Market Department of Soil, Environmental, and Atmospheric
AN INVESTIGATION OF THE JUNE 1984 BARNEVELD, WI TORNADO
 AN INVESTIGATION OF THE JUNE 1984 BARNEVELD, WI TORNADO BRANDON SWEDLUND Department of Atmospheric and Oceanic Sciences, University of Wisconsin, Madison, Wisconsin 13 May 2007 I. Introduction On the morning
Forecasting Weather: Air Masses and Fronts
 Forecasting Weather: Air Masses and Fronts Weather is a combination of local conditions at any one time. It's what's happening outside right now, right here. Weather includes: Temperature Humidity Air
Solutions to Comprehensive Final Examination Given on Thursday, 13 December 2001
 Name & Signature Dr. Droegemeier Student ID Meteorology 1004 Introduction to Meteorology Fall, 2001 Solutions to Comprehensive Final Examination Given on Thursday, 13 December 2001 BEFORE YOU BEGIN!! Please
Comparison of November 15, 2008 Killer Tornado Outbreak with the December 2, 2009 Non Tornado Event
 Comparison of November 15, 2008 Killer Tornado Outbreak with the December 2, 2009 Non Tornado Event The two events featured similar patterns but with much different results in central NC. The slides on
Analysis of Severe Storm Initiation Along Drylines in the Southern Plains
 Analysis of Severe Storm Initiation Along Drylines in the Southern Plains NICOLE L. BARBEE Meteorology Program, Iowa State University, Ames Mentor: Dr. William Gallus 1 1 Department of Geological and Atmospheric
Impacts of the April 2013 Mean trough over central North America
 Impacts of the April 2013 Mean trough over central North America By Richard H. Grumm National Weather Service State College, PA Abstract: The mean 500 hpa flow over North America featured a trough over
Lec 10: Interpreting Weather Maps
 Lec 10: Interpreting Weather Maps Case Study: October 2011 Nor easter FIU MET 3502 Synoptic Hurricane Forecasts Genesis: on large scale weather maps or satellite images, look for tropical waves (Africa
Weather report 28 November 2017 Campinas/SP
 Weather report 28 November 2017 Campinas/SP Summary: 1) Synoptic analysis and pre-convective environment 2) Verification 1) Synoptic analysis and pre-convective environment: At 1200 UTC 28 November 2017
The Earth System - Atmosphere III Convection
 The Earth System - Atmosphere III Convection Thunderstorms 1. A thunderstorm is a storm that produces lightning (and therefore thunder) 2. Thunderstorms frequently produce gusty winds, heavy rain, and
Foundations of Earth Science, 6e Lutgens, Tarbuck, & Tasa
 Foundations of Earth Science, 6e Lutgens, Tarbuck, & Tasa Weather Patterns and Severe Weather Foundations, 6e - Chapter 14 Stan Hatfield Southwestern Illinois College Air masses Characteristics Large body
BENSON, MINNESOTA CONVECTIVE SYSTEM ON JUNE 11, 2001
 BENSON, MINNESOTA CONVECTIVE SYSTEM ON JUNE 11, 2001 Steve Froehlich Department of Atmospheric and Oceanic Sciences, University of Wisconsin at Madison Abstract On June 11, 2001 a strong convective cell
Charles A. Doswell III, Harold E. Brooks, and Robert A. Maddox
 Charles A. Doswell III, Harold E. Brooks, and Robert A. Maddox Flash floods account for the greatest number of fatalities among convective storm-related events but it still remains difficult to forecast
Multiscale Analyses of Inland Tropical Cyclone Midlatitude Jet Interactions: Camille (1969) and Danny (1997)
 and Danny (1997)") Multiscale Analyses of Inland Tropical Cyclone Midlatitude Jet Interactions: Camille (1969) and Danny (1997) Matthew Potter, Lance Bosart, and Daniel Keyser Department of Atmospheric and Environmental
Multiscale Analyses of Inland Tropical Cyclone Midlatitude Jet Interactions: Camille (1969) and Danny (1997) Matthew Potter, Lance Bosart, and Daniel Keyser Department of Atmospheric and Environmental
 http://www.ssec.wisc.edu/data/composites.html Red curve: Incoming solar radiation Blue curve: Outgoing infrared radiation. Three-cell model of general circulation Mid-latitudes: 30 to 60 latitude MID-LATITUDES
Chapter 3 Convective Dynamics Part VI. Supercell Storms. Supercell Photos
 Chapter 3 Convective Dynamics Part VI. Supercell Storms Photographs Todd Lindley (This part contains materials taken from UCAR MCS training module) Supercell Photos 1 Introduction A supercel storm is defined
National Weather Service-Pennsylvania State University Weather Events
 National Weather Service-Pennsylvania State University Weather Events Historic Ohio Valley January Severe weather and Tornado Event by Richard H. Grumm National Weather Service State College PA 16803 and
The development and evolution of deep convection and heavy rainfall
 The development and evolution of deep convection and heavy rainfall Unique in spectra, space and time The spatial and temporal domains of the phenomena being investigated drive the satellite s spectral
Chapter 14 Thunderstorm Fundamentals
 Chapter overview: Thunderstorm appearance Thunderstorm cells and evolution Thunderstorm types and organization o Single cell thunderstorms o Multicell thunderstorms o Orographic thunderstorms o Severe
July24th, 2008 New Hampshire tornado. Hunter Straus. University of Wisconsin department of Atmospheric and Oceanic Sciences Madison, WI ABSTRACT
 July24th, 2008 New Hampshire tornado Hunter Straus University of Wisconsin department of Atmospheric and Oceanic Sciences Madison, WI 53715 ABSTRACT On July 24 th, 2008 at approximately 1530Z, an EF-2
The Integration of WRF Model Forecasts for Mesoscale Convective Systems Interacting with the Mountains of Western North Carolina
 Proceedings of The National Conference On Undergraduate Research (NCUR) 2006 The University of North Carolina at Asheville Asheville, North Carolina April 6-8, 2006 The Integration of WRF Model Forecasts
Paul Yura*, Frank Alsheimer, and Joseph Calderone NOAA, National Weather Service Forecast Office, Charleston South Carolina 1.
 7B.8 AN EXAMINATION OF THE SYNOPTIC AND MESOSCALE ENVIRONMENTS INVOLVED IN TORNADO OUTBREAKS FROM HURRICANES FRANCES (2004) AND JEANNE (2004) OVER NORTHEAST COASTAL GEORGIA AND SOUTHERN SOUTH CAROLINA
Meteorology Lecture 19
 Meteorology Lecture 19 Robert Fovell rfovell@albany.edu 1 Important notes These slides show some figures and videos prepared by Robert G. Fovell (RGF) for his Meteorology course, published by The Great
Satellites, Weather and Climate Module 9: Air/sea interactions winter cyclogenesis
 Satellites, Weather and Climate Module 9: Air/sea interactions winter cyclogenesis Winter storms things to consider Deep moisture Thermal discontinuity Favorable surface and upper level features Geographical
P12.6 Multiple Modes of Convection in Moderate to High Wind Shear Environments
 P12.6 Multiple Modes of Convection in Moderate to High Wind Shear Environments Adam J. French and Matthew D. Parker North Carolina State University, Raleigh, North Carolina 1. INTRODUCTION A principle
Why There Is Weather?
 Lecture 6: Weather, Music Of Our Sphere Weather and Climate WEATHER The daily fluctuations in atmospheric conditions. The atmosphere on its own can produce weather. (From Understanding Weather & Climate)
Air Masses of North America cp and ca air masses Air mass characterized by very cold and dry conditions
 Chapter 8: Air Masses, Fronts, and Middle-Latitude Cyclones Air masses Fronts Middle-latitude cyclones Air Masses Air mass an extremely large body of air whose properties of temperature and humidity are
THE SYNOPTIC ENVIRONMENT OF THE 11 APRIL 2001 CENTRAL PLAINS TORNADO OUTBREAK VIEWED IN THREE DIMENSIONS
 P1.1 THE SYNOPTIC ENVIRONMENT OF THE 11 APRIL 2001 CENTRAL PLAINS TORNADO OUTBREAK VIEWED IN THREE DIMENSIONS Daniel D. Nietfeld * NOAA/NWS/WFO Omaha/Valley, NE 1. INTRODUCTION A powerful low pressure
The Boundary Layer and Related Phenomena
 The Boundary Layer and Related Phenomena Jeremy A. Gibbs University of Oklahoma gibbz@ou.edu February 19, 2015 1 / 49 Overview Nocturnal Low-Level Jets Introduction Climatology of LLJs Meteorological Importance
1. Which weather map symbol is associated with extremely low air pressure? A) B) C) D) 2. The diagram below represents a weather instrument.
 B) C) D) 2. The diagram below represents a weather instrument.") 1. Which weather map symbol is associated with extremely low air pressure? 2. The diagram below represents a weather instrument. Which weather variable was this instrument designed to measure? A) air pressure
1. Which weather map symbol is associated with extremely low air pressure? 2. The diagram below represents a weather instrument. Which weather variable was this instrument designed to measure? A) air pressure
True or false: The atmosphere is always in hydrostatic balance. A. True B. False
 Clicker Questions and Clicker Quizzes Clicker Questions Chapter 7 Of the four forces that affect the motion of air in our atmosphere, which is to thank for opposing the vertical pressure gradient force
Hurricanes and Tropical Weather Systems:
 Hurricanes and Tropical Weather Systems: An influence on weather in parts of the USA Meteorology 411 Iowa State University Week 2 Bill Gallus Classification/Terminology Tropical Disturbance enhanced convection
NOTES Surface Weather Maps.notebook. April 05, atmospheric. rises. Coriolis. Coriolis. counterclockwise. counterclockwise. point. origin.
 Surface Weather Maps L Symbol : Indicates an area of low air pressure (aka, pressure or pressure). Called a relatively barometric atmospheric cyclone Formation: As warm air in the center cyclone of a,
Science Olympiad Meteorology Quiz #1 Page 1 of 7
 1) What is generally true about the stratosphere: a) Has turbulent updrafts and downdrafts. b) Has either a stable or increasing temperature profile with altitude. c) Where the auroras occur. d) Both a)
Determining Environmental Parameters Most Important for Significant Cool Season Tornadoes across the Gulf Coastal States
 Determining Environmental Parameters Most Important for Significant Cool Season Tornadoes across the Gulf Coastal States Kar retta Venable Jackson State University, Jackson, MS Mentors David Imy NOAA/NWS/NCEP/Storm
Dryline Convective Case Study: May 5th 2003 Severe Storm Outbreak
 Dryline Convective Case Study: May 5th 2003 Severe Storm Outbreak Abstract During the spring, thunderstorms develop ahead of a boundary called the dryline. This was the case with the May 4rd, 2003 Outbreak.
Severe Weather with a strong cold front: 2-3 April 2006 By Richard H. Grumm National Weather Service Office State College, PA 16803
 Severe Weather with a strong cold front: 2-3 April 2006 By Richard H. Grumm National Weather Service Office State College, PA 16803 1. INTRODUCTION A strong cold front brought severe weather to much of
Department of Earth & Climate Sciences Spring 2016 Meteorology 260
 Department of Earth & Climate Sciences Spring 2016 Meteorology 260 Name Laboratory #9 Key: Joplin Tornado Day Subsynoptic, Thermodynamic, and Wind Shear Setting Part A: 1600 UTC Surface Chart Subsynoptic
MSG FOR NOWCASTING - EXPERIENCES OVER SOUTHERN AFRICA
 MSG FOR NOWCASTING - EXPERIENCES OVER SOUTHERN AFRICA Estelle de Coning and Marianne König South African Weather Service, Private Bag X097, Pretoria 0001, South Africa EUMETSAT, Am Kavalleriesand 31, D-64295
ESCI 1010 Lab 6 Midlatitude Cyclones and Thunderstorms
 ESCI 1010 Lab 6 Midlatitude Cyclones and Thunderstorms Before Lab: Review pages 244-324 in your Weather and Climate textbook. Pay special attention to the sections entitled Fronts, Life Cyclone of a Midlatitude
Warm season forecasting! Some material adapted from Material Produced at COMET for their Residence Course in Hydrometeorology
 Warm season forecasting! Some material adapted from Material Produced at COMET for their Residence Course in Hydrometeorology 1 Outline! Types of stability and application to forecasting! Dry and moist
Space Atmospheric Gases. the two most common gases; found throughout all the layers a form of oxygen found in the stratosphere
 Earth s atmospheric layers Earth s atmosphere is the layer of gases that surrounds the planet and makes conditions on Earth suitable for living things. Layers Earth s atmosphere is divided into several
Examination #3 Wednesday, 28 November 2001
 Name & Signature Dr. Droegemeier Student ID Meteorology 1004 Introduction to Meteorology Fall, 2001 Examination #3 Wednesday, 28 November 2001 BEFORE YOU BEGIN!! Please be sure to read each question CAREFULLY
DEPARTMENT OF EARTH & CLIMATE SCIENCES NAME SAN FRANCISCO STATE UNIVERSITY Fall ERTH FINAL EXAMINATION KEY 200 pts
 DEPARTMENT OF EARTH & CLIMATE SCIENCES NAME SAN FRANCISCO STATE UNIVERSITY Fall 2016 Part 1. Weather Map Interpretation ERTH 365.02 FINAL EXAMINATION KEY 200 pts Questions 1 through 9 refer to Figure 1,
Air Mass. 1. Air Mass : Large body of Air with similar temperature and humidity (or moisture) ; 4 types
 ; 4 types") Air Mass 1. Air Mass : Large body of Air with similar temperature and humidity (or moisture) ; 4 types A. Continental-relatively dry air masses that form over land. B. Maritime: relatively humid air masses
Air Mass 1. Air Mass : Large body of Air with similar temperature and humidity (or moisture) ; 4 types A. Continental-relatively dry air masses that form over land. B. Maritime: relatively humid air masses
Practical Atmospheric Analysis
 Chapter 12 Practical Atmospheric Analysis With the ready availability of computer forecast models and statistical forecast data, it is very easy to prepare a forecast without ever looking at actual observations,
SEVERE WEATHER AND FRONTS TAKE HOME QUIZ
 1. Most of the hurricanes that affect the east coast of the United States originally form over the A) warm waters of the Atlantic Ocean in summer B) warm land of the southeastern United States in summer
Mid-Latitude Cyclones and Fronts. Lecture 12 AOS 101
 Mid-Latitude Cyclones and Fronts Lecture 12 AOS 101 Homework 4 COLDEST TEMPS GEOSTROPHIC BALANCE Homework 4 FASTEST WINDS L Consider an air parcel rising through the atmosphere The parcel expands as it
Science 1206 Chapter 1 - Inquiring about Weather
 Science 1206 Chapter 1 - Inquiring about Weather 1.1 - The Atmosphere: Energy Transfer and Properties (pp. 10-25) Weather and the Atmosphere weather the physical conditions of the atmosphere at a specific
Ch. 3: Weather Patterns
 Ch. 3: Weather Patterns Sect. 1: Air Mass & Fronts Sect. 2: Storms Sect. 3: Predicting the Weather Sect. 4: Weather forecasters use advanced technologies Ch. 3 Weather Fronts and Storms Objective(s) 7.E.1.3
Page 1. Name:
 Name: 1) As the difference between the dewpoint temperature and the air temperature decreases, the probability of precipitation increases remains the same decreases 2) Which statement best explains why
WARM SECTOR TORNADOES WITHOUT DISCERNIBLE SURFACE BOUNDARIES AND WITH MINIMAL DEEP LAYER SHEA
 2.1 WARM SECTOR TORNADOES WITHOUT DISCERNIBLE SURFACE BOUNDARIES AND WITH MINIMAL DEEP LAYER SHEA * Joshua M. Boustead and Philip N. Schumacher National Weaer Service Sioux Falls, SD 1. INTRODUCTION On
Severe Thunderstorms. MET 200 Lecture 24 Flooding in Hawaii and Intro to Severe Thunderstorms. MET 200 Lecture 24 Severe Thunderstorms.
 MET 200 Lecture 24 Severe Thunderstorms Damage Swath 1 2 MET 200 Lecture 24 Flooding in Hawaii and Intro to Severe Thunderstorms Severe Thunderstorms Kona Lows Cause more flash floods in Hawaii than any