Fronts in November 1998 Storm
|
|
|
- Douglas Haynes
- 5 years ago
- Views:
Transcription
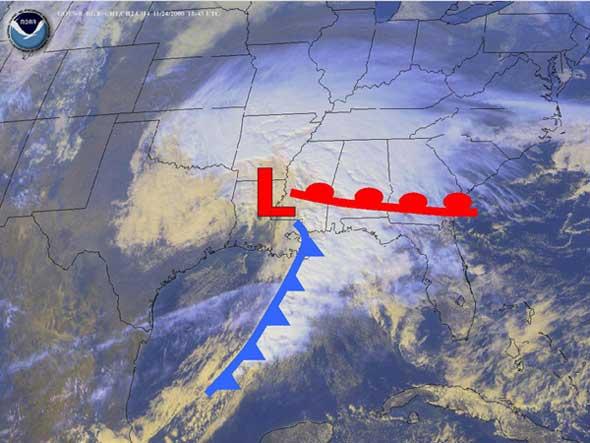
1 Fronts in November 1998 Storm Much of the significant weather observed in association with extratropical storms tends to be concentrated within narrow bands called frontal zones.
2 Fronts in November 1998 Storm Much of the significant weather observed in association with extratropical storms tends to be concentrated within narrow bands called frontal zones. These zones are marked by sharp horizontal gradients and sometimes even by discontinuities in wind and temperature.
3 Fronts in November 1998 Storm Much of the significant weather observed in association with extratropical storms tends to be concentrated within narrow bands called frontal zones. These zones are marked by sharp horizontal gradients and sometimes even by discontinuities in wind and temperature. We will now investigate the frontal zones at the earth s surface observed in association with this storm.
4 Wind and Pressure Sea-level pressure, surface winds and frontal positions at 00, 09, and 18 UTC, 10 November The contour interval for sea-level pressure is 4 hpa. 2
5 Sea-level pressure, surface winds and frontal positions at 00 UTC, 10 Nov The contour interval for sea-level pressure is 4 hpa. 3
6 Sea-level pressure, surface winds and frontal positions at 09 UTC, 10 Nov The contour interval for sea-level pressure is 4 hpa. 4
7 Sea-level pressure, surface winds and frontal positions at 18 UTC, 10 Nov The contour interval for sea-level pressure is 4 hpa. 5
8 At all three map times, a pronounced windshift line (rendered in solid blue) is evident to the south of the surface low. 6
9 At all three map times, a pronounced windshift line (rendered in solid blue) is evident to the south of the surface low. To the west of the line, the surface winds exhibit a strong westerly component, whereas to the east of it the southerly wind component is dominant. 6
10 At all three map times, a pronounced windshift line (rendered in solid blue) is evident to the south of the surface low. To the west of the line, the surface winds exhibit a strong westerly component, whereas to the east of it the southerly wind component is dominant. The isobars bend sharply along the windshift line. Hence, a fixed observer experiencing a windshift line would observe a V-shaped pressure trace, with a negative tendency as the front approaches, followed by a sharp rising tendency following the frontal passage. 6
11 At all three map times, a pronounced windshift line (rendered in solid blue) is evident to the south of the surface low. To the west of the line, the surface winds exhibit a strong westerly component, whereas to the east of it the southerly wind component is dominant. The isobars bend sharply along the windshift line. Hence, a fixed observer experiencing a windshift line would observe a V-shaped pressure trace, with a negative tendency as the front approaches, followed by a sharp rising tendency following the frontal passage. This windshift line advances eastward, keeping pace with and showing some tendency to wrap around the surface low as it deepens and tracks northeastward. It appears as though this feature is being advected by the intensifying cyclonic circulation. 6
12 The red windshift line extending eastward from the surface low is a more subtle feature, which becomes clearer when the surface charts are analyzed in conjunction with hourly station data (later). 7
13 The red windshift line extending eastward from the surface low is a more subtle feature, which becomes clearer when the surface charts are analyzed in conjunction with hourly station data (later). Like the blue windshift line it shows indications of being advected around the developing surface low, and when it passes a station the wind shifts in a cyclonic sense, in this case from southeasterly to southerly. 7
14 In the later stages of the development of the cyclone, the junction between the red and blue windshift lines becomes separated from center of the the surface low and a third type of windshift line, (in purple) extends from the center of the surface low to a triple point where it meets the junction of the red and blue lines. 8
15 In the later stages of the development of the cyclone, the junction between the red and blue windshift lines becomes separated from center of the the surface low and a third type of windshift line, (in purple) extends from the center of the surface low to a triple point where it meets the junction of the red and blue lines. When this line passes a station, the surface wind shifts cyclonically from southeasterly to southwesterly. 8
16 These windshift lines are observed in most extratropical cyclones. 9
17 These windshift lines are observed in most extratropical cyclones. In this particular cyclone yet another windshift line is discernible, (dashed blue in the charts for 00 and 09 UTC): 9
18 These windshift lines are observed in most extratropical cyclones. In this particular cyclone yet another windshift line is discernible, (dashed blue in the charts for 00 and 09 UTC): In the 00 UTC chart, the line curves eastward from the eastern slope of the Colorado Rockies and then northeastward into the the center of the surface low. This windshift line is also embedded in a trough in the sea-level pressure field, and when it passes a fixed station the wind shifts in a cyclonic sense. 9

19 Review: Sea-level pressure, surface winds and frontal positions at 00, 09, and 18 UTC, 10 November The contour interval for sea-level pressure is 4 hpa. 10
 and frontal positions at 00, 09, and 18 UT 10 November 1998. 11")
20 Surface Temperature The temperature field below is represented by raw station data rather than by isotherms, and the positions of the windshift lines are transcribed from the previous figures. Surface air temperature (in C) and frontal positions at 00, 09, and 18 UT 10 November

21 Surface air temperature (in C) and frontal positions at 00 UTC, 10 November

22 Surface air temperature (in C) and frontal positions at 09 UTC, 10 November

23 Surface air temperature (in C) and frontal positions at 18 UTC, 10 November
24 In the southerly flow off the Gulf of Mexico to the east of the blue windshift line, temperatures are relatively uniform, with values in excess of 20 C extending as far northward as southern Illinois and values in the teens as far northward as the Great Lakes. 15
25 In the southerly flow off the Gulf of Mexico to the east of the blue windshift line, temperatures are relatively uniform, with values in excess of 20 C extending as far northward as southern Illinois and values in the teens as far northward as the Great Lakes. This zone of relatively uniform temperature to the southeast of the surface low is referred to as the warm sector of a cyclone. 15
26 In the southerly flow off the Gulf of Mexico to the east of the blue windshift line, temperatures are relatively uniform, with values in excess of 20 C extending as far northward as southern Illinois and values in the teens as far northward as the Great Lakes. This zone of relatively uniform temperature to the southeast of the surface low is referred to as the warm sector of a cyclone. The blue windshift line marks the leading edge of the advancing colder air from the west, and is referred to as the cold front. 15
27 In the southerly flow off the Gulf of Mexico to the east of the blue windshift line, temperatures are relatively uniform, with values in excess of 20 C extending as far northward as southern Illinois and values in the teens as far northward as the Great Lakes. This zone of relatively uniform temperature to the southeast of the surface low is referred to as the warm sector of a cyclone. The blue windshift line marks the leading edge of the advancing colder air from the west, and is referred to as the cold front. To the east of the front, the temperatures are relatively homogeneous, while proceeding westward from the front, temperatures drop by 10 C or more within the first few hundred kilometers. 15
28 In the southerly flow off the Gulf of Mexico to the east of the blue windshift line, temperatures are relatively uniform, with values in excess of 20 C extending as far northward as southern Illinois and values in the teens as far northward as the Great Lakes. This zone of relatively uniform temperature to the southeast of the surface low is referred to as the warm sector of a cyclone. The blue windshift line marks the leading edge of the advancing colder air from the west, and is referred to as the cold front. To the east of the front, the temperatures are relatively homogeneous, while proceeding westward from the front, temperatures drop by 10 C or more within the first few hundred kilometers. Hence, a cold front can be defined as the warm air boundary of a frontal zone (or baroclinic zone) that is advancing in the direction of the warmer air. 15

29 Sea-level pressure (contours) and surface air temperature (color shading) at 6-hour intervals. The contour interval for sea-level pressure is 4 hpa. 16

30 Sea-level pressure and surface air temperature 00 UTC, 10 November,

31 Sea-level pressure and surface air temperature 06 UTC, 10 November,

32 Sea-level pressure and surface air temperature 12 UTC, 10 November,
33 Sea-level pressure and surface air temperature 18 UTC, 10 November,
34 The surface isotherms are packed together more tightly than the hpa thickness contours shown earlier, particularly to the south and west of the surface low. 21
35 The surface isotherms are packed together more tightly than the hpa thickness contours shown earlier, particularly to the south and west of the surface low. Such bands of strong temperature gradients, referred to as baroclinic zones or frontal zones, are created and maintained by deformation patterns in the surface wind field, and sharpened by low level convergence along the windshift line. 21
36 The surface isotherms are packed together more tightly than the hpa thickness contours shown earlier, particularly to the south and west of the surface low. Such bands of strong temperature gradients, referred to as baroclinic zones or frontal zones, are created and maintained by deformation patterns in the surface wind field, and sharpened by low level convergence along the windshift line. The strongest horizontal temperature gradients at the earth s surface tend to be displaced towards the warmer air relative to their counterparts in the thickness field. 21
37 The surface isotherms are packed together more tightly than the hpa thickness contours shown earlier, particularly to the south and west of the surface low. Such bands of strong temperature gradients, referred to as baroclinic zones or frontal zones, are created and maintained by deformation patterns in the surface wind field, and sharpened by low level convergence along the windshift line. The strongest horizontal temperature gradients at the earth s surface tend to be displaced towards the warmer air relative to their counterparts in the thickness field. In the final chart of the sequence the frontal zone has a tendency to wrap around the surface low. 21
38 The surface isotherms are packed together more tightly than the hpa thickness contours shown earlier, particularly to the south and west of the surface low. Such bands of strong temperature gradients, referred to as baroclinic zones or frontal zones, are created and maintained by deformation patterns in the surface wind field, and sharpened by low level convergence along the windshift line. The strongest horizontal temperature gradients at the earth s surface tend to be displaced towards the warmer air relative to their counterparts in the thickness field. In the final chart of the sequence the frontal zone has a tendency to wrap around the surface low. The temperature gradients in the vicinity of the surface low begin to weaken as the region of strong thermal contrast moves eastward, leaving the surface low behind, detached from the warm air mass. 21
39 The transition from a highly baroclinic structure, with strong temperature contrasts in the vicinity of the surface low, to a more barotropic structure, marks the end of the intensification phase in the life cycle of the cyclone. 22
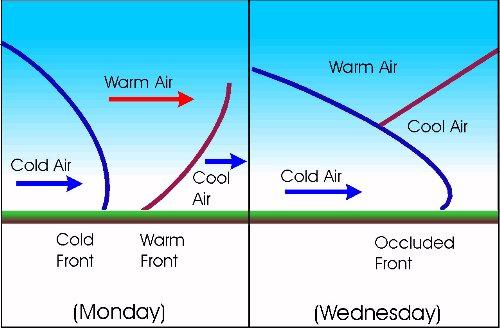
40 The transition from a highly baroclinic structure, with strong temperature contrasts in the vicinity of the surface low, to a more barotropic structure, marks the end of the intensification phase in the life cycle of the cyclone. The most pronounced frontal zone in the charts is the one along and slightly to the west of the windshift line to the south of the developing cyclone. 22
41 The transition from a highly baroclinic structure, with strong temperature contrasts in the vicinity of the surface low, to a more barotropic structure, marks the end of the intensification phase in the life cycle of the cyclone. The most pronounced frontal zone in the charts is the one along and slightly to the west of the windshift line to the south of the developing cyclone. Within this zone, colder air that has been advected southward in the northerly flow on the west side of the cyclone is advancing eastward, replacing warmer, more humid air flowing northward from the Gulf of Mexico. 22
42 The transition from a highly baroclinic structure, with strong temperature contrasts in the vicinity of the surface low, to a more barotropic structure, marks the end of the intensification phase in the life cycle of the cyclone. The most pronounced frontal zone in the charts is the one along and slightly to the west of the windshift line to the south of the developing cyclone. Within this zone, colder air that has been advected southward in the northerly flow on the west side of the cyclone is advancing eastward, replacing warmer, more humid air flowing northward from the Gulf of Mexico. The leading edge of this cold frontal zone the cold front corresponds closely to the windshift line. 22

43 Sea-level pressure and surface air temperature 18 UTC, 10 November,
44 The passage of a cold front at a station marks the beginning of a period of falling temperatures, heralded by a windshift. 24
45 The passage of a cold front at a station marks the beginning of a period of falling temperatures, heralded by a windshift. The more subtle, red windshift line also marks the warm air boundary of a baroclinic zone, but in this case the baroclinic zone is advancing northward, displacing the colder air, and is hence referred to as a warm front. 24
46 The passage of a cold front at a station marks the beginning of a period of falling temperatures, heralded by a windshift. The more subtle, red windshift line also marks the warm air boundary of a baroclinic zone, but in this case the baroclinic zone is advancing northward, displacing the colder air, and is hence referred to as a warm front. The passage of a warm front marks the end of an interval or rising temperatures. 24
47 The passage of a cold front at a station marks the beginning of a period of falling temperatures, heralded by a windshift. The more subtle, red windshift line also marks the warm air boundary of a baroclinic zone, but in this case the baroclinic zone is advancing northward, displacing the colder air, and is hence referred to as a warm front. The passage of a warm front marks the end of an interval or rising temperatures. Fronts that exhibit little movement in either direction (stationary fronts) are indicated on synoptic charts as dashed lines with alternating red and blue line segments. 24

48 Schematic diagram of a frontal depression. 25
49 26
50 In the early stages of cyclone development, the cold and warm fronts mark the warm air boundary of a continuous baroclinic zone. 27
51 In the early stages of cyclone development, the cold and warm fronts mark the warm air boundary of a continuous baroclinic zone. The cyclone develops at the junction of the cold and warm fronts, along the warm air boundary of the frontal zone. 27
52 In the early stages of cyclone development, the cold and warm fronts mark the warm air boundary of a continuous baroclinic zone. The cyclone develops at the junction of the cold and warm fronts, along the warm air boundary of the frontal zone. As the cyclone develops, it moves away from the warm air boundary of the frontal zone, in the direction of the colder air. 27
53 In the early stages of cyclone development, the cold and warm fronts mark the warm air boundary of a continuous baroclinic zone. The cyclone develops at the junction of the cold and warm fronts, along the warm air boundary of the frontal zone. As the cyclone develops, it moves away from the warm air boundary of the frontal zone, in the direction of the colder air. As this transition occurs, air from within the frontal zone is swept around the cyclone forming an occluded front that is different in structure from the warm and cold fronts. 27
54 In the early stages of cyclone development, the cold and warm fronts mark the warm air boundary of a continuous baroclinic zone. The cyclone develops at the junction of the cold and warm fronts, along the warm air boundary of the frontal zone. As the cyclone develops, it moves away from the warm air boundary of the frontal zone, in the direction of the colder air. As this transition occurs, air from within the frontal zone is swept around the cyclone forming an occluded front that is different in structure from the warm and cold fronts. As the occluded front approaches a station, surface air temperature rises, and after the front passes the station, the temperature drops. 27
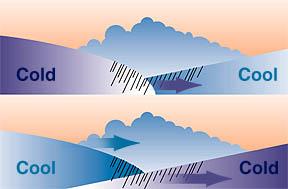
55 Occlusions: Schematic Diagram 28
56 From the standpoint of a stationary observer, an occlusion may appear like the passage of a warm front or of a cold front. 29
57 From the standpoint of a stationary observer, an occlusion may appear like the passage of a warm front or of a cold front. The temperature changes are usually more subtle. The observer doesn t experience temperatures as high as those in the warm sector. 29
58 From the standpoint of a stationary observer, an occlusion may appear like the passage of a warm front or of a cold front. The temperature changes are usually more subtle. The observer doesn t experience temperatures as high as those in the warm sector. Fronts on surface maps are expressions of frontal surfaces that extend upwards to a height of several kilometers, sloping backward toward the colder air. 29
59 From the standpoint of a stationary observer, an occlusion may appear like the passage of a warm front or of a cold front. The temperature changes are usually more subtle. The observer doesn t experience temperatures as high as those in the warm sector. Fronts on surface maps are expressions of frontal surfaces that extend upwards to a height of several kilometers, sloping backward toward the colder air. To a good approximation, fronts behave as material surfaces in the atmosphere. 29
60 From the standpoint of a stationary observer, an occlusion may appear like the passage of a warm front or of a cold front. The temperature changes are usually more subtle. The observer doesn t experience temperatures as high as those in the warm sector. Fronts on surface maps are expressions of frontal surfaces that extend upwards to a height of several kilometers, sloping backward toward the colder air. To a good approximation, fronts behave as material surfaces in the atmosphere. That is, if one were to tag parcels of air that lie along frontal surfaces at some point in time and follow them as they moved along their respective three-dimensional trajectories through space, these same parcels would continue to define the frontal surface for quite a long time. 29
61 Thus it is almost correct to say that air does not move through fronts: it moves with them. Regardless of whether the warm air is advancing or retreating, it is possible for the warmer air to be lifted up and over the frontal surface. 30
62 Thus it is almost correct to say that air does not move through fronts: it moves with them. Regardless of whether the warm air is advancing or retreating, it is possible for the warmer air to be lifted up and over the frontal surface. In the case of a stationary front, warm air may be advancing aloft while the frontal zone air trapped beneath the frontal surface remains stationary. 30
63 Thus it is almost correct to say that air does not move through fronts: it moves with them. Regardless of whether the warm air is advancing or retreating, it is possible for the warmer air to be lifted up and over the frontal surface. In the case of a stationary front, warm air may be advancing aloft while the frontal zone air trapped beneath the frontal surface remains stationary. In the case of a cold front the wind component normal to the front may be in the opposite direction below and above the frontal surface. 30
64 It should be noted that other factors, such as time of day, sky cover, altitude of the station, and proximity to large bodies of water can strongly affect the temperature. 31
65 It should be noted that other factors, such as time of day, sky cover, altitude of the station, and proximity to large bodies of water can strongly affect the temperature. In fact, it is often difficult to locate fronts on the basis of gradients of surface air temperature alone. 31
66 It should be noted that other factors, such as time of day, sky cover, altitude of the station, and proximity to large bodies of water can strongly affect the temperature. In fact, it is often difficult to locate fronts on the basis of gradients of surface air temperature alone. Over the oceans, surface air temperature rarely departs from the surface temperature of the underlying water by more than 1-2 C. 31
67 It should be noted that other factors, such as time of day, sky cover, altitude of the station, and proximity to large bodies of water can strongly affect the temperature. In fact, it is often difficult to locate fronts on the basis of gradients of surface air temperature alone. Over the oceans, surface air temperature rarely departs from the surface temperature of the underlying water by more than 1-2 C. In mountainous terrain, large differences in station elevation mask the temperature gradients. 31
68 It should be noted that other factors, such as time of day, sky cover, altitude of the station, and proximity to large bodies of water can strongly affect the temperature. In fact, it is often difficult to locate fronts on the basis of gradients of surface air temperature alone. Over the oceans, surface air temperature rarely departs from the surface temperature of the underlying water by more than 1-2 C. In mountainous terrain, large differences in station elevation mask the temperature gradients. Unresolved features such as terrain effects, patchy nocturnal inversions, convective storms and urban heat island effects can raise or lower the temperature at a given station by several degrees. 31
69 It should be noted that other factors, such as time of day, sky cover, altitude of the station, and proximity to large bodies of water can strongly affect the temperature. In fact, it is often difficult to locate fronts on the basis of gradients of surface air temperature alone. Over the oceans, surface air temperature rarely departs from the surface temperature of the underlying water by more than 1-2 C. In mountainous terrain, large differences in station elevation mask the temperature gradients. Unresolved features such as terrain effects, patchy nocturnal inversions, convective storms and urban heat island effects can raise or lower the temperature at a given station by several degrees. Apparent temperature discontinuities associated with these features are sometimes misinterpreted as fronts. 31
70 Dew Point as Frontal Indicator Frontal zones tend to be marked by strong gradients in dew point, especially when the cold air is of continental origin and the warmer air is of maritime origin, as is often the case over Ireland. 32
71 Dew Point as Frontal Indicator Frontal zones tend to be marked by strong gradients in dew point, especially when the cold air is of continental origin and the warmer air is of maritime origin, as is often the case over Ireland. In many synoptic situations, the dew-point gradient is a more reliable indicator of frontal positions than the temperature gradient. Dew-point is sometimes used as an indicator of fronts, because it has much smaller diurnal variations. 32
72 Dew Point as Frontal Indicator Frontal zones tend to be marked by strong gradients in dew point, especially when the cold air is of continental origin and the warmer air is of maritime origin, as is often the case over Ireland. In many synoptic situations, the dew-point gradient is a more reliable indicator of frontal positions than the temperature gradient. Dew-point is sometimes used as an indicator of fronts, because it has much smaller diurnal variations. For example, during summer over land, the diurnal temperature range at the ground tends to be larger in cool, dry continental air masses than in warm, humid air coming in from the Atlantic Ocean. 32
73 Dew Point as Frontal Indicator Frontal zones tend to be marked by strong gradients in dew point, especially when the cold air is of continental origin and the warmer air is of maritime origin, as is often the case over Ireland. In many synoptic situations, the dew-point gradient is a more reliable indicator of frontal positions than the temperature gradient. Dew-point is sometimes used as an indicator of fronts, because it has much smaller diurnal variations. For example, during summer over land, the diurnal temperature range at the ground tends to be larger in cool, dry continental air masses than in warm, humid air coming in from the Atlantic Ocean. Thus, during afternoon it is not uncommon for surface temperatures well behind the cold front to be as high as those on the warm sector of the cyclone, even though there is considerable thermal contrast one or two km above ground. 32
Vertical structure. To conclude, we will review the critical factors invloved in the development of extratropical storms.
 Vertical structure Now we will examine the vertical structure of the intense baroclinic wave using three visualization tools: Upper level charts at selected pressure levels Vertical soundings for selected
Observation Homework Due 11/24. Previous Lecture. Midlatitude Cyclones
 Lecture 21 Midlatitude Cyclones Observation Homework Due 11/24 1 2 Midlatitude Cyclones Midlatitude Cyclone or Winter Storm Cyclogenesis Energy Source Life Cycle Air Streams Vertical Structure Storm Hazards
MET 3502 Synoptic Meteorology. Lecture 8: September 16, AIRMASSES, FRONTS and FRONTAL ANALYSIS (2)
") MET 3502 Synoptic Meteorology Lecture 8: September 16, 2010 AIRMASSES, FRONTS and FRONTAL ANALYSIS (2) Identifying a cold front on a surface weather map: 1. Surface front is located at the leading edge
MET 3502 Synoptic Meteorology Lecture 8: September 16, 2010 AIRMASSES, FRONTS and FRONTAL ANALYSIS (2) Identifying a cold front on a surface weather map: 1. Surface front is located at the leading edge
Chapter 12 Fronts & Air Masses
 Chapter overview: Anticyclones or highs Air Masses o Classification o Source regions o Air masses of North America Fronts o Stationary fronts o Cold fronts o Warm fronts o Fronts and the jet stream o Frontogenesis
Synoptic Meteorology
 M.Sc. in Meteorology Synoptic Meteorology [MAPH P312] Prof Peter Lynch Second Semester, 2004 2005 Seminar Room Dept. of Maths. Physics, UCD, Belfield. Part 9 Extratropical Weather Systems These lectures
and 24 mm, hPa lapse rates between 3 and 4 K km 1, lifted index values
 3.2 Composite analysis 3.2.1 Pure gradient composites The composite initial NE report in the pure gradient northwest composite (N = 32) occurs where the mean sea level pressure (MSLP) gradient is strongest
Mid-Latitude Cyclones and Fronts. Lecture 12 AOS 101
 Mid-Latitude Cyclones and Fronts Lecture 12 AOS 101 Homework 4 COLDEST TEMPS GEOSTROPHIC BALANCE Homework 4 FASTEST WINDS L Consider an air parcel rising through the atmosphere The parcel expands as it
4/29/2011. Mid-latitude cyclones form along a
 Chapter 10: Cyclones: East of the Rocky Mountain Extratropical Cyclones Environment prior to the development of the Cyclone Initial Development of the Extratropical Cyclone Early Weather Along the Fronts
Air Masses of North America cp and ca air masses Air mass characterized by very cold and dry conditions
 Chapter 8: Air Masses, Fronts, and Middle-Latitude Cyclones Air masses Fronts Middle-latitude cyclones Air Masses Air mass an extremely large body of air whose properties of temperature and humidity are
Synoptic Meteorology II: Frontogenesis Examples Figure 1
 Synoptic Meteorology II: Frontogenesis Examples The below images, taken from the 1200 UTC 17 January 2019 GFS forecast run, provide examples of the contributions of deformation and divergence to frontogenesis.
Name SOLUTIONS T.A./Section Atmospheric Science 101 Homework #6 Due Thursday, May 30 th (in class)
") Name SOLUTIONS T.A./Section Atmospheric Science 101 Homework #6 Due Thursday, May 30 th (in class) 1. General Circulation Briefly describe where each of the following features is found in the earth s general
Name SOLUTIONS T.A./Section Atmospheric Science 101 Homework #6 Due Thursday, May 30 th (in class) 1. General Circulation Briefly describe where each of the following features is found in the earth s general
True or false: The atmosphere is always in hydrostatic balance. A. True B. False
 Clicker Questions and Clicker Quizzes Clicker Questions Chapter 7 Of the four forces that affect the motion of air in our atmosphere, which is to thank for opposing the vertical pressure gradient force
Lecture #14 March 29, 2010, Monday. Air Masses & Fronts
 Lecture #14 March 29, 2010, Monday Air Masses & Fronts General definitions air masses source regions fronts Air masses formation types Fronts formation types Air Masses General Definitions a large body
AIR MASSES. Large bodies of air. SOURCE REGIONS areas where air masses originate
 Large bodies of air AIR MASSES SOURCE REGIONS areas where air masses originate Uniform in composition Light surface winds Dominated by high surface pressure The longer the air mass remains over a region,
air masses and Fronts 2013.notebook January 29, 2013
 1/4/12 Notes 1 Weather Data Log.docx 2 Air Masses Uniform bodies of air An air mass is a large body of air that has similar temperature and moisture throughout. How to name an air mass: first write the
Weather report 28 November 2017 Campinas/SP
 Weather report 28 November 2017 Campinas/SP Summary: 1) Synoptic analysis and pre-convective environment 2) Verification 1) Synoptic analysis and pre-convective environment: At 1200 UTC 28 November 2017
Chapter 1 Anatomy of a Cyclone
 Chapter 1 Anatomy of a Cyclone The Beast in the East 15-17 February 2003 Extra-tropical cyclone an area of low pressure outside of the tropics Other names for extra-tropical cyclones: Cyclone Mid-latitude
Refer to Figure 1 and what you have learned so far in this course when responding to the following:
 Refer to Figure 1 and what you have learned so far in this course when responding to the following: 1.Looking down on a Northern Hemisphere extratropical cyclone, surface winds blow [(clockwise and outward)(counterclockwise
Weather Related Factors of the Adelaide floods ; 7 th to 8 th November 2005
 Weather Related Factors of the Adelaide floods ; th to th November 2005 Extended Abstract Andrew Watson Regional Director Bureau of Meteorology, South Australian Region 1. Antecedent Weather 1.1 Rainfall
Air Masses, Fronts, Storm Systems, and the Jet Stream
 Air Masses, Fronts, Storm Systems, and the Jet Stream Air Masses When a large bubble of air remains over a specific area of Earth long enough to take on the temperature and humidity characteristics of
Middle Latitude Cyclones a storm that forms at middle and high latitudes, outside of the tropics.
 Middle Latitude Cyclones a storm that forms at middle and high latitudes, outside of the tropics. Polar Front Theory a theory that explains the life cycle of mid latitude cyclones and their associated
Chapter 9. Weather Patterns & Midlatitude Cyclones
 Chapter 9 Weather Patterns & Midlatitude Cyclones Frontal Weather Fronts are boundary surfaces between different air masses. Warm front Cold front Stationary front Occluded front Drylines Frontal Weather
Air Masses and Fronts II
 Air Masses and Fronts II Brief review An air mass is a large body of air whose properties of temperature and humidity are fairly similar in any horizontal direction Source regions for air masses tend to
Chapter 9: Weather Patterns
 Chapter 9: Weather Patterns Mid Latitude Cyclones: extratropical cyclones, Nor easters Region southern FL to Alaska Lifecycle and associated weather Regional Influence Polar Front Theory: -Norwegian Cyclone
** warm air mass
 Frontal cyclones -otherwise known as mid-latitude or wave cyclones. A cyclone is a cyclonically rotating system which, in mid- and high-latitudes is normally associated with the boundary between air masses
Synoptic Meteorology II: Petterssen-Sutcliffe Development Theory Application March 2015
 Synoptic Meteorology II: Petterssen-Sutcliffe Development Theory Application 10-12 March 2015 In our lecture on Petterssen-Sutcliffe Development Theory, we outlined the principle of selfdevelopment in
A Cyclogenesis south of the Alps. Manfred Kurz Neustadt/Weinstraße
 A Cyclogenesis south of the Alps Manfred Kurz Neustadt/Weinstraße A cyclogenesis south of the Alps Surface maps 06-11-99, 00 UTC The occluded frontal system of a quasi-stationary low above the North Sea
Synoptic Meteorology II: Self-Development in the IPV Framework. 5-7 May 2015
 Synoptic Meteorology II: Self-Development in the IPV Framework 5-7 May 2015 Readings: Section 5.3.6 of Midlatitude Synoptic Meteorology. Introduction In this and other recent lectures, we have developed
Chapter 10: Mid-latitude Cyclones Mid-Latitude Cyclones
 Chapter 10: Mid-latitude Cyclones Mid-Latitude Cyclones Mid-latitude cyclones form along a boundary separating polar air from warmer air to the south. Life Cycle of Cyclone Cyclone Structures Steering
Chapter 10: Mid-latitude Cyclones
 Chapter 10: Mid-latitude Cyclones Life Cycle of Cyclone Cyclone Structures Steering of Cyclone Mid-Latitude Cyclones Mid-latitude cyclones form along a boundary separating polar air from warmer air to
Foundations of Earth Science, 6e Lutgens, Tarbuck, & Tasa
 Foundations of Earth Science, 6e Lutgens, Tarbuck, & Tasa Weather Patterns and Severe Weather Foundations, 6e - Chapter 14 Stan Hatfield Southwestern Illinois College Air masses Characteristics Large body
 http://www.ssec.wisc.edu/data/composites.html Red curve: Incoming solar radiation Blue curve: Outgoing infrared radiation. Three-cell model of general circulation Mid-latitudes: 30 to 60 latitude MID-LATITUDES
Science 1206 SAMPLE Test ( Weather Dynamics)
") Science 1206 SAMPLE Test ( Weather Dynamics) Name:. Part A: Multiple Choice (60%) Shade the letter of the best answer on the Scantron sheet provided. 1. Which term refers to the current atmospheric conditions?
Science 1206 SAMPLE Test ( Weather Dynamics) Name:. Part A: Multiple Choice (60%) Shade the letter of the best answer on the Scantron sheet provided. 1. Which term refers to the current atmospheric conditions?
1. Which weather map symbol is associated with extremely low air pressure? A) B) C) D) 2. The diagram below represents a weather instrument.
 B) C) D) 2. The diagram below represents a weather instrument.") 1. Which weather map symbol is associated with extremely low air pressure? 2. The diagram below represents a weather instrument. Which weather variable was this instrument designed to measure? A) air pressure
1. Which weather map symbol is associated with extremely low air pressure? 2. The diagram below represents a weather instrument. Which weather variable was this instrument designed to measure? A) air pressure
10B.2 THE ROLE OF THE OCCLUSION PROCESS IN THE EXTRATROPICAL-TO-TROPICAL TRANSITION OF ATLANTIC HURRICANE KAREN
 10B.2 THE ROLE OF THE OCCLUSION PROCESS IN THE EXTRATROPICAL-TO-TROPICAL TRANSITION OF ATLANTIC HURRICANE KAREN Andrew L. Hulme* and Jonathan E. Martin University of Wisconsin-Madison, Madison, Wisconsin
MET Lecture 18 Cold Waves (CH14)
") MET 4300 Lecture 18 Cold Waves (CH14) Cold Waves, or Polar Outbreaks Influx of unusually cold air into middle and lower latitudes Generally cover larger areas than blizzards or ice storms On average claim
MET 4300 Lecture 18 Cold Waves (CH14) Cold Waves, or Polar Outbreaks Influx of unusually cold air into middle and lower latitudes Generally cover larger areas than blizzards or ice storms On average claim
SEVERE WEATHER AND FRONTS TAKE HOME QUIZ
 1. Most of the hurricanes that affect the east coast of the United States originally form over the A) warm waters of the Atlantic Ocean in summer B) warm land of the southeastern United States in summer
Summary of November Central U.S. Winter Storm By Christopher Hedge
 Summary of November 12-13 2010 Central U.S. Winter Storm By Christopher Hedge Event Overview The first significant snowfall of the 2010-2011 season affected portions of the plains and upper Mississippi
Type of storm viewed by Spotter A Ordinary, multi-cell thunderstorm. Type of storm viewed by Spotter B Supecell thunderstorm
 ANSWER KEY Part I: Locating Geographical Features 1. The National Weather Service s Storm Prediction Center (www.spc.noaa.gov) has issued a tornado watch on a warm spring day. The watch covers a large
Wind: Global Systems Chapter 10
 Wind: Global Systems Chapter 10 General Circulation of the Atmosphere General circulation of the atmosphere describes average wind patterns and is useful for understanding climate Over the earth, incoming
ATSC 2000 Final Fall 2005
 ATSC 2000 Final Fall 2005 true/false /25 multiple choice /25 short answer /23 essay /10 total /83 or % True/False Indicate whether the sentence or statement is true or false. (25 questions 1% each) 1.
Chapter 12: Meteorology
 Chapter 12: Meteorology Section 1: The Causes of Weather 1. Compare and contrast weather and climate. 2. Analyze how imbalances in the heating of Earth s surface create weather. 3. Describe how and where
Page 1. Name: 4) State the actual air pressure, in millibars, shown at Miami, Florida on the given weather map.
 State the actual air pressure, in millibars, shown at Miami, Florida on the given weather map.") Name: Questions 1 and 2 refer to the following: A partial station model and meteorological conditions table, as reported by the weather bureau in the city of Oswego, New York, are shown below. 1) Using
Name: Questions 1 and 2 refer to the following: A partial station model and meteorological conditions table, as reported by the weather bureau in the city of Oswego, New York, are shown below. 1) Using
Science 1206 Chapter 1 - Inquiring about Weather
 Science 1206 Chapter 1 - Inquiring about Weather 1.1 - The Atmosphere: Energy Transfer and Properties (pp. 10-25) Weather and the Atmosphere weather the physical conditions of the atmosphere at a specific
Lecture Outlines PowerPoint. Chapter 19 Earth Science 11e Tarbuck/Lutgens
 Lecture Outlines PowerPoint Chapter 19 Earth Science 11e Tarbuck/Lutgens 2006 Pearson Prentice Hall This work is protected by United States copyright laws and is provided solely for the use of instructors
Earth Science, 11e. Weather Patterns and Severe Storms Chapter 19. Air masses. A cold Canadian air mass Figure Air masses. Air masses 9/5/2012
 2006 Pearson Prentice Hall Lecture Outlines PowerPoint Chapter 19 Earth Science 11e Tarbuck/Lutgens This work is protected by United States copyright laws and is provided solely for the use of instructors
AIR MASSES SOURCE REGION CHARACTERISTICS Continental Arctic (ca) Greenland, Antarctica, Highest latitudes of Asia and North America
 Greenland, Antarctica, Highest latitudes of Asia and North America") GEOGRAPHY CLIMATOLOGY AIRMASS, FRONT AND TEMPERATE CYCLONE AIRMASS A large body of air having little horizontal variation in temperature and moisture is called an airmass. Airmass acquires its properties
GEOGRAPHY CLIMATOLOGY AIRMASS, FRONT AND TEMPERATE CYCLONE AIRMASS A large body of air having little horizontal variation in temperature and moisture is called an airmass. Airmass acquires its properties
Divergence, Spin, and Tilt. Convergence and Divergence. Midlatitude Cyclones. Large-Scale Setting
 Midlatitude Cyclones Equator-to-pole temperature gradient tilts pressure surfaces and produces westerly jets in midlatitudes Waves in the jet induce divergence and convergence aloft, leading to surface
The dynamics of high and low pressure systems
 The dynamics of high and low pressure systems Newton s second law for a parcel of air in an inertial coordinate system (a coordinate system in which the coordinate axes do not change direction and are
CASE STUDY OF THE NOVEMBER WINDSTORM IN SOUTH CENTRAL COLORADO
 32 CASE STUDY OF THE 12-13 NOVEMBER WINDSTORM IN SOUTH CENTRAL COLORADO Paul Wolyn * NOAA/NWS Pueblo, CO 1. INTRODUCTION During the evening and early morning of 12-13 November 2011, a damaging downslope
Fig Major air masses of the world
 Fig. 9.3 Major air masses of the world CLASSIFICATION FOUR BASIC CATEGORIES OF AIR MASSES: POLAR - P ARCTIC - A TROPICAL - T EQUATORIAL - E TWO DESIGNATIONS OF SURFACE IN SOURCE REGION MARITIME - m. CONTINENTAL
Page 1. Name:
 Name: 1) As the difference between the dewpoint temperature and the air temperature decreases, the probability of precipitation increases remains the same decreases 2) Which statement best explains why
Mid-latitude Cyclones & Air Masses
 Lab 9 Mid-latitude Cyclones & Air Masses This lab will introduce students to the patterns of surface winds around the center of a midlatitude cyclone of low pressure. The types of weather associated with
ANSWER KEY. Part I: Synoptic Scale Composite Map. Lab 12 Answer Key. Explorations in Meteorology 54
 ANSWER KEY Part I: Synoptic Scale Composite Map 1. Using Figure 2, locate and highlight, with a black dashed line, the 500-mb trough axis. Also, locate and highlight, with a black zigzag line, the 500-mb
Lecture 14. Extratropical Cyclones extratropical cyclone
 Lecture 14. Extratropical Cyclones In mid-latitudes, much of our weather is associated with a particular kind of storm, the extratropical cyclone Cyclone: circulation around low pressure center Some midwesterners
Lower-Tropospheric Height Tendencies Associated with the Shearwise and Transverse Components of Quasigeostrophic Vertical Motion
 JULY 2007 N O T E S A N D C O R R E S P O N D E N C E 2803 Lower-Tropospheric Height Tendencies Associated with the Shearwise and Transverse Components of Quasigeostrophic Vertical Motion JONATHAN E. MARTIN
Transient and Eddy. Transient/Eddy Flux. Flux Components. Lecture 3: Weather/Disturbance. Transient: deviations from time mean Time Mean
 Lecture 3: Weather/Disturbance Transients and Eddies Climate Roles Mid-Latitude Cyclones Tropical Hurricanes Mid-Ocean Eddies Transient and Eddy Transient: deviations from time mean Time Mean Eddy: deviations
Global Winds AOSC 200 Tim Canty
 Global Winds AOSC 200 Tim Canty Class Web Site: http://www.atmos.umd.edu/~tcanty/aosc200 Topics for today: Air Masses Fronts Lecture 18 Oct 31 2017 1 Air Masses What is an air mass? Large body of air whose
METEOROLOGY. 1 The average height of the tropopause at 50 N is about A 14 km B 16 km C 11 km D 8 km
 1 The average height of the tropopause at 50 N is about A 14 km B 16 km C 11 km D 8 km 2 In the lower part of the stratosphere the temperature A is almost constant B decreases with altitude C increases
Summary of High Wind Event of 7 March 2004
 Summary of High Wind Event of 7 March 2004 This event was characterized by a very strong jet streak that developed over North Carolina by 00 UTC 8 March, as seen in the Eta model analysis at 300 mb, with
AOSC 200 Tim Canty. Class Web Site: Topics for today: Air Masses. Fronts. Lecture 19 Apr
 Air Masses AOSC 200 Tim Canty Class Web Site: http://www.atmos.umd.edu/~tcanty/aosc200 Topics for today: Air Masses Fronts Lecture 19 Apr 11 2019 1 Today s Weather Map http://www.wpc.ncep.noaa.gov/#page=sfc
Impacts of the April 2013 Mean trough over central North America
 Impacts of the April 2013 Mean trough over central North America By Richard H. Grumm National Weather Service State College, PA Abstract: The mean 500 hpa flow over North America featured a trough over
Air Masses and Fronts. Ahrens Chapter 12
 Air Masses and Fronts Ahrens Chapter 12 Air Mass Properties Air masses take on the properties of the underlying surface Air masses are classified according to their location of origin Geographical Characteristics
Quiz 2 Review Questions
 Quiz 2 Review Questions Chapter 7 Lectures: Winds and Global Winds and Global Winds cont 1) What is the thermal circulation (thermal wind) and how does it form? When we have this type of circulation, how
Air Masses, Weather Systems and Hurricanes
 The Earth System - Atmosphere IV Air Masses, Weather Systems and Hurricanes Air mass a body of air which takes on physical characteristics which distinguish it from other air. Classified on the basis of
Meteorology Lecture 15
 Meteorology Lecture 15 Robert Fovell rfovell@albany.edu 1 Important notes These slides show some figures and videos prepared by Robert G. Fovell (RGF) for his Meteorology course, published by The Great
Thermal / Solar. When air is warmed it... Rises. Solar Energy. Evaporation. Condensation Forms Clouds
 Thermal / Solar Light from the Sun is transformed into what type of energy when it hits Earth's surface? Rises When air is warmed it... Solar Energy Water moves through the water cycle using what type
Anthony A. Rockwood Robert A. Maddox
 Anthony A. Rockwood Robert A. Maddox An unusually intense MCS produced large hail and wind damage in northeast Kansas and northern Missouri during the predawn hours of June 7 th, 1982. Takes a look at
A case study of a heat low over central Australia
 A case study of a heat low over central Australia Martin Preissler Meteorological Institute, University of Munich, Germany Michael J. Reeder 1 School of Mathematical Sciences, Monash University, Australia
Polar Front Theory. Cyclogenesis. Day 1. Days 2-5. What Happens Aloft. Up Above
 Cyclogenesis Tor Bergeron lecturing Mid latitude cyclones are born on the Polar Front as a developing wave Theory of cyclogenesis (formation of cyclones) first developed by the Norwegian meteorologists
3. As warm, moist air moves into a region, barometric pressure readings in the region will generally 1. decrease 2. increase 3.
 Teacher: Mr. Prizzi Castle Learning Review 1 1. Which process most directly results in cloud formation? 1. condensation 3. precipitation 2. transpiration 4. radiation 2. An air mass originating over north
Isolated severe weather and cold air damming 9 November 2005 By Richard H. Grumm National Weather Service Office State College, PA 16801
 Isolated severe weather and cold air damming 9 November 2005 By Richard H. Grumm National Weather Service Office State College, PA 16801 1. INTRODUCTION Two lines of convection moved over the State of
Weather, Air Masses, Fronts and Global Wind Patterns. Meteorology
 Weather, Air Masses, Fronts and Global Wind Patterns Meteorology Weather is what conditions of the atmosphere are over a short period of time. Climate is how the atmosphere "behaves" over long periods
What a Hurricane Needs to Develop
 Weather Weather is the current atmospheric conditions, such as air temperature, wind speed, wind direction, cloud cover, precipitation, relative humidity, air pressure, etc. 8.10B: global patterns of atmospheric
Chapter 5. Summary and Conclusions
 Chapter 5. Summary and Conclusions Two cases of heavy rainfall were analyzed using observational data sets and model simulations. The first case was the landfall of Hurricane Floyd in North Carolina in
ENSO, AO, and climate in Japan. 15 November 2016 Yoshinori Oikawa, Tokyo Climate Center, Japan Meteorological Agency
 ENSO, AO, and climate in Japan 15 November 2016 Yoshinori Oikawa, Tokyo Climate Center, Japan Meteorological Agency Aims of this lecture At the end of the yesterday s lecture, Hare-run said, - In the exercise
THE INFLUENCE OF THE GREAT LAKES ON NORTHWEST SNOWFALL IN THE SOUTHERN APPALACHIANS
 P2.18 THE INFLUENCE OF THE GREAT LAKES ON NORTHWEST SNOWFALL IN THE SOUTHERN APPALACHIANS Robbie Munroe* and Doug K. Miller University of North Carolina at Asheville, Asheville, North Carolina B. Holloway
Name: Regents Earth Science. Weather and Climate - Review Questions
 Name: Regents Earth Science Weather and Climate - Review Questions Date: Thayer - 279 1. People sometimes release substances into the atmosphere to increase the probability of rain by A) raising the air
Vertical Structure of Atmosphere
 ATMOS 3110 Introduction to Atmospheric Sciences Distribution of atmospheric mass and gaseous constituents Because of the earth s gravitational field, the atmosphere exerts a downward forces on the earth
Meteorology 311. General Circulation/Fronts Fall 2017
 Meteorology 311 General Circulation/Fronts Fall 2017 Precipitation Types Rain Snow growth of ice crystals through deposition, accretion, and aggregation. Freezing Rain Rain freezes when it hits the surface.
25.1 Air Masses. Section 25.1 Objectives
 Section 25.1 Objectives Explain how an air mass forms. List the four main types of air masses. Describe how air masses affect the weather of North America. Air Masses 25.1 Air Masses Differences in air
Weather Systems. Section
 Section 1 12.2 Objectives Compare and contrast the three major wind systems. Identify four types of fronts. Distinguish between highand low-pressure systems. Review Vocabulary convection: the transfer
Examples of Pressure Gradient. Pressure Gradient Force. Chapter 7: Forces and Force Balances. Forces that Affect Atmospheric Motion 2/2/2015
 Chapter 7: Forces and Force Balances Forces that Affect Atmospheric Motion Fundamental force - Apparent force - Pressure gradient force Gravitational force Frictional force Centrifugal force Forces that
Quasi-Geostrophic Implications
 Chapter 10 Quasi-Geostrophic Implications When you look at a weather chart with all its isolines and plotted data, you need a framework upon which to interpret what you see. Quasi-geostrophic theory provides
THE MAP ROOM. BAND ON THE RUN Chasing the Physical Processes Associated with Heavy Snowfall
 THE MAP ROOM BAND ON THE RUN Chasing the Physical Processes Associated with Heavy Snowfall BY CHARLES E. GRAVES, JAMES T. MOORE, MARC J. SINGER, AND SAM NG AFFILIATIONS: GRAVES, MOORE, AND NG Department
The Planetary Circulation System
 12 The Planetary Circulation System Learning Goals After studying this chapter, students should be able to: 1. describe and account for the global patterns of pressure, wind patterns and ocean currents
MET 3502 Synoptic Meteorology. Lecture 5: Surface Weather Elements
 MET 3502 Synoptic Meteorology Lecture 5: Surface Weather Elements Surface Weather Elements Not observations of the surface, but Observations made by an observer (or instrument) at the surface Example:
Air Masses and Fronts
 Air Masses and Fronts AT 350: Ahrens Chapter 12 Air Mass Properties Air masses take on the properties of the underlying surface Air masses are classified according to their location of origin Geographical
1. COLD FRONT - CLOUD STRUCTURE IN SATELLITE IMAGES
 1. COLD FRONT - CLOUD STRUCTURE IN SATELLITE IMAGES The satellite image shows a cyclonically curved synoptic scale cloud band usually a few hundred kilometres wide; in the VIS image the cloud band mostly
WEATHER. Review Note Cards
 WEATHER Review Note Cards Thermometer Weather instrument that measures air temperature Units include F, C, and K ESRT 13 Sling Psychrometer Weather instrument that measures relative humidity and dewpoint
Phenomena of synoptic scale
 Chapter 5 Phenomena of synoptic scale 5.1 Analysis of fronts 5.1.1 Concept of fronts A front is defined as a boundary between air masses. At such a boundary, a vertical circulation is excited along the
Final Examination, MEA 443 Fall 2008, Lackmann
 Place an X here to count it double! Name: Final Examination, MEA 443 Fall 2008, Lackmann If you wish to have the final exam count double and replace your midterm score, place an X in the box above. As
Global Atmospheric Circulation
 Global Atmospheric Circulation Polar Climatology & Climate Variability Lecture 11 Nov. 22, 2010 Global Atmospheric Circulation Global Atmospheric Circulation Global Atmospheric Circulation The Polar Vortex
Grade 9 Geography Chapter 11 - Climate Connections
 Grade 9 Geography Chapter 11 - Climate Connections 1. Define: Weather. 2. In what way has weather affected your activities in the last two weeks? 3. Define: Climate. 4. Canada s climate is a function of
Fort Lewis, Washington (47 05'N, 'W)
") Fort Lewis, Washington (47 05'N, 122 35'W) Full Year Climatology CONVENTIONS: The spelling of place names and geographical features are those used by the National Imagery and Mapping Agency (NIMA). All
Fort Lewis, Washington (47 05'N, 122 35'W) Full Year Climatology CONVENTIONS: The spelling of place names and geographical features are those used by the National Imagery and Mapping Agency (NIMA). All
2. What are the four most common gasses in the atmosphere and their percentages?
 Meteorology Review Directions: Answer the following open ended review questions. Utilize a diagram where appropriate and do make sure that you label and describe the drawing. Atmospheric Composition 1.
Chapter 21. Weather Patterns and Severe Storms
 Chapter 21 Weather Patterns and Severe Storms 20.1 Air Masses Air Masses and Weather Air Masses An air mass is an immense body of air that is characterized by similar temperatures and amounts of moisture
L.O Students will learn about factors that influences the environment
 Name L.O Students will learn about factors that influences the environment Date 1. At the present time, glaciers occur mostly in areas of A) high latitude or high altitude B) low latitude or low altitude
Forecasting Weather: Air Masses and Fronts
 Forecasting Weather: Air Masses and Fronts Weather is a combination of local conditions at any one time. It's what's happening outside right now, right here. Weather includes: Temperature Humidity Air
vis = 74 visibility = vis - 50, for 56 vis 80
 ATSC 201 Fall 2018 Assignment 11 Answer Key Total marks out of 69 Chapter 9: A1h, A7a, A8h, A10all Chapter 12: A1h, A7h, A8h, A11g, E21, E23 Chapter 9 A1h) Find the pressure "reduced to sea level" using