Department of Earth & Climate Sciences San Francisco State University
|
|
|
- Roberta Sparks
- 5 years ago
- Views:
Transcription
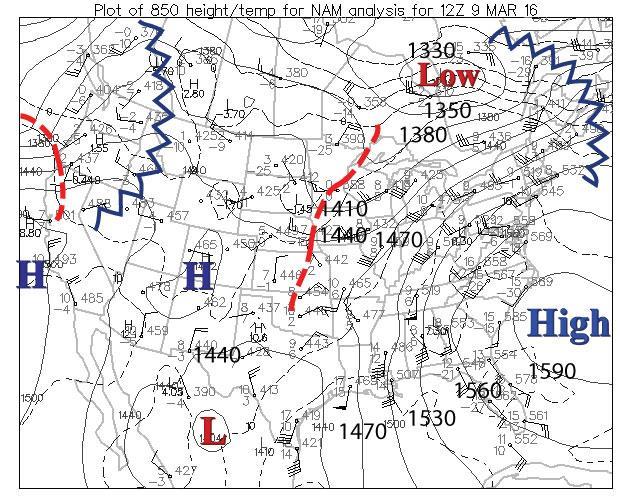
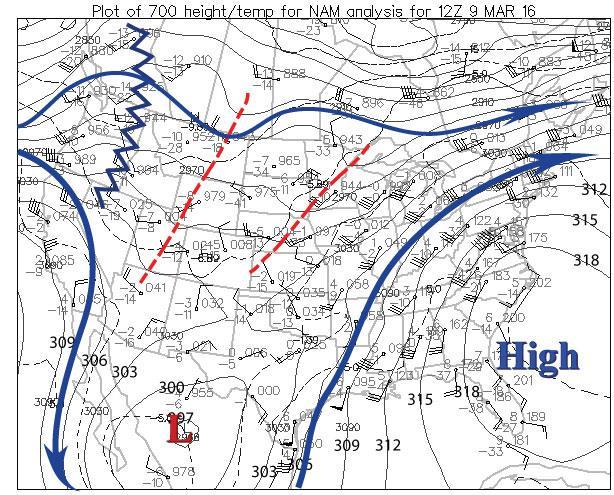
1 Department of Earth & Climate Sciences San Francisco State University Name ERTH 260: Inclass Exercise #5 Working With Weather Maps and Soundings: Finding Pressure Features and Fronts Due Wednesday 28 February 2018 (100 points) All students are to do the analyses exercises and answer the questions, but only the students indicated will be asked to explain to the class 1. Upper air charts. (15 pts): Indicate by drawing on your chart (conventionally with proper colors) the following: a. 850 mb one cyclone, one anticyclone and a trough, besides the ones analyzed; (5 pts) b. 700 mb - one cyclone and one anticyclone, jet stream(s); (5 pts) c. 500 mb one trough, one ridge, one cyclone and one anticyclone, jet stream(s; (5 pts)
2 2
3 3
 (a) Put values on the isobars that are unlabeled.")
4 2. Surface Weather Map: Examine the attached surface weather map: (30 pts) Note the question marks at the center of three pressure systems and the boundary indicated by a solid bold line. (30 pts) (a) Put values on the isobars that are unlabeled. (10 pts) (b) Label the boundaries A, B, and C with the correct symbols (10 pts) (c) Label the pressure systems indicated by question marks appropriately. (10 pts) 4
 (a) Explain why the soundings indicates a layer of high clouds is probably over both radiosonde sites.")
5 3. Soundings: Examine the two attached soundings. KILX is Lincoln, Illinois, and KINL International Falls, Minnesota (see map for locations). (20 pts) (a) Explain why the soundings indicates a layer of high clouds is probably over both radiosonde sites. (5 pts) The soundings both have a layer in the upper troposphere in which the temperature and dew point are very close together, indicating high relative humidities there. This is consistent with a layer of high clouds being present at both places. (b) Indicate the Tropopause on both soundings. (5 pts) See soundings. (c) The definition of a front is a boundary between air masses that have different temperature characteristics and that have large horizontal (~1000s km) and vertical (~through Troposphere) extent... Comment on how the soundings suggest that there is a front between the two stations. (10 pts) 5

6 The environmental lapse rate represents the actual change in temperature with height at a station, and this is shown as the dark line on the right on the two soundings. For there to be a front between the stations, there should be a systematic difference in temperature at all elevations until the Tropopause. For the case considered here, the temperatures at Lincoln are systematically higher at all levels. Hence, there is a front between Lincoln and International Falls, and this corresponds to the surface boundary shown on the surface map. 4. Meteogram: Examine the attached meteogram for San Antonio TX (see surface map for location). The data indicates that a boundary passed through San Antonio between 06 and 07 UTC (15 pts) (a) Explain how the temperature, present weather, rainfall, and wind information indicate that a front moved passed San Antonio at that time. (5 pts) 6
7 Between 06 and 07 UTC the following occurred at San Antonio: the temperature sharply fell, thunderstorms were observed, and the wind shifted from southeast to north northwest. The temperature fall is something we d expect with a front, since there is warm air on one side of a front and cold air on the other side. Warm air is usually associated with southerly winds and cold air with northerly winds. Normally, cloudiness and precipitation occur with fronts, and the thunderstorm observations are consistent with that. (b) Explain what type of front moved through San Antonio at that time, using the temperature and wind information. (5 pts) Ahead of cold fronts in wave cyclones, winds are generally southerly and northwesterly behind, as cold air moves in from the north. Also, temperatures should fall abruptly with the passage of a cold front. So the temperature and wind information at San Antonio is consistent with the passage of a cold front. (c) Explain whether your analysis of the type of front is consistent with your answer in 2(b) above. (5 pts) I analyzed a surface cold front off the Gulf Coast in 2(b). So my answers here are consistent with that. 7
.")
8 5. Student Presentations Give a brief overview of what you did, using your map as illustration. Student names that are bold faced are the coordinator for the group (arbitrarily chosen and will rotate throughout semester). Presentations are on Friday 24 February, lab hour of class (20 points) Part 1: Linda (a), Allen (b) and Kellen (c) Part 2: Emma (a) (b) and Tanay (c) Part 3: Nicolas (a), Rami (b), and Cynthia (c) Part 4: Yan Tung (b) and Wyndham (a) (c) 8
San Francisco State University Department of Earth & Climate Sciences Fall 2017
 San Francisco State University Name Department of Earth & Climate Sciences Fall 2017 Part 1: Fronts Final Inclass Exercise (Inclass Exercise 11) Diagnosing Fronts and Upper Tropospheric Divergence Patterns
Metr 201 Quiz #2 100 pts. A. Short Answer and Definitions. (4 points each for a total of 28 points in this section).
.") Department of Earth & Climate Sciences Name San Francisco State University February 23, 2015 Metr 201 Quiz #2 100 pts. A. Short Answer and Definitions. (4 points each for a total of 28 points in this section).
Department of Earth & Climate Sciences Name San Francisco State University February 23, 2015 Metr 201 Quiz #2 100 pts. A. Short Answer and Definitions. (4 points each for a total of 28 points in this section).
Lab 19.2 Synoptic Weather Maps
 Lab 19.2 Synoptic Weather Maps Name: Partner: Purpose The purpose of this lab is to have you read and interpret the information displayed on synoptic weather maps. You will also learn the techniques used
Department of Geosciences San Francisco State University Spring Metr 201 Monteverdi Quiz #5 Key (100 points)
") Department of Geosciences Name San Francisco State University Spring 2012 Metr 201 Monteverdi Quiz #5 Key (100 points) 1. Fill in the Blank or short definition. (3 points each for a total of 15 points)
Department of Geosciences Name San Francisco State University Spring 2012 Metr 201 Monteverdi Quiz #5 Key (100 points) 1. Fill in the Blank or short definition. (3 points each for a total of 15 points)
ERTH 260 In-class Exercise 3 Key: Weather Map Features Introduction to Boundaries
 San Francisco State University Name Department of Earth & Climate Sciences Spring 2018 ERTH 260 In-class Exercise 3 Key: Weather Map Features Introduction to Boundaries 100 points Due Wednesday 14 February
DEPARTMENT OF GEOSCIENCES SAN FRANCISCO STATE UNIVERSITY. Metr Fall 2012 Test #1 200 pts. Part I. Surface Chart Interpretation.
 DEPARTMENT OF GEOSCIENCES SAN FRANCISCO STATE UNIVERSITY NAME Metr 356.01 Fall 2012 Test #1 200 pts Part I. Surface Chart Interpretation. Figure 1. Surface Chart for 1500Z 7 September 2007 1 1. Pressure
Metr 201 Quiz #4 Key 100 pts. A. Short Answer and Definitions. (3 points each for a total of 18 points in this section).
.") Department of Earth & Climate Sciences Name San Francisco State University March 30, 2015 Metr 201 Quiz #4 Key 100 pts. A. Short Answer and Definitions. (3 points each for a total of 18 points in this
Department of Earth & Climate Sciences Name San Francisco State University March 30, 2015 Metr 201 Quiz #4 Key 100 pts. A. Short Answer and Definitions. (3 points each for a total of 18 points in this
ESCI 1010 Lab 6 Midlatitude Cyclones and Thunderstorms
 ESCI 1010 Lab 6 Midlatitude Cyclones and Thunderstorms Before Lab: Review pages 244-324 in your Weather and Climate textbook. Pay special attention to the sections entitled Fronts, Life Cyclone of a Midlatitude
DEPARTMENT OF EARTH & CLIMATE SCIENCES Name SAN FRANCISCO STATE UNIVERSITY Nov 29, ERTH 360 Test #2 200 pts
 DEPARTMENT OF EARTH & CLIMATE SCIENCES Name SAN FRANCISCO STATE UNIVERSITY Nov 29, 2018 ERTH 360 Test #2 200 pts Each question is worth 4 points. Indicate your BEST CHOICE for each question on the Scantron
WEATHER PATTERNS NAME DATE. VOCABULARY: Synoptic weather map- Isotherm- Barometric Pressure- Isobar- Convergence- Divergence- Cyclone- Anticyclone-
 NAME DATE VOCABULARY: Synoptic weather map- WEATHER PATTERNS Isotherm- Barometric Pressure- Isobar- Convergence- Divergence- Cyclone- Anticyclone- Air mass- Source region- Front- OBJECTIVE: Construct a
Chapter 12 Fronts & Air Masses
 Chapter overview: Anticyclones or highs Air Masses o Classification o Source regions o Air masses of North America Fronts o Stationary fronts o Cold fronts o Warm fronts o Fronts and the jet stream o Frontogenesis
Name SOLUTIONS T.A./Section Atmospheric Science 101 Homework #6 Due Thursday, May 30 th (in class)
") Name SOLUTIONS T.A./Section Atmospheric Science 101 Homework #6 Due Thursday, May 30 th (in class) 1. General Circulation Briefly describe where each of the following features is found in the earth s general
Name SOLUTIONS T.A./Section Atmospheric Science 101 Homework #6 Due Thursday, May 30 th (in class) 1. General Circulation Briefly describe where each of the following features is found in the earth s general
Answers to Clicker Questions
 Answers to Clicker Questions Chapter 1 What component of the atmosphere is most important to weather? A. Nitrogen B. Oxygen C. Carbon dioxide D. Ozone E. Water What location would have the lowest surface
ERTH 360 Test #2 Key Fall pts
 DEPARTMENT OF EARTH & CLIMATE SCIENCES SAN FRANCISCO STATE UNIVERSITY Nov 29, 2016 ERTH 360 Test #2 Key Fall 2016 200 pts Each question is worth 4 points. Indicate your BEST CHOICE for each question on
ERTH 365 Homework #2: Hurricane Harvey. 100 points
 ERTH 365 Homework #2: Hurricane Harvey 100 points Due by 6pm, Tuesday 30 October 2018, ELECTRONIC SUBMISSON BY EMAIL ONLY BY 6PM (send to klevey@sfsu.edu) (acceptable formats: MS Word, Google Doc, plain
Fun with Weather Maps! (no, really stop laughing) AOSC 200 Tim Canty
 AOSC 200 Tim Canty") Fun with Weather Maps! (no, really stop laughing) AOSC 200 Tim Canty Class Web Site: http://www.atmos.umd.edu/~tcanty/aosc200 Topics for today: Observations Station Model Temperature Maps Pressure Maps
Fun with Weather Maps! (no, really stop laughing) AOSC 200 Tim Canty Class Web Site: http://www.atmos.umd.edu/~tcanty/aosc200 Topics for today: Observations Station Model Temperature Maps Pressure Maps
Cyclones and Anticyclones, Ridges and Troughs
 Cyclones and Anticyclones, Ridges and Troughs Isobars on surface maps often have a closed appearance (as illustrated) Areas of low pressure are called cyclones, while areas with high pressure are called
and 24 mm, hPa lapse rates between 3 and 4 K km 1, lifted index values
 3.2 Composite analysis 3.2.1 Pure gradient composites The composite initial NE report in the pure gradient northwest composite (N = 32) occurs where the mean sea level pressure (MSLP) gradient is strongest
True or false: The atmosphere is always in hydrostatic balance. A. True B. False
 Clicker Questions and Clicker Quizzes Clicker Questions Chapter 7 Of the four forces that affect the motion of air in our atmosphere, which is to thank for opposing the vertical pressure gradient force
2. What are the four most common gasses in the atmosphere and their percentages?
 Meteorology Review Directions: Answer the following open ended review questions. Utilize a diagram where appropriate and do make sure that you label and describe the drawing. Atmospheric Composition 1.
Earth Science. Lab 21: Weather Patterns
 Name: Lab 21: Weather Patterns Earth Science Date: Introduction: A basic principle in Earth Science is that energy is constantly bringing about changes. In order to understand the changing Earth, we must
Department of Geosciences San Francisco State University Spring Metr 201 Monteverdi Quiz #5 Key 150 pts.
 Department of Geosciences Name San Francisco State University Spring 2013 Metr 201 Monteverdi Quiz #5 Key 150 pts. 1. Definitions. (5 points each for a total of 20 points in this section). (a) Coriolis
 http://www.ssec.wisc.edu/data/composites.html Red curve: Incoming solar radiation Blue curve: Outgoing infrared radiation. Three-cell model of general circulation Mid-latitudes: 30 to 60 latitude MID-LATITUDES
DEPARTMENT OF EARTH & CLIMATE SCIENCES NAME SAN FRANCISCO STATE UNIVERSITY Fall ERTH FINAL EXAMINATION KEY 200 pts
 DEPARTMENT OF EARTH & CLIMATE SCIENCES NAME SAN FRANCISCO STATE UNIVERSITY Fall 2016 Part 1. Weather Map Interpretation ERTH 365.02 FINAL EXAMINATION KEY 200 pts Questions 1 through 9 refer to Figure 1,
ERTH 465 Fall Lab 5. Absolute Geostrophic Vorticity. 200 points.
 Name Date ERTH 465 Fall 2015 Lab 5 Absolute Geostrophic Vorticity 200 points. 1. All labs are to be kept in a three hole binder. Turn in the binder when you have finished the Lab. 2. Show all work in mathematical
Module 9 Weather Systems
 Module 9 Weather Systems In this module the theory of atmospheric dynamics is applied to different weather phenomena. The first section deals with extratropical cyclones, low and high pressure areas of
1. Which weather map symbol is associated with extremely low air pressure? A) B) C) D) 2. The diagram below represents a weather instrument.
 B) C) D) 2. The diagram below represents a weather instrument.") 1. Which weather map symbol is associated with extremely low air pressure? 2. The diagram below represents a weather instrument. Which weather variable was this instrument designed to measure? A) air pressure
1. Which weather map symbol is associated with extremely low air pressure? 2. The diagram below represents a weather instrument. Which weather variable was this instrument designed to measure? A) air pressure
ATS 351, Spring 2010 Lab #11 Severe Weather 54 points
 ATS 351, Spring 2010 Lab #11 Severe Weather 54 points Question 1 (10 points): Thunderstorm development a) Sketch and describe the stages of development of a single cell thunderstorm. About how long does
3. As warm, moist air moves into a region, barometric pressure readings in the region will generally 1. decrease 2. increase 3.
 Teacher: Mr. Prizzi Castle Learning Review 1 1. Which process most directly results in cloud formation? 1. condensation 3. precipitation 2. transpiration 4. radiation 2. An air mass originating over north
Chapter 1 Anatomy of a Cyclone
 Chapter 1 Anatomy of a Cyclone The Beast in the East 15-17 February 2003 Extra-tropical cyclone an area of low pressure outside of the tropics Other names for extra-tropical cyclones: Cyclone Mid-latitude
CHAPTER 13 WEATHER ANALYSIS AND FORECASTING MULTIPLE CHOICE QUESTIONS
 CHAPTER 13 WEATHER ANALYSIS AND FORECASTING MULTIPLE CHOICE QUESTIONS 1. The atmosphere is a continuous fluid that envelops the globe, so that weather observation, analysis, and forecasting require international
How Can You Predict Weather Changes?
 How Can You Predict Weather Changes? How to Predict Weather Meteorologists make weather predictions daily. They use the same processes that you will. They collect weather data. They plot the data on maps.
WEATHER FORECASTING Acquisition of Weather Information WFO Regions Weather Forecasting Tools Weather Forecasting Tools Weather Forecasting Methods
 1 2 3 4 5 6 7 8 WEATHER FORECASTING Chapter 13 Acquisition of Weather Information 10,000 land-based stations, hundreds of ships and buoys; four times a day, airports hourly Upper level: radiosonde, aircraft,
PLOTTING WEATHER DATA to perform a SURFACE ANALYSIS
 PLOTTING WEATHER DATA to perform a SURFACE ANALYSIS The surface analysis permits one to identify and locate the large scale features of the sea level pressure field and the surface fronts. Isobars with
Homework 2: Hurricane Katrina. Part 1. Hurricane Katrina, August 28, 2005 Satellite Imagery
 Metr 302 Homework 2 Fall 2014 Meteorology 302 Fall 2014 Name Homework 2: Hurricane Katrina 100 points total Distributed Thursday 30 October 2014; Due Thursday 13 November 2014 Answer all questions in complete
Module 11: Meteorology Topic 5 Content: Weather Maps Notes
 Introduction A variety of weather maps are produced by the National Weather Service and National Oceanographic Atmospheric Administration. These maps are used to help meteorologists accurately predict
AOSC201: Weather and Climate Lab
 AOSC201: Weather and Climate Lab Week 8: Forecasting - Analysis Section 107/108 Instructor: Agniv Sengupta q Lab #7 of Lab Manual (pages 41-49) q 50 points in total q INDIVIDUAL Work for the entire lab
Lecture 14. Extratropical Cyclones extratropical cyclone
 Lecture 14. Extratropical Cyclones In mid-latitudes, much of our weather is associated with a particular kind of storm, the extratropical cyclone Cyclone: circulation around low pressure center Some midwesterners
Summary of High Wind Event of 7 March 2004
 Summary of High Wind Event of 7 March 2004 This event was characterized by a very strong jet streak that developed over North Carolina by 00 UTC 8 March, as seen in the Eta model analysis at 300 mb, with
ESCI 1010 Lab 1 Introduction to Weather Data
 ESCI 1010 Lab 1 Introduction to Weather Data Before Lab: Review pages 1-51 in your Weather and Climate textbook. Pay special attention to the sections entitled Location and Time on Earth and Some Weather
DOWNLOAD PDF READING CLIMATE MAPS
 Chapter 1 : Template:Climate chart/how to read a climate chart - Wikipedia Maps don't just tell you which way to go they can tell you practically everything about an area of land, even the weather. Learn
Fronts in November 1998 Storm
 Fronts in November 1998 Storm Much of the significant weather observed in association with extratropical storms tends to be concentrated within narrow bands called frontal zones. Fronts in November 1998
Air Masses, Fronts, Storm Systems, and the Jet Stream
 Air Masses, Fronts, Storm Systems, and the Jet Stream Air Masses When a large bubble of air remains over a specific area of Earth long enough to take on the temperature and humidity characteristics of
Weather Station Model
 Fun with Weather Maps! (no, really stop laughing) AOSC 200 Tim Canty Class Web Site: http://www.atmos.umd.edu/~tcanty/aosc200 Topics for today: Station Model Temperature Maps Pressure Maps Fronts Lecture
PRACTICAL ACTIVITY: DRAWING ISOLINES OR CONTOURS
 COME RAIN OR SHINE PRACTICAL ACTIVITY: DRAWING ISOLINES OR CONTOURS Ideally you would need a pencil for this activity (rather than a pen) and coloured pencils are useful too. These activities maybe a little
November 28, 2017 Day 1
 November 28, 2017 Day 1 Air Masses & Fronts Teachers- please out the sheet (right) for the students to fill in as we go! Review: Clouds & Precipitation? What are the 4 different clouds? Status, Cumulus,
Department of Earth & Climate Sciences Spring 2016 Meteorology 260
 Department of Earth & Climate Sciences Spring 2016 Meteorology 260 Name Laboratory #9 Key: Joplin Tornado Day Subsynoptic, Thermodynamic, and Wind Shear Setting Part A: 1600 UTC Surface Chart Subsynoptic
Pressure Conversion in Millibars
 Name Date The Weather Map Biggie Lab: Make it Colorful and Purty! Now that you have learned about all of the different variables that contribute to daily changes in weather, it is now time to bring it
Weather FActors. May 8 4:15 PM. Analyzing AIR MASSES & THEIR MOVEMENT
 ` Weather FActors P: Analyze weather Q: What are the factors that cause weather? May 8 4:15 PM Analyzing AIR MASSES & THEIR MOVEMENT Read and take notes... Using pages 72-79: (IN YOUR JOURNAL!) - Identify
Unit: Weather Study Guide
 Name: Period: Unit: Weather Study Guide Define each vocabulary word on a separate piece of paper or index card. Weather Climate Temperature Wind chill Heat index Sky conditions UV index Visibility Wind
Mr. P s Science Test!
 WEATHER- 2017 Mr. P s Science Test! # Name Date 1. Draw and label a weather station model. (10 pts) 2. The is the layer of the atmosphere with our weather. 3. Meteorologists classify clouds in about different
Occlusion Cyclogenesis
 Occlusion Cyclogenesis Part I: Occlusion cloud bands in comparison to CF and WFs Concepts for cyclogenesis Different types of cyclogenesis and examples Numerical parameters on isobaric and isentropic surfaces
DEPARTMENT OF EARTH & CLIMATE SCIENCES SAN FRANCISCO STATE UNIVERSITY. Metr Fall 2014 Test #1 September 30, 2014
 DEPARTMENT OF EARTH & CLIMATE SCIENCES SAN FRANCISCO STATE UNIVERSITY NAME Metr 302.02 Fall 2014 Test #1 September 30, 2014 200 pts (4 pts each answer) Part I. Surface Chart Interpretation. Questions 1
Answer Key for Practice Test #2
 Answer Key for Practice Test #2 Section 1. Multiple-choice questions. Choose the one alternative that best completes the statement or answers the question. Mark your choice on the optical scan sheet. 1.
Monteverdi Metr 201 Quiz #4 100 pts.
 DEPARTMENT OF GEOSCIENCES Name San Francisco State University April 27, 2012 Monteverdi Metr 201 Quiz #4 100 pts. A. Definitions. (5 points each for a total of 25 points in this section). (a) Convective
Earth and Space Science. Teacher s Guide
 Earth and Space Science Teacher s Guide WALCH PUBLISHING Table of Contents To the Teacher............................................................. vi Classroom Management....................................................
Science Olympiad Meteorology Quiz #1 Page 1 of 7
 1) What is generally true about the stratosphere: a) Has turbulent updrafts and downdrafts. b) Has either a stable or increasing temperature profile with altitude. c) Where the auroras occur. d) Both a)
ANSWER KEY. Part I: Synoptic Scale Composite Map. Lab 12 Answer Key. Explorations in Meteorology 54
 ANSWER KEY Part I: Synoptic Scale Composite Map 1. Using Figure 2, locate and highlight, with a black dashed line, the 500-mb trough axis. Also, locate and highlight, with a black zigzag line, the 500-mb
Weather report 28 November 2017 Campinas/SP
 Weather report 28 November 2017 Campinas/SP Summary: 1) Synoptic analysis and pre-convective environment 2) Verification 1) Synoptic analysis and pre-convective environment: At 1200 UTC 28 November 2017
ERTH 465 Fall Laboratory Exercise 5. Surface Weather Observations (METARS) and Frontal Analysis (300 pts)
 and Frontal Analysis (300 pts)") ERTH 465 Fall 2017 Laboratory Exercise 5 Surface Weather Observations (METARS) and Frontal Analysis (300 pts) Insert in ringed-three hole binder. Point deductions for sloppy or late work. Due date: Tuesday
ERTH 465 Fall 2017 Laboratory Exercise 5 Surface Weather Observations (METARS) and Frontal Analysis (300 pts) Insert in ringed-three hole binder. Point deductions for sloppy or late work. Due date: Tuesday
RR#4 - Multiple Choice
 1. The map below shows the amount of snowfall, in inches, produced by a lake-effect snowstorm in central New York State. The wind that produced this snowfall pattern most likely came from the 1) northeast
INTRODUCTION TO METEOROLOGY PART ONE SC 213 MAY 21, 2014 JOHN BUSH
 INTRODUCTION TO METEOROLOGY PART ONE SC 213 MAY 21, 2014 JOHN BUSH WEATHER PATTERNS Extratropical cyclones (low pressure core) and anticyclones (high pressure core) Cold fronts and warm fronts Jet stream
A Cyclogenesis south of the Alps. Manfred Kurz Neustadt/Weinstraße
 A Cyclogenesis south of the Alps Manfred Kurz Neustadt/Weinstraße A cyclogenesis south of the Alps Surface maps 06-11-99, 00 UTC The occluded frontal system of a quasi-stationary low above the North Sea
SPI Analyze data to identify events associated with heat convection in the atmosphere. SPI Recognize the connection between the
 SPI 0607.8.1 - Analyze data to identify events associated with heat convection in the atmosphere. SPI 0607.8.2 - Recognize the connection between the sun s energy and the wind. o Energy from the Sun creates
Vertical structure. To conclude, we will review the critical factors invloved in the development of extratropical storms.
 Vertical structure Now we will examine the vertical structure of the intense baroclinic wave using three visualization tools: Upper level charts at selected pressure levels Vertical soundings for selected
Refer to Figure 1 and what you have learned so far in this course when responding to the following:
 Refer to Figure 1 and what you have learned so far in this course when responding to the following: 1.Looking down on a Northern Hemisphere extratropical cyclone, surface winds blow [(clockwise and outward)(counterclockwise
Chapter 12: Meteorology
 Chapter 12: Meteorology Section 1: The Causes of Weather 1. Compare and contrast weather and climate. 2. Analyze how imbalances in the heating of Earth s surface create weather. 3. Describe how and where
Page 1. Name: 4) State the actual air pressure, in millibars, shown at Miami, Florida on the given weather map.
 State the actual air pressure, in millibars, shown at Miami, Florida on the given weather map.") Name: Questions 1 and 2 refer to the following: A partial station model and meteorological conditions table, as reported by the weather bureau in the city of Oswego, New York, are shown below. 1) Using
Name: Questions 1 and 2 refer to the following: A partial station model and meteorological conditions table, as reported by the weather bureau in the city of Oswego, New York, are shown below. 1) Using
Mesoscale Meteorology Assignment #3 Q-G Theory Exercise. Due 23 February 2017
 Mesoscale Meteorology Assignment #3 Q-G Theory Exercise 1. Consider the sounding given in Fig. 1 below. Due 23 February 2017 Figure 1. Skew T-ln p diagram from Tallahassee, FL (TLH). The observed temperature
NOTES Surface Weather Maps.notebook. April 05, atmospheric. rises. Coriolis. Coriolis. counterclockwise. counterclockwise. point. origin.
 Surface Weather Maps L Symbol : Indicates an area of low air pressure (aka, pressure or pressure). Called a relatively barometric atmospheric cyclone Formation: As warm air in the center cyclone of a,
WEATHER MAPS NAME. Temperature: Dew Point: Wind Direction: Wind Velocity: % of Sky Covered: Current Pressure:
 NAME WEATHER MAPS For decades hundreds of weather stations throughout the United States have been making standard observations of temperature, moisture, air pressure and winds. The data are collected centrally
Severe Weather and weather mapping Remediation Assignment. Once the page has been approved, Mrs. Blinka will sign here:
 Severe Weather and weather mapping Remediation Assignment Part I: Complete the remediation page attached This will be a single page (front and back) that helps your organize the most important information
Science 1206 Weather Unit REVIEW Short Answer
 Science 1206 Weather Unit REVIEW Short Answer 1. Which is defined as the short-term conditions of the atmosphere? 2. Which is defined as the long-term conditions of the atmosphere? 3. Which is used to
Middle Latitude Cyclones a storm that forms at middle and high latitudes, outside of the tropics.
 Middle Latitude Cyclones a storm that forms at middle and high latitudes, outside of the tropics. Polar Front Theory a theory that explains the life cycle of mid latitude cyclones and their associated
SEMESTER II EXAMINATION 2008/2009. MAPH Synoptic Meteorology
 SEMESTER II EXAMINATION 2008/2009 MAPH 40410 Synoptic Meteorology Extern examiner: Professor Keith Shine Head of School: Professor Mícheál Ó Searcóid Lecturer: Professor Peter Lynch Lecturer: Dr Rodrigo
Final Examination, MEA 443 Fall 2008, Lackmann
 Place an X here to count it double! Name: Final Examination, MEA 443 Fall 2008, Lackmann If you wish to have the final exam count double and replace your midterm score, place an X in the box above. As
Occlusion cyclogenesis II
 Occlusion cyclogenesis II Upper level influences on cyclogenesis Vorticity Advection (CVA) and the 4-quadrant jet streak model (Uccellini) Potential Vorticity (PV) (Hoskins Theory) Rapid cyclogenesis 14
Synoptic Meteorology II: Frontogenesis Examples Figure 1
 Synoptic Meteorology II: Frontogenesis Examples The below images, taken from the 1200 UTC 17 January 2019 GFS forecast run, provide examples of the contributions of deformation and divergence to frontogenesis.
NATS 101 Section 13: Lecture 3. Weather vs. Climate
 NATS 101 Section 13: Lecture 3 Weather vs. Climate Definition of Weather Weather: Condition of the atmosphere at a particular time and place. Comprised of: Air temperature: Degree of hotness or coldness
Weather Practice Test
 Name: Weather Practice Test 1. The diagram below shows weather instruments A and B. Which table correctly indicates the name of the weather instrument and the weather variable that it measures? A) B) C)
Department of Earth & Climate Sciences Spring 2016 Meteorology 260
 Department of Earth & Climate Sciences Spring 2016 Meteorology 260 Name Laboratory #9: Joplin Tornado Day Subsynoptic, Thermodynamic, and Wind Shear Setting Part A: 1600 UTC Surface Chart Subsynoptic Analyses
FORMATION OF AIR MASSES
 Chapter 24: Weather (air mass, fronts, Weather instruments, and forecasting the weather) Name: Period: Due Date: Air Mass Use the terms from the following list to complete the sentences below. Each term
** warm air mass
 Frontal cyclones -otherwise known as mid-latitude or wave cyclones. A cyclone is a cyclonically rotating system which, in mid- and high-latitudes is normally associated with the boundary between air masses
Grade 9 Geography Chapter 11 - Climate Connections
 Grade 9 Geography Chapter 11 - Climate Connections 1. Define: Weather. 2. In what way has weather affected your activities in the last two weeks? 3. Define: Climate. 4. Canada s climate is a function of
A case study of a heat low over central Australia
 A case study of a heat low over central Australia Martin Preissler Meteorological Institute, University of Munich, Germany Michael J. Reeder 1 School of Mathematical Sciences, Monash University, Australia
Module 11: Meteorology Topic 3 Content: Weather Instruments Notes
 Introduction In order for meteorologists to accurately predict the weather, they take thousands of different weather measurements each day. Meteorologists need to use many tools in order to draw an accurate
p = ρrt p = ρr d = T( q v ) dp dz = ρg
 dp dz = ρg") Chapter 1: Properties of the Atmosphere What are the major chemical components of the atmosphere? Atmospheric Layers and their major characteristics: Troposphere, Stratosphere Mesosphere, Thermosphere
Chapter 1: Properties of the Atmosphere What are the major chemical components of the atmosphere? Atmospheric Layers and their major characteristics: Troposphere, Stratosphere Mesosphere, Thermosphere
ERTH 465 Fall Lab 5. Absolute Geostrophic Vorticity. 200 points.
 Name Date ERTH 465 Fall 2015 Lab 5 Absolute Geostrophic Vorticity 200 points. 1. All labs are to be kept in a three hole binder. Turn in the binder when you have finished the Lab. 2. Show all work in mathematical
4/29/2011. Mid-latitude cyclones form along a
 Chapter 10: Cyclones: East of the Rocky Mountain Extratropical Cyclones Environment prior to the development of the Cyclone Initial Development of the Extratropical Cyclone Early Weather Along the Fronts
ERTH 465 Fall Lab 3. Vertical Consistency and Analysis of Thickness. (300 points)
") Name Date ERTH 465 Fall 2015 Lab 3 Vertical Consistency and Analysis of Thickness (300 points) 1. All labs are to be kept in a three hole binder. Turn in the binder when you have finished the Lab. 2. Show
Name Date ERTH 465 Fall 2015 Lab 3 Vertical Consistency and Analysis of Thickness (300 points) 1. All labs are to be kept in a three hole binder. Turn in the binder when you have finished the Lab. 2. Show
CONVERGENCE, DIVERGENCE, AND VORTICITY
 CHAPTER 1 CONVERGENCE, DIVERGENCE, AND VORTICITY In your reading of the AG2 manual, volume 1, you became familiar with the terms convergence, divergence, and vorticity when used in relation to surface
The Behaviour of the Atmosphere
 3 The Behaviour of the Atmosphere Learning Goals After studying this chapter, students should be able to: apply the ideal gas law and the concept of hydrostatic balance to the atmosphere (pp. 49 54); apply
Study Guide. Earth Systems 1109 Weather Dynamics. Adult Basic Education Science. Prerequisites: Credit Value: 1
 Adult Basic Education Science Weather Dynamics Study Guide Prerequisites: None Credit Value: 1 Text: Science 10 ; Ritter, Plumb, et al; Nelson, 2001. Earth Systems Concentration Earth Systems 3109A Earth
Final Examination. Part A Answer ONLY TWELVE QUESTIONS in Part A. (Each question is 3 points)
") ATS 210 Spring Term 2001 NAME: Final Examination This is a 2 hour, closed-book examination. Calculators may be used. All answers should be written on the examination paper. Use the final sheet for any
ATS 210 Spring Term 2001 NAME: Final Examination This is a 2 hour, closed-book examination. Calculators may be used. All answers should be written on the examination paper. Use the final sheet for any
Mid-Latitude Cyclones and Fronts. Lecture 12 AOS 101
 Mid-Latitude Cyclones and Fronts Lecture 12 AOS 101 Homework 4 COLDEST TEMPS GEOSTROPHIC BALANCE Homework 4 FASTEST WINDS L Consider an air parcel rising through the atmosphere The parcel expands as it
Go With the Flow From High to Low Investigating Isobars
 Go With the Flow From High to Low Investigating Isobars Science 10 Mrs. Purba Air Masses The air over a warm surface can be heated, causing it to rise above more dense air. The result is the formation
Weather - is the state of the atmosphere at a specific time & place
 Weather Section 1 Weather - is the state of the atmosphere at a specific time & place Includes such conditions as air pressure, wind, temperature, and moisture in the air The Sun s heat evaporates water
Meteorology Unit Study Guide
 Name: Key Pd. Date: 1. Define meteorology Meteorology Unit Study Guide Study of the atmosphere including weather and weather patterns 2. The most abundant gas in the atmosphere by volume is. This gas comprises
CURRICULUM OUTLINE. DEPARTMENT: Science DATE: January, 2004
 PARAMUS ELEMENTARY SCHOOL PARAMUS, NEW JERSEY CURRICULUM OUTLINE DEPARTMENT: Science DATE: January, 2004 COURSE: The Earth s Atmosphere GRADE LEVEL: Grade 6 I. COURSE DESCRIPTION: The student will explore
GEO165 LAB EXERCISE #3
 GEO165 LAB EXERCISE #3 Tools of the Meteorologist Part 2: Fronts Introduction 1. A front is the leading edge of a new air mass invading a region. Because Vilhelm Bjerknes was reminded of the bloody battle