Diagnostic Study of a Severe Thunderstorm over Jeddah
|
|
|
- Victoria Owens
- 5 years ago
- Views:
Transcription
1 Atmospheric and Climate Sciences, 2013, 3, Published Online January 2013 ( Diagnostic Study of a Severe Thunderstorm over Jeddah A. K. AL-Khalaf, H. Abdel Basset Department of Meteorology, Faculty of Meteorology, Environment, and Arid Land Agriculture, King Abdulaziz University, Jeddah, KSA heshmatm@yahoo.com Received November 3, 2012; revised December 5, 2012; accepted December 13, 2012 ABSTRACT Several aspects of the interaction between midlatitude and subtropical systems are investigated using a case study and a potential vorticity (PV) framework. Our case study occurred on 25 November 2009; Jeddah and other regions in Western Saudi Arabia were hit by heavy rainstorms. The analysis of absolute, relative, and potential vorticity implies the significance of the lower level dynamics in the initiation of this case of cyclogenesis. The impact of the severe convective weather process caused more than 90 millimeters of rain to fall in Jeddah in just four hours. The analysis indicates that the heavy rainfall was due to the existence of an upper level cold trough in the Eastern Mediterranean and a warm blocking high situated over southeastern Saudi Arabia and the Arabian Sea. In addition, an evident low level shear line set up in the northwest of Jeddah, and the southeast movement of the shear line caused dynamic lifting and unstable energy release over Jeddah. The water vapor transport occurred primarily below 700 hpa, and a low level jet transported the water vapor from the Red Sea to central Saudi Arabia. Furthermore, the blocking high in southern Saudi Arabia was favorable for maintaining water vapor passage for a long time. The topography of Jeddah also played a role in the enhancement of convection. Keywords: Potential Vorticity; Cyclogenesis; Convection; Topography; Jeddah; Blocking: Eastern Mediterranean 1. Introduction Potential vorticity (PV) diagnostics have been used extensively to gain a better understanding of the life cycles of cyclonic storms through case-studies and idealised simulations [1-9]. The results of these studies have contributed to the introduction of new conceptual models of cyclogenesis. However, their focus is mainly on extratropical cyclones and hurricanes. Cyclogenesis over the central Mediterranean region has become the subject of considerable research [10-14]. Such significant synoptic-scale events cause intense winds, precipitation, and temperature drop. Because of the intimate connection between the phenomena and local weather prediction, interest in understanding the characteristics of cyclogenesis over this region is enormous and ongoing. The structure of cyclones is often conceptualised in terms of three types of anomalous PV [2,4,5,7]. These consist of upper-level PV (UPV) anomalies, considered to be of stratospheric origin, lower tropospheric PV (LPV) anomalies, generated by diabatic effects, and surface potential temperature anomalies, which can be viewed as a thin layer of PV at the surface. [7] found that strong latent heat release in a cyclone produced a negative UPV anomaly in addition to a positive LPV anomaly. Since diabatic effects can reduce PV at upper levels, some au- thors [7,15] have distinguished this reduced upper-level PV (RUPV) from anomalous UPV of stratospheric origin. According to [1], the potential vorticity analysis of an isentropic surface summarizes the combined effect of the vorticity and temperature advection and allows the estimation of the vertical motion. In addition, the conservation of the isentropic potential vorticity in adiabatic processes allows the identification and examination of nonconservative processes, such as latent heat release and friction, while the inevitability principle allows the quantitative estimation of the effect of these processes. The objective of the present work is to diagnose a case of cyclogenesis in the context of isobaric vorticity and potential vorticity analysis in order to examine in detail the key dynamical aspects of the development. 2. Data and Methodology 2.1. Data The data used in this study have been taken from the archives of the European Center for Medium-Range Weather Forecasts. It consists of the horizontal wind components (u-eastward, v-northward), the temperature (T) and the geopotential height (z) on regular latitude-longitude grid resolution of for the isobaric levels 1000, 850, 700, 500, 400, 300, 250, 200, 150, and 100 hpa. The data
2 A. K. AL-KHALAF, H. A. BASSET 151 used was recorded at 0000, 0060, 1200, and 1800 GMT during the period 23 to 26 November The domain of study extends from 10 W to 60 E and from 10 N to 70 N Estimation of Potential Vorticity Potential vorticity fields were calculated from the available meteorological parameters, namely temperature and the horizontal wind components on constant pressure surface. For isobaric coordinates the potential vorticity was approximated by the product of the vertical components of absolute vorticity and potential temperature gradients as: PV v u R v T u T f x y P p x p y p where f is the Coriolis parameter, is the potential temperature, u is the wind in x-direction of the grid (W-E in principle) and v is the wind in y-direction. Following the [16], the dynamic tropopause is defined by the potential vorticity with P = Kpa 1 s 1 = 1.6 PVU, where, for convenience, the potential vorticity unit (PVU) is defined to be 10 7 Kpa 1 s 1. Cantered finite differences were used to compute horizontal derivatives and all vertical derivatives except those at the 1000 and 100 hpa levels, where non-centered differences were employed. The vertical motion,, is computed using the Q-vector representation of the quasigeostrophic equation by using the relaxation method [17]. The relative vorticity and absolute vorticity advection have been calculated from the actual data using the central finite differences method. 3. Synoptic Discussion On November 25, 2009, heavy rainstorms hit Jeddah, Makah, and other regions in western Saudi Arabia. More than 90 millimeters of rain fell in Jeddah in just four hours. This is nearly twice the average amount for an entire year and the heaviest rainfall in the Kingdom of Saudi Arabia (KSA) in a decade. A case of winter cyclogenesis over the Mediterranean extending from 23/00 to 26/12 November 2009 is considered in the present study. Based on 1000 hpa and 700 hpa charts, the life cycle of this cyclone can be divided into two periods. The first period (growth) is from 23/00 to 25/12 November; the second period (decay) is from 26/06 to 27/12 November. Charts for 1000 hpa and 700 hpa at 0000 and 1200 GMT on each day of the period 23/00 to 26/12 are shown in Figures 1 and 2, respectively. The 1000 and 700 hpa charts depict contours of height with 20 geopotential meter (gpm) increments. The isotherms in the P (1) charts of the two levels are analyzed with 5 C increments. At 23/00 November, Figure 1(a) shows that the subtropical high pressure dominates over North Africa and the Mediterranean area and extends east to cover the north of the KSA and eastern Mediterranean countries. The figure also illustrates that the Sudan low and its associated inverted v-shaped trough (Red Sea trough) oscillate northward to cover eastern Egypt and the entire Red Sea region. An obvious thermal gradient associated with the northward oscillation of the Red Sea trough extends zonally to cover the southern portion of the KSA and northern Sudan. During the next 12 hours (23/12), the subtropical high weakens and moves eastward, while the Red sea trough propagates slowly northward and the Sudan low deepens to 80 gpm (Figure 1(b)). The cyclone of special interest first appeared as an extension of the traveling depression eastern Mediterranean at 23/00 November (Figure 2). A cut-off low is formed at 23/12 November and a well-defined cyclonic depression becomes clear over Egypt (Figure 2(b)). At 23/00 November a thermal gradient lies along the northeast of the KSA. This baroclinic zone leads to the formation of an upper level cut-off low. At 24/00 November a strong development occurs at the surface and at upper air, where the Sudan low at the surface and its associated Red Sea trough moves northward to cover the northern portion of the Eastern Mediterranean, Egypt, and the KSA. The Sudan low centers over Red Sea at 15 N and 37.5 E; the geopotential height at the center reaches 100 gpm. In the upper air (700 hpa) the cut-off low deepens and moves slowly eastward to a point just north of Egypt; the geopotential height at the center reaches 3100 gpm (Figure 2(c)). During the next 12 hours (24/12) the inverted v- shaped trough associated with the Sudan low oscillates northward and in the upper air (700 hpa) the cut-off low also moves eastward to a point just northeast of Egypt. During the period 24/18 to 25/12 November (the rainy period), a strong interaction occurs between the inverted v-shaped troughs extending from the tropical region and from the middle latitude region; the two cyclones merge. The most interesting features are the strong northward warm advection from the tropical region associated with the air flow around the Sudan low and the strong southward cold advection. The interaction between these two air masses causes a strong instability over the Eastern Mediterranean and western Saudi Arabia. After 25/12 November, the inverted v-shaped trough of the Sudan low moved in a southwesterly direction and the upper air trough retreated westward toward the associated cut-off low centered over northwestern Egypt; the interaction between the two troughs vanishes. During the next day (26 November) the depression starts to weaken and its central pressure increases gradually. On the other hand, the subtropical high pressure over North Africa and


")
 in 5 C")

3 152 A. K. AL-KHALAF, H. A. BASSET Figure hpa height contour in 20 m intervals (solid) and temperature (dotted) in 5 C increments for 23/00-26/12 UTC November 2009.


")
 in 5 C")

4 A. K. AL-KHALAF, H. A. BASSET 153 Figure hpa height contours in 20 m intervals (solid) and temperatures (dashed) in 5 C increments for 23/00-26/12 UTC November 2009.
5 154 A. K. AL-KHALAF, H. A. BASSET the Western Mediterranean is extended with a major ridge that joins the Siberian high on 27 November. In other words, no more cold advection is permitted to the cyclone. While the Siberian high pressure propagates westward, the horizontal extension of the cyclone decreases and moves slowly eastward. It becomes a stationary vortex rotating above the northeastern portion of the Mediterranean (Figures 2(g) and (h)). Finally the cyclone drifts slowly northeastward and leaves the area by 28 November. 4. Isobaric Vorticity Analysis It has been recognized that central and eastern Mediterranean cyclogenesis is usually forced by a variety of upper-level tropospheric features; the lower tropospheric physical and dynamic processes follow [10,12,18]. This is associated with Helmholtz theory, which supports the controlling of the relation between low-level baroclinicity and upper-level forcing of surface cyclogenesis Genesis of the Initial Disturbance at the Upper Levels It is known that the subtropical jet and polar jet reach maximum speeds at approximately 200 and 300 hpa, respectively. Therefore, to show the behavior of the subtropical and polar jets during the development of the events involved in this case study, we focus on the 200 and 300 hpa isotach fields in the following discussion. Figures 3 and 4 display the isotachs (wind speed) at 200 and 300 hpa from 24/06 to 26/00 November 2009, respectively. At 24/00 an omega-shaped blocking over the Northeast Atlantic and Western Europe dominated the largescale upper tropospheric circulation with a strong northwest-southeast jet stream on its eastern flank (Figure 4). Because of the warm advection in the region of the jet streak, the ridge propagated slowly northeastwards, resulting in the amplification of the long wave. On 24/12 November 2009 (Figure 3(b)) the wind direction over North Africa was almost zonal and the maximum speed of the subtropical jet was 45 m/s and was located over northeastern Africa (Libya, Egypt, and the northern portion of the Red sea). The polar jet extended from northwest England to southeast Spain and north of Italy with a maximum wind greater than 60 m/s at 300 hpa; its extension at 200 hpa had a maximum wind greater than 50 m/s. As the polar jet streak moved southeastward, it continuously advected cold air southward. Consequently, in the following twenty-four hours, the baroclinicity ahead of the ridge increased and the jet streak moved southward. The synoptic situation at 300 hpa at 24/18 November and 25/00 November (Figures 4(c) and (d)) is particularly im- portant for the subsequent development. On 24/18 November, the subtropical jet moved slightly northeastward, i.e., over Egypt, and its maximum center became greater than 40 m/s at 300 and 200 hpa. At the same time, the polar jet moved southeastward to amalgamate with the subtropical jet, and its maximum value became greater than 60 m/s at 300 hpa. At 25/00 November, associated with relative vorticity maximum of s 1 at 500 hpa and s 1 at 300 hpa (not shown) and increased baroclinicity at these levels, the system became cut off at all isobaric levels. Ahead of and parallel to the polar jet stream, a frontal surface low located over Italy became very pronounced. When this type of atmospheric circulation dominates at the upper levels, intense surface cyclogenesis over the central Mediterranean is likely to be initiated, assuming favorable low level conditions [10]. On 25/06 November 2009, the subtropical jet shifted to the southeast. The polar front jet reached northern Algeria, and its maximum wind value was greater than 50 m/s at 300 and 200 hpa. The subtropical jet weakened at 300 hpa and became stronger at 200 hpa (>50 m/s) and moved eastward. The maximum amalgamation of the two jets occurred on 24/06 November Starting on 25/12 November and continuing to 26/00 November 2009, the polar jet became very weak at 300 hpa and its extension to 200 hpa disappeared. In addition, we noticed that the subtropical jet had moved eastward and was almost back to normal distribution in both speed and direction. 4.2 Initiation of the Surface Cyclogenesis Figure 5 shows the field of relative vorticity at 850 hpa during the period of study over the domain containing the area of interaction between the two air masses associated with the Sudan low and the traveling Mediterranean cyclone. It shows that the relative vorticity undergoes changes of magnitude, orientation, and horizontal extension from time to time. At 24/00 there is a cell of higher positive relative vorticity over the eastern Mediterranean that extends southward to cover eastern Egypt, the Red Sea and western Saudi Arabia. The center of the maximum value ( s 1 ) is located at (22.5 N, 37.5 E). During the next 6 hours the cell with higher positive relative vorticity moved south eastward and covered most of the Eastern Mediterranean, Egypt, the Red Sea, and the western portion of the Arabian Peninsula. By 24/18 the area the cell covered extended and moved eastward; the maximum values occurred over northwestern Saudi Arabia. During the next 6 hours the cell underwent a change in origination and magnitude. It had two centers with maximum values greater than s 1 ; the first was


6 A. K. AL-KHALAF, H. A. BASSET 155 Figure 3. Isotachs at 200 hpa greater than 20 m/s; Isotach interval is 5 m/s for 24/06-26/00 UTC November 2009.


")


7 156 A. K. AL-KHALAF, H. A. BASSET Figure hpa height contours in 40 m intervals (dotted) and contours of the jet streams (solid) greater than 20 m/s for 24/06-26/00 UTC November 2009.
 lines denote positive values, (dotted) lines denote negative values for 24/06-26/00 UTC November 2009.")

 located over northern Egypt (Figure 6(a)). After 6 hours, the center had moved southeastward.")
. Figure 6(e) shows that the cell of positive relative vorticity occupies a large area of the domain; however, the maximum increases to 4 10 5 s 1.")
8 A. K. AL-KHALAF, H. A. BASSET 157 Figure 5. Relative vorticity at 850 hpa; contour interval is s 1, (solid) lines denote positive values, (dotted) lines denote negative values for 24/06-26/00 UTC November over the Southeastern Mediterranean and the second was in the middle of the Red Sea, an area of heavy rainfall. In the following 6 hours the two centers combined and appeared over northeastern Saudi Arabia. In the last three times the values of the center of relative vorticity moved slowly in a northeasterly direction. Figure 6 shows the relative vorticity at 500 hpa during the period of interest. Attention is focused on the center of maximum relative vorticity ( s 1 ) located over northern Egypt (Figure 6(a)). After 6 hours, the center had moved southeastward. On 24/18 November, the center moved eastward and originated at (30 N, 37.5 E). By 25/00 November the maximum positive vorticity located at (30 N, 37.5 E) moved northeastwards and had a value of s 1 over (32.5 N, 39 E). Figure 6(e) shows that the cell of positive relative vorticity occupies a large area of the domain; however, the maximum increases to s 1. At the last three times the positive vorticity values continued to occupy the Eastern Mediterranean, Egypt, and the northern portion of the KSA. Figure 2(c) indicates that a synoptic-scale wave is present over Europe at the isobaric level of 700 hpa and the ridge-trough pattern shows a NE-SW tilt. The jet wind maximum is 65 m s 1 at 300 hpa (Figure 4(c)). The wind speed decreased along the jet stream axis from the west to the east side of the trough resulting in an increase of the mean absolute vorticity advection in its region [19]. Indeed, the left side region of the jet stream axis (polar jet) is characterized by positive advection of absolute vorticity, which was moving rapidly southwards. According to [20,21], this synoptic situation is a precursor to cyclonic development. In association with the absolute vorticity advection, the Eastern Mediterranean and western Saudi Arabia were covered by a field of ascending motion at the isobaric level of 700 hpa, with the strongest ascent of 0.2 Pa s 1 over western Saudi Arabia (Figure 7(c)). The positive relative vorticity had increased to s 1 over the Eastern Mediterranean by 25/00 November, while the entire Southeastern Mediterranean was characterized by positive absolute vorticity advection, implying the deepening of the upper trough. The maximum absolute vorticity advection, where the ascending motion becomes as high as 0.3 Pa s 1 at 700 hpa, was located in the middle of western Saudi Arabia (Figure 7(d)). The relative humidity at 700 hpa was more than 90%, as shown in Figure 8(d). According to the 1000 hpa analysis (Figure 1(d)), the low-pressure center had developed over this area by 25/00, as the frontal zone, under the maximum absolute vorticity advection, had moved to the same region (Figure 6(d)). It is noteworthy that the surface cyclogenesis over the Central and Eastern Mediterranean had intensified. The 300 hpa isotach analysis (Figure 4(d)) suggests that the


 lines denote")
 lines denote")


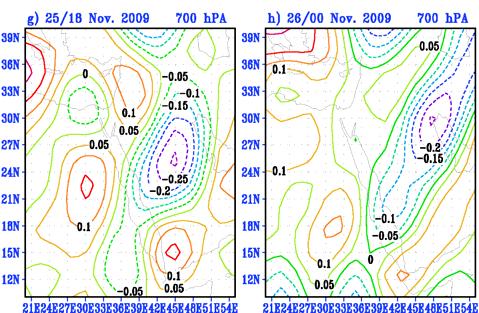
9 158 A. K. AL-KHALAF, H. A. BASSET Figure 6. Relative vorticity at 500 hpa; contour interval is s 1, (solid) lines denote positive values, (dotted) lines denote negative values for 24/06-26/00 UTC November Figure 7. Vertical motion at 700 hpa, contour interval is 0.1 Pa s 1, (solid) lines denote positive values, (dotted) lines denote negative values for 24/06-26/00 UTC November 2009.
).")
). The ascent pattern had drifted eastwards over the same region, peaking at 0.")


10 A. K. AL-KHALAF, H. A. BASSET 159 northerly polar frontal jet, curved cyclonically over the Central Mediterranean, tended to interact with the westerly subtropical jet that was propagated along the Libyan coast. By 25/06, as the orientation of the trough axis at 700 hpa changed from NE-SW to N-S, extensive cyclonic development is marked and the low center at 700 hpa tended to develop (Figure 2(d)). The surface lowpressure system became circularly organized and deepened between longitudes E, indicating a strong baroclinic atmospheric environment. The maximum value of relative vorticity is in excess of s 1 (Figure 6(d)). The ascent pattern had drifted eastwards over the same region, peaking at 0.3 Pa s 1 at 700 hpa ahead of the surface system (Figure 7(d)). A major factor allowing the surface low to convert available potential to kinetic energy is the advection of sinking cold air behind the low and the advection of ascending warm air ahead of the low. This is especially evident at the 700 hpa isobaric level (Figure 7(d)). In the last three hours the system moved eastward slowly and weakened gradually. 5. Potential Vorticity Analysis In order to highlight the dynamical significance of the most important features that the synoptic overview and the relative vorticity analysis revealed, and to identify other distinct characteristics of the development, a PV analysis was carried out. In particular, the horizontal distributions of isobaric PV at 300 and 850 hpa have been used to examine the upper and lower level development. Figure 8. Relative humidity at 700 hpa; contour interval is 10% for 24/06-26/00 UTC November Upper Level Development Figure 9 summarizes the evolution of the PV field at the 300 hpa level from 24/06 to 26/00 November Figure 9(a) displays an obvious anomaly of magnitude 2.2 PVU located north of Egypt (over the Eastern Mediterranean) that represents and accompanies the cyclone of interest. From Figure 9(b), it is evident that within 6 hours the PV maximum propagated slightly eastwards and its magnitude became 2 PVU. The important feature in Figure 9(b) is that the PV trough of the anomaly extended southwards up to northwestern Saudi Arabia in a NW-SE direction. On 24/18 November (Figure 9(c)), the main core of the PV trough was located over the Southeastern Mediterranean and coincided with the 700 hpa low-pressure center, which actually developed at the same time scale. An area of low PV values appeared ahead of the PV trough over eastern Saudi Arabia and the Red Sea. By 25/00 November, the PV trough propagates southeastwards involving advection on its southern edge, while the PV anomaly reached the maximum value of 2 PVU (Figure 9(d)). As well, also, it can be seen that the PV trough became more horizontally oriented at its southern edge. By 25/06 November, the extension of the


 The second is located over the southern part of the KSA. The second anomaly is associated with values of R.H. greater than 80% (Figure 8).")
, within 6 hours the second PV maximum propagated slightly westward and situated over western Saudi Arabia.")
11 160 A. K. AL-KHALAF, H. A. BASSET main tough had extended horizontally over northern Saudi Arabia and moved slowly eastwards. The PV gradients at its southern edge have increased significantly. On 25/12 November, the PV trough continued to extend latitudenally and the associated maximum moved northeastwards. As can be seen from Figures 9(g) and (f), the low becomes a stationary vortex rotating above the Northeastern Mediterranean and north of the KSA Lower Level Development Figure 10 presents the PV analysis at 700 hpa for the period from 24/06 to 26/00 November Figure 10(a) displays two distinct anomalies, all to the southeast of the upper level anomaly: 1) One, of magnitude 1.1 PVU, is located south of Egypt; 2) The second is located over the southern part of the KSA. The second anomaly is associated with values of R.H. greater than 80% (Figure 8). It should be noted that the first anomaly is the signature of the upper PV trough at the level of 700 hpa, which implies that this anomaly not connected to stratospheric air, but rather originated at low levels. According to Figure 10(b), within 6 hours the second PV maximum propagated slightly westward and situated over western Saudi Arabia. On the 24/18 November, when the low level wind pattern, associated with the surface development, indicated a rapid intensification of the northeasterly and southeasterly flow over western Saudi Arabia (Figure 10(c)), the second low level PV anomaly propagated further to the southwest. At 25/00, when the system indicated cut off at all the isobaric levels, the gradient of the PV anomaly increases generally northward. As the dynamic support from the upper levels decreased (Figure 10(d)), the low levels appear to play a more important role. It is interesting to note that the second maximum is associated with high values of relative humidity, up to 90% at 700 hpa, while the first maximum is associated with low values of R.H., less than 20%. The region containing the second maximum occurs in the area of ascending motion, while the region containing the first maximum occurs in the area of descending motion. The center of the anomaly located at (21 N, 45 E) moved slowly to the southwest. As shown in Figure 10(e), within 6 hours the PV maximum propagated in a southerly direction and reached the south of the center of Red Sea. At the end of the period the area of PV anomalies are associated with values of R.H. greater than 80%. Figure 9. Ertel s potential vorticity on 300 hpa; contour interval is 0.5 PVU for 24/06-26/00 UTC November PVU = 10 6 M 2 K Kg 1 s Divergent Wind Analysis It is possible to recover much of the observed divergence field through the iterative procedure used by [2]. Figures 11 and 12 illustrate the divergent horizontal wind at 1000 and 500 hpa for the period 24/06 to 26/00 November Figure 11 illustrates the regions of convergence and divergence at 1000 hpa in our domain of study throughout


12 A. K. AL-KHALAF, H. A. BASSET 161 Figure 10. Ertel s potential vorticity on 700 hpa greater than 0.4 PVU; contour interval is 0.1 PVU for 24/06-26/00 UTC November PVU = 10 6 M 2 K Kg 1 s 1. Figure 11. Irrotational winds at 1000 hpa for 24/06-26/00 UTC November 2009.
, there is a region of low level convergence associated with a cut-off low, which was")

 is continues throughout the period of study.")
.")
13 162 A. K. AL-KHALAF, H. A. BASSET the period 24/06 to 26/00 November The figure shows that, over southeastern Egypt and the western portion of the central Red Sea (20 N, 35 E), there is a region of low level convergence associated with a cut-off low, which was associated with the northwestward oscillation of the Red Sea trough. There is also a marked low level convergence over the Eastern Mediterranean. The central maximum values of convergence over the Red Sea and western Saudi Arabia are 1.5, 2.5, 1.5, and s 1 on 24/18, 25/00, 25/06, and 25/12 November, respectively. The second area of convergence stays over the Eastern Mediterranean from 24/06 and reaches maximum convergence at 25/06 November ( s 1 ). The first low level convergence (over the western portion of the middle of the Red Sea (i.e., southeast of Egypt) is continues throughout the period of study. The maximum values of convergence appears at 24/18-25/06 November, which is the period associated with the severe thunderstorm and rainfall over Jeddah. Figure 11 illustrates that during this period the convergence occurs between the southeast hot moist wind and the northwest cold moist wind (Figure 13). Throughout the period 25/ 12-26/00 November (which coincides with the beginning of the decay period) the low level convergence over the middle of the Red Sea shifted slightly southeastward and weakened gradually; its maximum values at these times were 2, 1.5, and s 1, respectively. Figure 12 shows the spatial pattern of the divergent wind fields at 500 hpa for the period 24/06 to 26/00 November It is clear that Figure 12 shows the inverse pattern of Figure 11; the areas of low level convergence and divergence at 1000 hpa are associated with areas of upper level divergence and convergence at 500 hpa. Figure 12. Irrotational winds at 500 hpa for 24/06-26/00 UTC November Conclusions The dynamics of a case of cyclogenesis that occurred on 25 November 2009, where Jeddah, Makkah, Rabigh, and other regions in Western Saudi Arabia were hit by heavy rainstorms has been investigated. The impact of the severe convective weather process caused more than 90 millimeters of rain to fall in Jeddah in just four hours. Our case study has been investigated in relation to two meteorological parameters: the isobaric absolute and relative vorticity, and the isobaric potential vorticity. On the whole, in this case the two approaches seem to identify the same features for surface cyclogenesis initiation. The first approach identified the interaction of a region of positive absolute vorticity advection ahead of a 500 hpa trough with a shallow frontal system. The second approach identified an isobaric PV anomaly at the upper levels with a low level baroclinic zone (again with a shallow frontal system). It is evident that both analyses imply the significance of the upper level dynamics in the

 An upper level cold trough in the Eastern Mediterranean moves from west to east, and a warm blocking high is situated over the southeastern portion of Saudi Arabia and the Arabian Sea; 2) An")


14 A. K. AL-KHALAF, H. A. BASSET 163 initiation of this case of cyclogenesis. The isobaric vorticity analysis appears to be an informative, accurate, and easy to use method for describing the upper-level dynamics. The most significant findings from the analysis of our case study are as follows. 1) An upper level cold trough in the Eastern Mediterranean moves from west to east, and a warm blocking high is situated over the southeastern portion of Saudi Arabia and the Arabian Sea; 2) An evident low level shear line set up in northwestern Jeddah and the southeast movement of the shear line caused dynamic lifting and unstable energy release over Jeddah; 3) The water vapor transport happened primarily below 700 hpa, and the low level jet transported water vapor from the Red Sea to central Saudi Arabia. Furthermore, the blocking high in southern Saudi Arabia is favorable for maintaining water vapor passage for a long time; 4) Topography also played a role in the enhancement of convection. Jeddah lies in the coastal plain of the Red Sea, bordered by the Hijaz plateau on the east. Figure 13. Irrotational winds at 500 hpa for 24/06-26/00 UTC November REFERENCES [1] B. J. Hoskins, M. E. McIntyre and A. W. Robertson, On the Use and Significance of Isentropic Potential Vorticity Maps, Quarter Journal of Meteorological Society, Vol. 111, No. 470, 1985, pp doi: /qj [2] C. A. Davis and K. A. Emanuel, Potential Vorticity Diagnostics of Cyclogenesis, Monthely Weather Review, Vol. 119, No. 8, 1991, pp doi: / (1991)119<1929:pvdoc>2.0.co ;2 [3] M. T. Stoelinga, A Potential Vorticity-Based Study of the Role of Diabatic Heating and Friction in a Numerically Simulated Baroclinic Cyclone, Monthely Weather Review, Vol. 121, No. 5, 1996, pp doi: / (1996)124<0849:apvbso>2.0.c O;2 [4] Z. Huo, D. L. Zhang and J. R. Gyakum, Interaction of Potential Vorticity Anomalies in Extratropical Cyclogenesis Part I: Static Piecewise Inversion, Monthely Weather Review, Vol. 127, No. 11, 1999, pp doi: / (1999)127<2546:iopvai>2.0.co ;2 [5] R. S. Plant, G. C. Craig and S. L. Gray, On a Threefold Classification of Extratropical Cyclogenesis, Quarter Journal of Meteorological Society, Vol. 129, No. 594, 2003, pp doi: /qj [6] A. Agusti-Panareda, C. D. Thorncroft, G. C. Craig and S. L. Gray, The Extratropical Transition of Hurricane Irene (1999): A Potential Vorticity, Quarter Journal of Meteorological Society, Vol. 130, No. 598, 2004, pp doi: /qj [7] F. Ahmadi-Givi, G. C. Craig and R. S. Plant, The Dynamics of a Midlatitude Cyclone with Very Strong Latent Heat Release, Quarter Journal of Meteorological Society, Vol. 130, No. 596, 2004, pp
15 164 A. K. AL-KHALAF, H. A. BASSET doi: /qj [8] H. A. Basset and A. Gahein, Diagnostic Study on the Relation between Ozone and Potential Vorticity, Atmosfera, Vol. 16, 2003, pp [9] H. Abdel Basset and A. M. Ali, Diagnostics of Cyclogenesis Using Potential Vorticity, Atmosfera, Vol. 19, No. 4, 2006, pp [10] N. G. Prezerakos, Formation of Sub-Synoptic-Scale Waves on the Eastern Flank of a Large Anticyclone at 500 Hpa Leading to Surface Cyclogenesis in the Greek Area on 5th October 1989, Report on the Fourth Session of the Steering Group on Mediterranean Cyclones Study Project, WMO, Geneva, 1992, pp [11] N. G. Prezerakos, H. A. Flocas and S. C. Michaelides, Absolute Vorticity Advection and Potential Vorticity of the Free Troposphere as a Synthetic Tool for the Diagnosis and Forecasting of Cyclogenesis, Atmosphere-Ocean, Vol. 35, No. 1, 1997, pp [12] N. G. Prezerakos, A. H. Flocas and S. C. Michaelides, Upper-Tropospheric Downstream Development Leading to Surface Cyclogenesis in the Central Mediterranean, Applied Meteorology, Vol. 6, No. 4, 1999, pp doi: /s [13] T. S. Karacostas and A. A. Flocas, The Development of the Bomb over the Mediterranean Area, La Meteorologie, Vol. 34, 1983, pp [14] A. A. Flocas and T. S. Karacostas, Cyclogenesis over the Aegean Sea: Identification and Synoptic Categories, Applied Meteorology, Vol. 33, 1996, pp [15] H. R. Pomroy and A. J. Thorpe, The Evolution and Dynamical Role of Reduced Upper-Tropospheric Potential Vorticity in Intensive Observing Period One of FAS- TEX, Monthely Weather Review, Vol. 128, No. 6, 2000, pp doi: / (2000)128<1817:teadro>2.0.c O;2 [16] WMO, Atmospheric Ozone, Vol. I, No. 16, WMO, Geneva, [17] T. N. Krishnamurti and L. Bounoua, An Introduction to Numerical Weather Prediction Techniques, Academic Press, Waltham, [18] A. D. Karein, The Forecasting of Cyclogenesis in the Mediterranean Region, Ph.D. Thesis, University of Edinburgh, Scotland, [19] E. Palmen and C. Newton, Atmospheric Circulation Systems: Their Structure and Physical Interpretation, Academic Press, New York and London, [20] S. Petterssen, Weather Analysis and Forecasting, 2nd Edition, Mc Graw-Hill Book Company, New York, [21] M. Kurz, The Role of Diagnostic Tools in Modern Weather Forecasting, Applied Meteorology, Vol. 1, 1994, pp
Energy Budget of a Mediterranean system affecting the weather of Saudi Arabia. A. K AL-Khalaf
 1 Energy Budget of a Mediterranean system affecting the weather of Saudi Arabia A. K AL-Khalaf Department of Meteorology, Faculty of Meteorology, Environment, and Arid Land Agriculture, King Abdulaziz
10B.2 THE ROLE OF THE OCCLUSION PROCESS IN THE EXTRATROPICAL-TO-TROPICAL TRANSITION OF ATLANTIC HURRICANE KAREN
 10B.2 THE ROLE OF THE OCCLUSION PROCESS IN THE EXTRATROPICAL-TO-TROPICAL TRANSITION OF ATLANTIC HURRICANE KAREN Andrew L. Hulme* and Jonathan E. Martin University of Wisconsin-Madison, Madison, Wisconsin
1. INTRODUCTION: 2. DATA AND METHODOLOGY:
 27th Conference on Hurricanes and Tropical Meteorology, 24-28 April 2006, Monterey, CA 3A.4 SUPERTYPHOON DALE (1996): A REMARKABLE STORM FROM BIRTH THROUGH EXTRATROPICAL TRANSITION TO EXPLOSIVE REINTENSIFICATION
Vertical structure. To conclude, we will review the critical factors invloved in the development of extratropical storms.
 Vertical structure Now we will examine the vertical structure of the intense baroclinic wave using three visualization tools: Upper level charts at selected pressure levels Vertical soundings for selected
A SEVERE WEATHER EVENT IN ROMANIA DUE TO MEDITERRANEAN CYCLONIC ACTIVITY
 A SEVERE WEATHER EVENT IN ROMANIA DUE TO MEDITERRANEAN CYCLONIC ACTIVITY Florinela Georgescu, Gabriela Bancila, Viorica Dima National Meteorological Administration, Bucharest, Romania Abstract Mediterranean
and 24 mm, hPa lapse rates between 3 and 4 K km 1, lifted index values
 3.2 Composite analysis 3.2.1 Pure gradient composites The composite initial NE report in the pure gradient northwest composite (N = 32) occurs where the mean sea level pressure (MSLP) gradient is strongest
Examples of Pressure Gradient. Pressure Gradient Force. Chapter 7: Forces and Force Balances. Forces that Affect Atmospheric Motion 2/2/2015
 Chapter 7: Forces and Force Balances Forces that Affect Atmospheric Motion Fundamental force - Apparent force - Pressure gradient force Gravitational force Frictional force Centrifugal force Forces that
Synoptic Meteorology II: Self-Development in the IPV Framework. 5-7 May 2015
 Synoptic Meteorology II: Self-Development in the IPV Framework 5-7 May 2015 Readings: Section 5.3.6 of Midlatitude Synoptic Meteorology. Introduction In this and other recent lectures, we have developed
Synoptic Meteorology
 M.Sc. in Meteorology Synoptic Meteorology [MAPH P312] Prof Peter Lynch Second Semester, 2004 2005 Seminar Room Dept. of Maths. Physics, UCD, Belfield. Part 9 Extratropical Weather Systems These lectures
Multiscale Analyses of Inland Tropical Cyclone Midlatitude Jet Interactions: Camille (1969) and Danny (1997)
 and Danny (1997)") Multiscale Analyses of Inland Tropical Cyclone Midlatitude Jet Interactions: Camille (1969) and Danny (1997) Matthew Potter, Lance Bosart, and Daniel Keyser Department of Atmospheric and Environmental
Multiscale Analyses of Inland Tropical Cyclone Midlatitude Jet Interactions: Camille (1969) and Danny (1997) Matthew Potter, Lance Bosart, and Daniel Keyser Department of Atmospheric and Environmental
4/29/2011. Mid-latitude cyclones form along a
 Chapter 10: Cyclones: East of the Rocky Mountain Extratropical Cyclones Environment prior to the development of the Cyclone Initial Development of the Extratropical Cyclone Early Weather Along the Fronts
A Cyclogenesis south of the Alps. Manfred Kurz Neustadt/Weinstraße
 A Cyclogenesis south of the Alps Manfred Kurz Neustadt/Weinstraße A cyclogenesis south of the Alps Surface maps 06-11-99, 00 UTC The occluded frontal system of a quasi-stationary low above the North Sea
Fronts in November 1998 Storm
 Fronts in November 1998 Storm Much of the significant weather observed in association with extratropical storms tends to be concentrated within narrow bands called frontal zones. Fronts in November 1998
Synoptic Meteorology II: Petterssen-Sutcliffe Development Theory Application March 2015
 Synoptic Meteorology II: Petterssen-Sutcliffe Development Theory Application 10-12 March 2015 In our lecture on Petterssen-Sutcliffe Development Theory, we outlined the principle of selfdevelopment in
Upper-tropospheric downstream development leading to surface cyclogenesis in the central Mediterranean
 Meteorol. Appl. 6, 33 3 (999) Upper-tropospheric downstream development leading to surface cyclogenesis in the central Mediterranean Nicholas G Prezerakos, Helena A Flocas and Silas C Michaelides 3 General
Interaction of Potential Vorticity Anomalies in Extratropical Cyclogenesis. Part I: Static Piecewise Inversion
 2546 MONTHLY WEATHER REVIEW VOLUME 127 Interaction of Potential Vorticity Anomalies in Extratropical Cyclogenesis. Part I: Static Piecewise Inversion ZONGHUI HUO CMRP, School of Meteorology, University
Numerical Simulation of a Severe Cold and Rainy Event over the East Mediterranean
 JKAU: Met., Env. & Arid Land Agric. Sci., Vol. 20, No. 2, pp: 95-109 (2009 A.D. / 1430 A.H.) Numerical Simulation of a Severe Cold and Rainy Event over the East Mediterranean Department of Meteorology,
Lower-Tropospheric Height Tendencies Associated with the Shearwise and Transverse Components of Quasigeostrophic Vertical Motion
 JULY 2007 N O T E S A N D C O R R E S P O N D E N C E 2803 Lower-Tropospheric Height Tendencies Associated with the Shearwise and Transverse Components of Quasigeostrophic Vertical Motion JONATHAN E. MARTIN
Final Examination, MEA 443 Fall 2008, Lackmann
 Place an X here to count it double! Name: Final Examination, MEA 443 Fall 2008, Lackmann If you wish to have the final exam count double and replace your midterm score, place an X in the box above. As
Observation Homework Due 11/24. Previous Lecture. Midlatitude Cyclones
 Lecture 21 Midlatitude Cyclones Observation Homework Due 11/24 1 2 Midlatitude Cyclones Midlatitude Cyclone or Winter Storm Cyclogenesis Energy Source Life Cycle Air Streams Vertical Structure Storm Hazards
MET 3502 Synoptic Meteorology. Lecture 8: September 16, AIRMASSES, FRONTS and FRONTAL ANALYSIS (2)
") MET 3502 Synoptic Meteorology Lecture 8: September 16, 2010 AIRMASSES, FRONTS and FRONTAL ANALYSIS (2) Identifying a cold front on a surface weather map: 1. Surface front is located at the leading edge
MET 3502 Synoptic Meteorology Lecture 8: September 16, 2010 AIRMASSES, FRONTS and FRONTAL ANALYSIS (2) Identifying a cold front on a surface weather map: 1. Surface front is located at the leading edge
Middle Latitude Cyclones a storm that forms at middle and high latitudes, outside of the tropics.
 Middle Latitude Cyclones a storm that forms at middle and high latitudes, outside of the tropics. Polar Front Theory a theory that explains the life cycle of mid latitude cyclones and their associated
The Planetary Circulation System
 12 The Planetary Circulation System Learning Goals After studying this chapter, students should be able to: 1. describe and account for the global patterns of pressure, wind patterns and ocean currents
A polar low named Vera: the use of potential vorticity diagnostics to assess its development
 Quarterly Journal of the Royal Meteorological Society Q. J. R. Meteorol. Soc. 137: 179 183, October 11 A A polar low named Vera: the use of potential vorticity diagnostics to assess its development Thor
 http://www.ssec.wisc.edu/data/composites.html Red curve: Incoming solar radiation Blue curve: Outgoing infrared radiation. Three-cell model of general circulation Mid-latitudes: 30 to 60 latitude MID-LATITUDES
Divergence, Spin, and Tilt. Convergence and Divergence. Midlatitude Cyclones. Large-Scale Setting
 Midlatitude Cyclones Equator-to-pole temperature gradient tilts pressure surfaces and produces westerly jets in midlatitudes Waves in the jet induce divergence and convergence aloft, leading to surface
Chapter 10: Mid-latitude Cyclones Mid-Latitude Cyclones
 Chapter 10: Mid-latitude Cyclones Mid-Latitude Cyclones Mid-latitude cyclones form along a boundary separating polar air from warmer air to the south. Life Cycle of Cyclone Cyclone Structures Steering
Chapter 10: Mid-latitude Cyclones
 Chapter 10: Mid-latitude Cyclones Life Cycle of Cyclone Cyclone Structures Steering of Cyclone Mid-Latitude Cyclones Mid-latitude cyclones form along a boundary separating polar air from warmer air to
Synoptic Meteorology II: Frontogenesis Examples Figure 1
 Synoptic Meteorology II: Frontogenesis Examples The below images, taken from the 1200 UTC 17 January 2019 GFS forecast run, provide examples of the contributions of deformation and divergence to frontogenesis.
1. Which weather map symbol is associated with extremely low air pressure? A) B) C) D) 2. The diagram below represents a weather instrument.
 B) C) D) 2. The diagram below represents a weather instrument.") 1. Which weather map symbol is associated with extremely low air pressure? 2. The diagram below represents a weather instrument. Which weather variable was this instrument designed to measure? A) air pressure
1. Which weather map symbol is associated with extremely low air pressure? 2. The diagram below represents a weather instrument. Which weather variable was this instrument designed to measure? A) air pressure
Low-level Jet(LLJ) and western Iran heavy rain: case study Dec 1991
 and western Iran heavy rain: case study Dec 1991") 2011 2nd International Conference on Environmental Science and Technology IPCBEE vol.6 (2011) (2011) IACSIT Press, Singapore Low-level Jet(LLJ) and western Iran heavy rain: case study Dec 1991 Elham Mobarak
2011 2nd International Conference on Environmental Science and Technology IPCBEE vol.6 (2011) (2011) IACSIT Press, Singapore Low-level Jet(LLJ) and western Iran heavy rain: case study Dec 1991 Elham Mobarak
Synoptic-Dynamic Meteorology in Midlatitudes
 Synoptic-Dynamic Meteorology in Midlatitudes VOLUME II Observations and Theory of Weather Systems HOWARD B. BLUESTEIN New York Oxford OXFORD UNIVERSITY PRESS 1993 Contents 1. THE BEHAVIOR OF SYNOPTIC-SCALE,
Characteristic blocking events over Ural-Siberia in Boreal Winter under Present and Future Climate Conditions
 Characteristic blocking events over Ural-Siberia in Boreal Winter under Present and Future Climate Conditions Wen Zhou & Hoffman Cheung Guy Carpenter Asia-Pacific Climate Impact Center School of Energy
Department of Atmospheric Sciences, National Taiwan University, Taipei, Taiwan
 10A.4 TROPICAL CYCLONE FORMATIONS IN THE SOUTH CHINA SEA CHENG-SHANG LEE 1 AND YUNG-LAN LIN* 1, 2 1 Department of Atmospheric Sciences, National Taiwan University, Taipei, Taiwan 2 Taipei Aeronautic Meteorological
Fixed Rossby Waves: Quasigeostrophic Explanations and Conservation of Potential Vorticity
 Fixed Rossby Waves: Quasigeostrophic Explanations and Conservation of Potential Vorticity 1. Observed Planetary Wave Patterns After upper air observations became routine, it became easy to produce contour
1. COLD FRONT - CLOUD STRUCTURE IN SATELLITE IMAGES
 1. COLD FRONT - CLOUD STRUCTURE IN SATELLITE IMAGES The satellite image shows a cyclonically curved synoptic scale cloud band usually a few hundred kilometres wide; in the VIS image the cloud band mostly
Early May Cut-off low and Mid-Atlantic rains
 Abstract: Early May Cut-off low and Mid-Atlantic rains By Richard H. Grumm National Weather Service State College, PA A deep 500 hpa cutoff developed in the southern Plains on 3 May 2013. It produced a
Mid-Latitude Cyclones and Fronts. Lecture 12 AOS 101
 Mid-Latitude Cyclones and Fronts Lecture 12 AOS 101 Homework 4 COLDEST TEMPS GEOSTROPHIC BALANCE Homework 4 FASTEST WINDS L Consider an air parcel rising through the atmosphere The parcel expands as it
3. Midlatitude Storm Tracks and the North Atlantic Oscillation
 3. Midlatitude Storm Tracks and the North Atlantic Oscillation Copyright 2006 Emily Shuckburgh, University of Cambridge. Not to be quoted or reproduced without permission. EFS 3/1 Review of key results
Revisiting the Structure and Characteristics of an Early Summer Monsoon Trough over South China in 1975
 194 SOLA, 2014, Vol. 10, 194 198, doi:10.2151/sola.2014-041 Revisiting the Structure and Characteristics of an Early Summer Monsoon Trough over South China in 1975 Feng Hsiao and Yi-Leng Chen University
The North Atlantic Oscillation: Climatic Significance and Environmental Impact
 1 The North Atlantic Oscillation: Climatic Significance and Environmental Impact James W. Hurrell National Center for Atmospheric Research Climate and Global Dynamics Division, Climate Analysis Section
Quasi-Geostrophic Implications
 Chapter 10 Quasi-Geostrophic Implications When you look at a weather chart with all its isolines and plotted data, you need a framework upon which to interpret what you see. Quasi-geostrophic theory provides
Tropical Cyclone Formation/Structure/Motion Studies
 Tropical Cyclone Formation/Structure/Motion Studies Patrick A. Harr Department of Meteorology Naval Postgraduate School Monterey, CA 93943-5114 phone: (831) 656-3787 fax: (831) 656-3061 email: paharr@nps.edu
The feature of atmospheric circulation in the extremely warm winter 2006/2007
 The feature of atmospheric circulation in the extremely warm winter 2006/2007 Hiroshi Hasegawa 1, Yayoi Harada 1, Hiroshi Nakamigawa 1, Atsushi Goto 1 1 Climate Prediction Division, Japan Meteorological
TC Danny formed as a tropical depression in the northern Gulf of Mexico at 1200
 4. TC Danny Multiscale Analysis 4.1. Introduction 4.1.1. TC Track TC Danny formed as a tropical depression in the northern Gulf of Mexico at 1200 UTC 16 July 1997 and then slowly moved toward the northeast
ESCI 344 Tropical Meteorology Lesson 8 Tropical Weather Systems
 ESCI 344 Tropical Meteorology Lesson 8 Tropical Weather Systems References: Tropical Climatology (2 nd Ed.), McGregor and Nieuwolt Climate and Weather in the Tropics, Riehl Climate Dynamics of the Tropics,
Diabatic processes and the structure of extratropical cyclones
 Geophysical and Nonlinear Fluid Dynamics Seminar AOPP, Oxford, 23 October 2012 Diabatic processes and the structure of extratropical cyclones Oscar Martínez-Alvarado R. Plant, J. Chagnon, S. Gray, J. Methven
Occlusion cyclogenesis II
 Occlusion cyclogenesis II Upper level influences on cyclogenesis Vorticity Advection (CVA) and the 4-quadrant jet streak model (Uccellini) Potential Vorticity (PV) (Hoskins Theory) Rapid cyclogenesis 14
Northeastern United States Snowstorm of 9 February 2017
 Northeastern United States Snowstorm of 9 February 2017 By Richard H. Grumm and Charles Ross National Weather Service State College, PA 1. Overview A strong shortwave produced a stripe of precipitation
Dynamics of the Atmosphere. Large-scale flow with rotation and stratification
 12.810 Dynamics of the Atmosphere Large-scale flow with rotation and stratification Visualization of meandering jet stream Upper level winds from June 10th to July 8th 1988 from MERRA Red shows faster
ESCI 241 Meteorology Lesson 19 Tropical Cyclones Dr. DeCaria
 ESCI 241 Meteorology Lesson 19 Tropical Cyclones Dr. DeCaria READING: Chapter 16 GENERAL A tropical cyclone is a large, low-pressure system that forms over the tropical oceans. Tropical cyclones are classified
EasyChair Preprint. Sotirios Tsiougkos and Dimitrios Brikas. November 9, 2018
 EasyChair Preprint 616 Calculation of dynamic and thermodynamic parameters from spatial data of high spatial resolution of a weather event s specific case study event that occurred on the 16th and 17th
11B.1 INFLUENCE OF DIABATIC POTENTIAL VORTICITY ANOMALIES UPON WARM CONVEYOR BELT FLOW. PART I: FEBRUARY 2003
 INFLUENCE OF DIABATIC POTENTIAL VORTICITY ANOMALIES UPON WARM CONVEYOR BELT FLOW. PART I: 14-15 FEBRUARY 2003 Philip N. Schumacher, NOAA/NWS, Sioux Falls, SD Joshua M. Boustead, NOAA/NWS, Valley, NE Martin
Lec 10: Interpreting Weather Maps
 Lec 10: Interpreting Weather Maps Case Study: October 2011 Nor easter FIU MET 3502 Synoptic Hurricane Forecasts Genesis: on large scale weather maps or satellite images, look for tropical waves (Africa
The Impact of air-sea interaction on the extratropical transition of tropical cyclones
 The Impact of air-sea interaction on the extratropical transition of tropical cyclones Sarah Jones Institut für Meteorologie und Klimaforschung Universität Karlsruhe / Forschungszentrum Karlsruhe 1. Introduction
A Diagnostic Study of a Retreating Mei-Yu Front and the Accompanying Low-Level Jet Formation and Intensification
 874 M O N T H L Y W E A T H E R R E V I E W VOLUME 134 A Diagnostic Study of a Retreating Mei-Yu Front and the Accompanying Low-Level Jet Formation and Intensification GEORGE TAI-JEN CHEN Department of
Global Atmospheric Circulation
 Global Atmospheric Circulation Polar Climatology & Climate Variability Lecture 11 Nov. 22, 2010 Global Atmospheric Circulation Global Atmospheric Circulation Global Atmospheric Circulation The Polar Vortex
Numerical Prediction of the Heavy Rainfall Vortex Over Eastern Asia Monsoon Region
 730 Journal of the Meteorological Society of Japan Vol. 62, No. 5 Numerical Prediction of the Heavy Rainfall Vortex Over Eastern Asia Monsoon Region By Shou-Jun Chen* and Lorenzo Dell'Osso European Centre
5D.6 EASTERLY WAVE STRUCTURAL EVOLUTION OVER WEST AFRICA AND THE EAST ATLANTIC 1. INTRODUCTION 2. COMPOSITE GENERATION
 5D.6 EASTERLY WAVE STRUCTURAL EVOLUTION OVER WEST AFRICA AND THE EAST ATLANTIC Matthew A. Janiga* University at Albany, Albany, NY 1. INTRODUCTION African easterly waves (AEWs) are synoptic-scale disturbances
The October 2015 Supercell Storm in Israel
 The October 2015 Supercell Storm in Israel Alissa Razy, Elyakom Vadislavsky, Anat Baharad, Noam Halfon, Itsik Carmona, Yoav Levi, Amit Savir Introduction A high-impact weather event associated with severe
Diabatic processes and the structure of the warm conveyor belt
 2 nd European Windstorm Workshop Leeds, 3-4 September 2012 Diabatic processes and the structure of the warm conveyor belt Oscar Martínez-Alvarado J. Chagnon, S. Gray, R. Plant, J. Methven Department of
Meteorology Lecture 15
 Meteorology Lecture 15 Robert Fovell rfovell@albany.edu 1 Important notes These slides show some figures and videos prepared by Robert G. Fovell (RGF) for his Meteorology course, published by The Great
Air Masses of North America cp and ca air masses Air mass characterized by very cold and dry conditions
 Chapter 8: Air Masses, Fronts, and Middle-Latitude Cyclones Air masses Fronts Middle-latitude cyclones Air Masses Air mass an extremely large body of air whose properties of temperature and humidity are
Wind: Global Systems Chapter 10
 Wind: Global Systems Chapter 10 General Circulation of the Atmosphere General circulation of the atmosphere describes average wind patterns and is useful for understanding climate Over the earth, incoming
True or false: The atmosphere is always in hydrostatic balance. A. True B. False
 Clicker Questions and Clicker Quizzes Clicker Questions Chapter 7 Of the four forces that affect the motion of air in our atmosphere, which is to thank for opposing the vertical pressure gradient force
Isentropic Analysis. Much of this presentation is due to Jim Moore, SLU
 Isentropic Analysis Much of this presentation is due to Jim Moore, SLU Utility of Isentropic Analysis Diagnose and visualize vertical motion - through advection of pressure and system-relative flow Depict
Chapter 9: Weather Patterns
 Chapter 9: Weather Patterns Mid Latitude Cyclones: extratropical cyclones, Nor easters Region southern FL to Alaska Lifecycle and associated weather Regional Influence Polar Front Theory: -Norwegian Cyclone
Introduction of climate monitoring and analysis products for one-month forecast
 Introduction of climate monitoring and analysis products for one-month forecast TCC Training Seminar on One-month Forecast on 13 November 2018 10:30 11:00 1 Typical flow of making one-month forecast Observed
THE EXTRATROPICAL TRANSITION OF TYPHOON WINNIE (1997): SELF-AMPLIFICATION AFTER LANDFALL
: SELF-AMPLIFICATION AFTER LANDFALL") THE EXTRATROPICAL TRANSITION OF TYPHOON WINNIE (1997): SELF-AMPLIFICATION AFTER LANDFALL Chih-Shin Liu *1,2 and George Tai-Jen Chen 2 1 Weather Forecast Center, Central Weather Bureau, 2 Department of
THE EXTRATROPICAL TRANSITION OF TYPHOON WINNIE (1997): SELF-AMPLIFICATION AFTER LANDFALL Chih-Shin Liu *1,2 and George Tai-Jen Chen 2 1 Weather Forecast Center, Central Weather Bureau, 2 Department of
Chapter 5. Summary and Conclusions
 Chapter 5. Summary and Conclusions Two cases of heavy rainfall were analyzed using observational data sets and model simulations. The first case was the landfall of Hurricane Floyd in North Carolina in
This is a refereed journal and all articles are professionally screened and reviewed
 Advances in Environmental Biology, 5(10): 3425-3433, 2011 ISSN 1995-0756 3425 This is a refereed journal and all articles are professionally screened and reviewed ORIGINAL ARTICLE The Divergence Field
CPTEC and NCEP Model Forecast Drift and South America during the Southern Hemisphere Summer
 CPTEC and NCEP Model Forecast Drift and South America during the Southern Hemisphere Summer José Antonio Aravéquia 1 Pedro L. Silva Dias 2 (1) Center for Weather Forecasting and Climate Research National
Boundary layer controls on extratropical cyclone development
 Boundary layer controls on extratropical cyclone development R. S. Plant (With thanks to: I. A. Boutle and S. E. Belcher) 28th May 2010 University of East Anglia Outline Introduction and background Baroclinic
Winds and Global Circulation
 Winds and Global Circulation Atmospheric Pressure Winds Global Wind and Pressure Patterns Oceans and Ocean Currents El Nino How is Energy Transported to its escape zones? Both atmospheric and ocean transport
SPATIAL DISTRIBUTION OF SOME DYNAMIC PARAMETERS DURING THE EVOLUTION OF SELECTED DEPRESSIONS OVER THE AREA OF CYPRUS
 INTERNATIONAL JOURNAL OF CLIMATOLOGY Int. J. Climatol. 24: 1829 1844 (04) Published online in Wiley InterScience (www.interscience.wiley.com). DOI: 10.1002/joc.1105 SPATIAL DISTRIBUTION OF SOME DYNAMIC
CONVERGENCE, DIVERGENCE, AND VORTICITY
 CHAPTER 1 CONVERGENCE, DIVERGENCE, AND VORTICITY In your reading of the AG2 manual, volume 1, you became familiar with the terms convergence, divergence, and vorticity when used in relation to surface
Introduction of products for Climate System Monitoring
 Introduction of products for Climate System Monitoring 1 Typical flow of making one month forecast Textbook P.66 Observed data Atmospheric and Oceanic conditions Analysis Numerical model Ensemble forecast
Transient and Eddy. Transient/Eddy Flux. Flux Components. Lecture 3: Weather/Disturbance. Transient: deviations from time mean Time Mean
 Lecture 3: Weather/Disturbance Transients and Eddies Climate Roles Mid-Latitude Cyclones Tropical Hurricanes Mid-Ocean Eddies Transient and Eddy Transient: deviations from time mean Time Mean Eddy: deviations
Tropical Waves. John Cangialosi and Lixion Avila National Hurricane Center. WMO Region IV Tropical Cyclone Workshop
 Tropical Waves John Cangialosi and Lixion Avila National Hurricane Center WMO Region IV Tropical Cyclone Workshop Outline Basic definition Schematic diagrams/interactions Operational products/forecasts
Summary of High Wind Event of 7 March 2004
 Summary of High Wind Event of 7 March 2004 This event was characterized by a very strong jet streak that developed over North Carolina by 00 UTC 8 March, as seen in the Eta model analysis at 300 mb, with
Summary of November Central U.S. Winter Storm By Christopher Hedge
 Summary of November 12-13 2010 Central U.S. Winter Storm By Christopher Hedge Event Overview The first significant snowfall of the 2010-2011 season affected portions of the plains and upper Mississippi
1.4 CONNECTIONS BETWEEN PV INTRUSIONS AND TROPICAL CONVECTION. Beatriz M. Funatsu* and Darryn Waugh The Johns Hopkins University, Baltimore, MD
 1.4 CONNECTIONS BETWEEN PV INTRUSIONS AND TROPICAL CONVECTION Beatriz M. Funatsu* and Darryn Waugh The Johns Hopkins University, Baltimore, MD 1. INTRODUCTION Stratospheric intrusions into the tropical
General Circulation. Nili Harnik DEES, Lamont-Doherty Earth Observatory
 General Circulation Nili Harnik DEES, Lamont-Doherty Earth Observatory nili@ldeo.columbia.edu Latitudinal Radiation Imbalance The annual mean, averaged around latitude circles, of the balance between the
The Atmospheric Circulation
 The Atmospheric Circulation Vertical structure of the Atmosphere http://www.uwsp.edu/geo/faculty/ritter/geog101/textbook/atmosphere/atmospheric_structure.html The global heat engine [courtesy Kevin Trenberth,
TROPICAL CYCLONE TC 03A FOR THE PERIOD 3 RD JUNE TO 10 TH JUNE, 1998
 TROPICAL CYCLONE TC 03A FOR THE PERIOD 3 RD JUNE TO 10 TH JUNE, 1998 Hazrat Mir, Abdul Rashid, Waqarul Wheed Khan. Introduction: This report gives the review of cyclonic storm formed over the East Arabian
Winter Storm of 15 December 2005 By Richard H. Grumm National Weather Service Office State College, PA 16803
 Winter Storm of 15 December 2005 By Richard H. Grumm National Weather Service Office State College, PA 16803 1. INTRODUCTION A complex winter storm brought snow, sleet, and freezing rain to central Pennsylvania.
5 Atmospheric Disturbances 7 1.Cyclones- tropical and temperate and associated weather conditions. 2.Anticyclones and associated weather conditions.
 5 Atmospheric Disturbances 7 1.Cyclones- tropical and temperate and associated weather conditions. 2.Anticyclones and associated weather conditions. atmospheric disturbances (weather systems) that are
AIR MASSES SOURCE REGION CHARACTERISTICS Continental Arctic (ca) Greenland, Antarctica, Highest latitudes of Asia and North America
 Greenland, Antarctica, Highest latitudes of Asia and North America") GEOGRAPHY CLIMATOLOGY AIRMASS, FRONT AND TEMPERATE CYCLONE AIRMASS A large body of air having little horizontal variation in temperature and moisture is called an airmass. Airmass acquires its properties
GEOGRAPHY CLIMATOLOGY AIRMASS, FRONT AND TEMPERATE CYCLONE AIRMASS A large body of air having little horizontal variation in temperature and moisture is called an airmass. Airmass acquires its properties
Measurement of Rotation. Circulation. Example. Lecture 4: Circulation and Vorticity 1/31/2017
 Lecture 4: Circulation and Vorticity Measurement of Rotation Circulation Bjerknes Circulation Theorem Vorticity Potential Vorticity Conservation of Potential Vorticity Circulation and vorticity are the
Subtropical and Hybrid Systems IWTC VII Topic 1.6
 Subtropical and Hybrid Systems IWTC VII Topic 1.6 John R. Gyakum Department of Atmospheric and Oceanic Sciences McGill University, Montreal Canada Working group: John L. Beven II, Lance F. Bosart, Fermin
Chapter 24. Tropical Cyclones. Tropical Cyclone Classification 4/19/17
 Chapter 24 Tropical Cyclones Tropical Cyclones Most destructive storms on the planet Originate over tropical waters, but their paths often take them over land and into midlatitudes Names Hurricane (Atlantic
Mesoscale Atmospheric Systems. Surface fronts and frontogenesis. 06 March 2018 Heini Wernli. 06 March 2018 H. Wernli 1
 Mesoscale Atmospheric Systems Surface fronts and frontogenesis 06 March 2018 Heini Wernli 06 March 2018 H. Wernli 1 Temperature (degc) Frontal passage in Mainz on 26 March 2010 06 March 2018 H. Wernli
Name SOLUTIONS T.A./Section Atmospheric Science 101 Homework #6 Due Thursday, May 30 th (in class)
") Name SOLUTIONS T.A./Section Atmospheric Science 101 Homework #6 Due Thursday, May 30 th (in class) 1. General Circulation Briefly describe where each of the following features is found in the earth s general
Name SOLUTIONS T.A./Section Atmospheric Science 101 Homework #6 Due Thursday, May 30 th (in class) 1. General Circulation Briefly describe where each of the following features is found in the earth s general
Science Olympiad Meteorology Quiz #2 Page 1 of 8
 1) The prevailing general direction of the jet stream is from west to east in the northern hemisphere: 2) Advection is the vertical movement of an air mass from one location to another: 3) Thunderstorms
Impacts of the April 2013 Mean trough over central North America
 Impacts of the April 2013 Mean trough over central North America By Richard H. Grumm National Weather Service State College, PA Abstract: The mean 500 hpa flow over North America featured a trough over
Features of the wind fields associated with Typhoon 0418 (Songda) compared with those of Typhoon 9119 (Mireille)
 compared with those of Typhoon 9119 (Mireille)") Features of the wind fields associated with Typhoon 0418 (Songda) compared with those of Typhoon 9119 (Mireille) by Fumiaki Fujibe 1, Naoko Kitabatake 2, Kotaro Bessho 2 and Shunsuke Hoshino 3 ABSTRACT
Features of the wind fields associated with Typhoon 0418 (Songda) compared with those of Typhoon 9119 (Mireille) by Fumiaki Fujibe 1, Naoko Kitabatake 2, Kotaro Bessho 2 and Shunsuke Hoshino 3 ABSTRACT
Weather, Air Masses, Fronts and Global Wind Patterns. Meteorology
 Weather, Air Masses, Fronts and Global Wind Patterns Meteorology Weather is what conditions of the atmosphere are over a short period of time. Climate is how the atmosphere "behaves" over long periods
CHAPTER 9 ATMOSPHERE S PLANETARY CIRCULATION MULTIPLE CHOICE QUESTIONS
 CHAPTER 9 ATMOSPHERE S PLANETARY CIRCULATION MULTIPLE CHOICE QUESTIONS 1. Viewed from above in the Northern Hemisphere, surface winds about a subtropical high blow a. clockwise and inward. b. counterclockwise.
The downstream impact of tropical cyclones on a developing baroclinic wave in idealized scenarios of extratropical transition
 Quarterly Journal of the Royal Meteorological Society Q. J. R. Meteorol. Soc. 136: 617 637, April 2010 Part A The downstream impact of tropical cyclones on a developing baroclinic wave in idealized scenarios
- tornadoes. Further Reading: Chapter 08 of the text book. Outline. - cyclones and anti-cyclones. -tropical storms. -Storm surge
 (1 of 16) Further Reading: Chapter 08 of the text book Outline - cyclones and anti-cyclones - tornadoes -tropical storms -Storm surge (2 of 16) Introduction Previously, We talked about fronts and their