Surface Water. Chapter 2. Water Year Data Summary, photo by John Hoxmeier. photo by Michele Hanson. photo by Michele Hanson
|
|
|
- Dina Reed
- 5 years ago
- Views:
Transcription


1 Water Year Data Summary, Surface Water photo by Michele Hanson photo by Michele Hanson photo by John Hoxmeier photo by Judy Boudreau Chapter 2 16


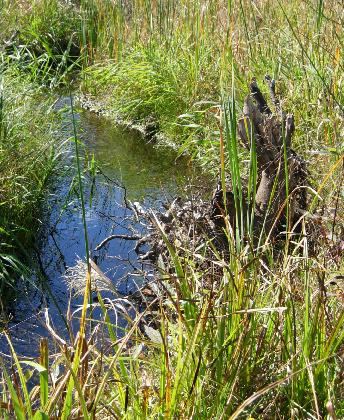
2 Water Year Data Summary, Stream Flow Introduction submitted by Michele Hanson photo by Michele Hanson There are many types of rivers and streams in Minnesota. Along the north shore of Lake Superior and the Mississippi River bluff lands in southeast Minnesota, fast flowing streams have scoured channels in bedrock. In the northwest, slow-moving, highly-meandered streams flow through the soft soils of an ancient lake bed and, due to their low gradient, are prone to flooding. In the southern third of the state, streams are often entrenched with well-defined channels, and are highly impacted by agricultural practices. North-central streams can be impacted by both agricultural and forest land uses. Minnesota is unique in that two of the three Continental Divides in North America cross through it, meeting at a point near Hibbing. These Continental Divides separate surface water runoff into three drainage basins (and their major river basins): the Hudson Bay/Arctic Ocean (Red River of the North, Rainy River), the Great Lakes/Atlantic Ocean (Lake Superior) and the Mississippi River/Gulf of Mexico (Upper and Lower Mississippi River, St. Croix River, Minnesota River, Missouri River and the Des Moines Cedar River). (See Figure 1) Minnesota is further unique in that very little water flows into the state. Only two rivers receive out-ofstate water: the headwaters of the Minnesota River from South Dakota, and the Blue Earth River from Iowa. Minnesota exports large volumes of water via the Red, Rainy, Mississippi (including the Minnesota and St. Croix Rivers), and through the numerous North Shore streams. A standardized set of watersheds was developed by the DNR in This Watershed Mapping Project delineated 81 Major Watersheds covering the state and approximately 56 Minor Watersheds that make up these Major Watersheds (Figure 2). Even earlier in the 197 s, the United States Geological Survey (USGS) and the Natural Resources Conservation Service (NRCS) developed the Hydrologic Unit system (HU for short) to divide and subdivide the U.S. into successively smaller watersheds. This system has been recently expanded and now adopted by the DNR with some modifications for its Lake Watershed Delineation Project (see website for more detail). surface water 17
3 Water Year Data Summary, Figure 1 Nine Major Stream Basins Hudson Bay / Arctic Ocean drainage basin Great Lakes / Atlantic Ocean drainage basin Continental Divide Red River of the North Basin Rainy River Basin Lake Superior / Great Lakes Basin Upper Mississippi River Basin St. Croix River Basin Minnesota River Basin Missouri River Basin Lower Mississippi River Basin Des Moines - Cedar River Basin Mississippi River / Gulf of Mexico drainage basin Stream Gaging in Minnesota The United States Geological Survey (USGS) is the primary agency doing nationwide stream gaging. At the present time, the USGS maintains a network of approximately 125 continuously recording stream gages and approximately 4 high-flow and miscellaneous flow gages in Minnesota. However, as needs for additional stream information become necessary, additional agencies and organizations are gaging as well. Other federal agencies doing stream gaging in Minnesota include the United States Army Corps of Engineers, with approximately 4 gages, and the National Weather Service. 18 The Minnesota Department of Natural Resources (DNR Waters Stream Hydrology Unit) is the primary state agency doing stream gaging, with a total of approximately 4 continuously recording gages and 6 seasonal gages. Other agencies having or supporting stream gaging in Minnesota include the Minnesota Department of Transportation and the Minnesota Pollution Control Agency. The Metropolitan Council also has several stream gages to monitor flows for public water supply and the discharge of treated waste waters. In addition, several watershed districts and lake associations operate gages. surface water

4 Water Year Data Summary, Gaging is an essential tool in analyzing stream flows. A stream gage is used to record the water surface elevation of a stream at a specific location. Measurements of stream discharge must be made periodically at the gage location to develop the relationship between stream elevation and the volume of flow at that location. Once this relationship is developed, recorded stream elevations can be converted to discharge in cubic feet per second (cfs). Telemetered gages record stream elevations continuously and transmit the data to a central location for conversion to discharge and for use in hydrologic analysis. There are many uses of information obtained from stream gages. Water surface elevation, the most basic information, assists in the determination of flood elevations, flood plains, and sizing of bridges and is useful for municipal zoning and planning. Planners use stream flow data for land use development and to determine water availability for industrial, domestic and agricultural consumption. Biologists use stream flow data to assist in evaluating aquatic habitat potential in streams. Knowing how much water is flowing or available in a stream is very important for flood and drought planning, as well as for the development of municipal and industrial water supplies. A recent trend in stream gages is to include a chemical sampling unit at the gage. The sampler will then measure a chemical in the water, and with the discharge data, calculate how many pounds of that chemical have flowed past that gage. (See discussion on page 21) If stream gages are lost due to budget constraints, flood prediction and low flow protection can be significantly compromised. The loss of a stream gage with a long-term record can seriously degrade ability to determine stream flow trends, drought and flood frequency calculations and other historical parameters. The longterm goal for DNR Waters is to establish and maintain at least one automated stream gaging station in each of Minnesota s 81 major watersheds to provide water quantity information needed to quantify pollutant loadings and develop Total Maximum Daily Loads (TMDLs). The USGS has a water science website which includes a section on How streamflow is measured. Click here for a primer geared toward high school students. Figure 2 shows the 81 major watersheds of the state and the location of the continuous recording gages that the DNR uses to monitor statewide stream flow conditions. These gages are used to gather data, including historic high and low flow and information for computing statistics such as flood frequencies and exceedence values (below). Photo by Lisa Pearson EXCEEDENCE VALUE An exceedence value is a statistical parameter, based upon historical discharge records, and is the probability of stream flow exceeding a certain value. A 5% exceedence value (Q5) indicates that the discharge at that reporting station has been equalled or exceeded 5% of the time during a specific period. Exceedence values can be calculated on a daily, monthly or annual basis. Stream flow reports are based upon the following exceedence values during the open water season. Critical Flow = < annual Q9 Low Flow = < monthly Normal Flow = monthly to High Flow = > monthly Flood Flow = > NWS* flood stage (or highest monthly Q1) * National Weather Service surface water 19
5 Water Year Data Summary, Figure 2 81 Major Watersheds 1. Lake Superior North 2. Lake Superior South 3. St. Louis River 4. Cloquet River 5. Nemadji River 6. (none) 7. Mississippi River Headwaters 8. Leech Lake River 9. Mississippi River - Grand Rapids 1. Mississippi River Brainerd 11. Pine River 12. Crow Wing River 13. Redeye River 14. Long Prairie River 15. Mississippi River Sartell 16. Sauk River 17. Mississippi River - St. Cloud 18. North Fork Crow River 19. South Fork Crow River 2. Mississippi River 21. Rum River 22. Minnesota River Headwaters 23. Pomme de Terre River 24. Lac Qui Parle River 25. Minnesota River - Granite Falls 26. Chippewa River 27. Redwood River 28. Minnesota River Mankato 29. Cottonwood River 3. Blue Earth River 31. Watonwan River 32. Le Sueur River 33. Minnesota River Shakopee 34. St. Croix River Upper 35. Kettle River 36. Snake River 37. St. Croix River Stillwater 38. Mississippi River & Lake Pepin 39. Cannon River 4. Mississippi River Winona 41. Zumbro River 42. Mississippi River - La Crescent 43. Root River 44. Mississippi River Reno 45. (none) 46. Upper Iowa River 47. Wapsipinican River 48. Cedar River 49. Shell Rock River 5. Winnebago River 51. West Fork Des Moines Head 52. West Fork Des Moines Lower 53. East Fork Des Moines 54. Bois de Sioux River 55. Mustinka River 56. Otter Tail River 57. Red River of the North 58. Buffalo River 59. Marsh River 6. Wild Rice River 61. Sandhill River 62. Upper/Lower Red Lake 63. Red Lake River 64. (none) 65. Thief River 66. Clearwater River 67. Grand Marais Creek 68. Snake River 69. Tamarac / Joe Rivers 7. Two River 71. Roseau River 72. Rainy River Headwaters 73. Vermilion River 74. Rainy River - Rainy Lake 75. Rainy River Manitou 76. Little Fork River 77. Big Fork River 78. Rapid River 79. Rainy River Baudette 8. Lake of the Woods 81. Big Sioux - Medary Creek 82. Big Sioux Pipestone 83. Rock River 84. Little Sioux River 2 surface water
, the Pollution Control Agency (PCA) and the National Weather Service (NWS), along with the cooperation of the")
6 MDNR/PCA Cooperative Stream Gaging Website Water Year Data Summary, The Minnesota Stream Flow Report The Cooperative Stream Gaging Website is the final product resulting from over two years of hard work from several individuals within the Department of Natural Resources (DNR), the Pollution Control Agency (PCA) and the National Weather Service (NWS), along with the cooperation of the United States Geological Survey (USGS). The website features data from over 2 stream gaging locations with near real-time capabilities as well as several hundred gaging stations with historic data operated by the USGS, DNR and PCA. This website will continue to change over the next year as additional gages and features come on line to support the Clean Water Legacy and as historic data is added to the website. An example of chemical sampling of data can be found at the Hawk Creek (near CR 116) website. Check the show water chemistry box above the graph and click on Change and you will be taken to a new graph which shows water chemistry data when hovering over the black diamonds (see example below). During the open water season, April 1 to September 3, a weekly Minnesota Stream Flow Report is produced on Mondays. The Stream Flow Report consists of a map showing current stream flow conditions by watershed (Flooding, High, Normal, Low, or Protected) as well as tabular data showing the prior week s stage and discharge, current stage and discharge, Flood Stage, the protected flow and the and exceedence discharges. Once the Stream Flow Report has been generated, it is forwarded to interested users and posted on the Internet for public viewing. Recipients of the Stream Flow Report use it to monitor current water issues such as flooding, drought, and water availability. The Stream Flow Report also gives a good representation of soil moisture and agricultural conditions throughout the state. The DNR Division of Waters may use the Stream Flow Report to encourage conservation and a reduction of water use during periods of Low Flow. When the Stream Flow Report identifies a river as having fallen to the Critical Flow Level, DNR Waters may suspend water appropriations in order to maintain some water in the river for downstream public water supplies, power generation and other higher priority uses. This minimal protected flow also provides water to help protected fish and wildlife dependant on the river. surface water 21


7 Water Year Data Summary, Water Year 25 In the fall of 24 (the 25 Water Year began October 1, 24), statewide stream flow conditions were around the. Flows continued around the through the fall and winter, and into the spring of 25. For most reporting stations, spring runoff remained near the exceedence value. However, in the southern half of the state, cold weather persisted and the spring snowmelt occurred as much as 2 weeks later than normal. In the northern half of the state, spring snow melt occurred at the normal time. Spring snowmelt flooding was not widespread, occurring mostly in the northern half of Red River of the North watersheds. By early May, with the snowmelt passed, the volume of water in many streams dropped to near the Low Flow level. However, heavy rains in late May and June restored flows throughout the state. In many cases, the May and June storms produced a greater volume of water than the spring snowmelt event. Flows in the mainstem and many tributaries of the Red River of the North exceeded flood stage. These May-June storms provided sufficient water to maintain stream flows in the normal range through the remainder of the water year for much of the state. However, these storms provided less water to the eastern portion of the state, including the Arrowhead region and the St. Croix River watersheds. By early August, Low Flow and Critical Flow conditions could be seen in these two areas. photo by Judy Boudreau The 25 Water Year ended with the southern half of the state in the High Flow range, flows in the northwestern quarter in the normal flow range and flows in the northeastern quarter in the Low or Critical Flow range. Figure 3 shows the 25 Average Annual Stream Flow Map. Statewide, all watersheds had an annual average flow greater than the historic average or normal flow. photo by Judy Boudreau 22 surface water
8 Water Year Data Summary, Figure 3 25 Average Annual Stream Flow Map Q1 - Q1 Q1 - - Q5 Q5 - - Q9 Q9 - Q1 surface water 23

9 Water Year Data Summary, Water Year - 26 Figure 4 shows the 26 Average Annual Stream Flow map. The 26 map is very similar to the 25 map. For the 26 water year, only one watershed gage, the Mississippi River at Aitken, had average flows below the statistical average or normal value. The 26 water year started off with a very large precipitation event covering the southern half of the state. As flows in the southern half of the state were already in the High Flow range at the end of the 25 water year, this large event provided sufficient water to maintain flows in the High Flow range through the fall of 25 and winter of 26. The St. Croix River watersheds also received excessive precipitation from this event and were lifted from the Low/Protected Flow range into the High Flow range through the winter of 26. In the southern half of the state and the Red River watersheds, the snowmelt runoff during the spring of 26 produced a significantly larger runoff event than observed in 25. Both the peak stage and total volume exceeded that of 25 and what would be considered normal stage and volumes. Spring flooding was again observed in most of the Red River watersheds as well as in scattered locations in the southern half of the state. In the northeastern quarter of the state, the spring runoff was near normal. Unlike 25, the timing of the 26 spring runoff event matched historic normals. In 26, little precipitation occurred during the months of May through September. In the southern half of the state and Red River watersheds, wet antecedent conditions and high ground water levels maintained the flows in the normal range well into summer. However, by mid-june, Low Flows were common throughout much of northeastern Minnesota. By early July, Low Flows encroached into the central portion of the state, with Protected Flows occurring in the St. Croix Valley. Dry conditions persisted trough the remainder of the summer and water year with Protected Flows occurring predominantly in the Arrowhead, northern Minnesota, the Mississippi River headwaters and the St. Croix Valley. Who shut the faucet off? A phrase often heard during the drought of 1987 and 1988 was Who shut the faucet off? or some variant. The question was pointed at the sudden cessation of precipitation. In June 26, the faucet was again shut off. While Figures 3 and 4 show that water levels were greater-than to much-greater-than normal for the 25 and 26 water years, Figure 4 does not show the sudden drop in water levels and flows that occurred in the last four months of the 26 water year. photo by Michele Hanson 24 This sudden drop can be observed in the hydrographs in Figures 7 and 9. Note the drop in water levels to near the Q9 Protected Flow for the months of July, August and September, 26. (Flows remained at this level for the first four months of the 27 water year.) surface water

10 Water Year Data Summary, Figure 4 26 Average Annual Stream Flow Map Q1 - Q1 Q1 - - Q5 Q5 - - Q9 Q9 - Q1 surface water 25
11 Water Year Data Summary, Hydrographs To give a general summary of flow conditions around the state for the 25 and 26 Water Years, discharge hydrographs were created for 1 selected streams. These streams and their locations are shown in Figure 5. For these 1 selected streams, mean daily discharges are shown in Figures 7 and 9 (pages 28 and 3). Included on those figures are the daily and exceedence numbers and the Q9 Protected Flow. Figures 8 and 1 (pages 29 and 31) show the mean annual discharge for each of the 1 selected sites. In these figures, the graphs, by water year, extend from 19 to 21. As with the other figures, the and exceedence values are included. Note, however, that these exceedence values are based on annual flows and are different than the and values calculated from daily flows. Also included on the graphs is the 3- Year Moving Average, showing the general flow trend. Figure 5 River/Gage Locations TAYLORS FALLS 1) Mississippi River at Grand Rapids 2) Mississippi River at Anoka 3) Chippewa River near Milan 4) Minnesota River at Mankato 5) St. Croix River at Taylors Falls 6) Red Lake River at Crookston 7) Red River of the North at East Grand Forks 8) Rainy River at Manitou Rapids 9) St. Louis River at Scanlon 1) Des Moines River at Jackson 26 surface water
12 Water Year Data Summary, Mean Monthly Discharge Mean Monthly Discharge was calculated for the 25 and 26 Water Years for each of the 1 selected streams shown in Figure 5. These monthly values were then divided by the historic monthly mean. The resultant value is a monthly mean value as a percentage of normal. For example, the January 25 monthly flow for the Mississippi River at Anoka was 4775 cfs, and the historic average January flow is 435 cfs. As a percentage, the January 25 flow is 4775/435 = 19.8%. For a completely normal year, each monthly value would be 1%. The advantage of this technique is that it normalizes the data and allows for the comparison of flows on different streams on the same scale. Figure 6 is a step graph showing the maximum, minimum, and average monthly value for the 1 selected streams as a group. (The individual streams are not included in this graph as the numerous lines make it difficult to read.) For the period from October 24 to June 26, the average of the monthly flows was above the 1% value. The maximum values for this period were significantly above the 1% level. The monthly minimum values were often below the 1% level, especially during the summer of 25. However, these minimum values were usually due to one or two streams that had lower flow levels during the water years. In July 26, the dramatic fall in flows in these rivers can be observed in Figure 6. For Figure 6 Monthly Percent of Normal Flow the remainder of the 26 Water Year (and into the 27 Water Year), the average flow of the 1 selected streams was 5% of normal, with the maximum at approximately 75% and the minimum at approximately 25%. As the 1 selected streams are scattered throughout the state, the narrow range between minimum and maximum indicates that the Low Flow conditions after July 26 were statewide. Mean Monthly Discharge for Ten Selected Streams October 24 to December Water Year 26 Water Year 27 WY Monthly Minimum Percentage Monthly Maximum Percentage Average Monthly Percentage Normal (1 %) Oct-4 Jan-5 Apr-5 Jul-5 Oct-5 Jan-6 Apr-6 Jul-6 Oct-6 Jan-7 Month (October 24 to December 26) surface water 27
13 Figure Water Year Data Summary, Mississippi River at Grand Rapids 1 5 1/1/4 12/1/4 2/1/5 4/1/5 6/1/5 8/1/5 1/1/5 12/1/5 2/1/6 4/1/6 6/1/6 8/1/6 1/1/ Mississippi River at Anoka Q9 1/1/4 12/1/4 2/1/5 4/1/5 6/1/5 8/1/5 1/1/5 12/1/5 2/1/6 4/1/6 6/1/6 8/1/6 1/1/ Q9 1/1/4 12/1/4 2/1/5 4/1/5 6/1/5 8/1/5 1/1/5 12/1/5 2/1/6 4/1/6 6/1/6 8/1/6 1/1/ Minnesota River at Mankato Q9 1/1/4 12/1/4 2/1/5 4/1/5 6/1/5 8/1/5 1/1/5 12/1/5 2/1/6 4/1/6 6/1/6 8/1/6 1/1/ Q9 Chippewa River at Milan St. Croix River near Taylors Falls 8 4 Q9 1/1/4 12/1/4 2/1/5 4/1/5 6/1/5 8/1/5 1/1/5 12/1/5 2/1/6 4/1/6 6/1/6 8/1/6 1/1/6 28 surface water

14 Water Year Data Summary, Figure 8 Mean Annual Discharge surface water 29
15 Water Year Data Summary, Figure Red Lake River at Crookston 1 5 Q9 1/1/4 12/1/4 2/1/5 4/1/5 6/1/5 8/1/5 1/1/5 12/1/5 2/1/6 4/1/6 6/1/6 8/1/6 1/1/6 7 6 Red River of the North at East Grand Forks Q9 1/1/4 12/1/4 2/1/5 4/1/5 6/1/5 8/1/5 1/1/5 12/1/5 2/1/6 4/1/6 6/1/6 8/1/6 1/1/ Rainy River at Manitou Rapids 2 1 Q9 1/1/4 12/1/4 2/1/5 4/1/5 6/1/5 8/1/5 1/1/5 12/1/5 2/1/6 4/1/6 6/1/6 8/1/6 1/1/ St. Louis River at Scanlon 6 3 Q9 1/1/4 12/1/4 2/1/5 4/1/5 6/1/5 8/1/5 1/1/5 12/1/5 2/1/6 4/1/6 6/1/6 8/1/6 1/1/ Des Moines River at Jackson Q9 1/1/4 12/1/4 2/1/5 4/1/5 6/1/5 8/1/5 1/1/5 12/1/5 2/1/6 4/1/6 6/1/6 8/1/6 1/1/6 3 surface water
16 Figure Year Moving Average Water Year Data Summary, Mean Annual Discharge Red Lake River at Crookston Red River of the North at East Grand Forks 24 3-Year Moving Average Rainy River at Manitou Rapids 2 3-Year Moving Average Year Moving Average St. Louis River at Scanlon Des Moines River at Jackson 3-Year Moving Average surface water 31
REDWOOD VALLEY SUBAREA
 Independent Science Review Panel Conceptual Model of Watershed Hydrology, Surface Water and Groundwater Interactions and Stream Ecology for the Russian River Watershed Appendices A-1 APPENDIX A A-2 REDWOOD
January 2011 Calendar Year Runoff Forecast
 January 2011 Calendar Year Runoff Forecast 2010 Runoff Year Calendar Year 2010 was the third highest year of runoff in the Missouri River Basin above Sioux City with 38.8 MAF, behind 1978 and 1997 which
January 25, Summary
 January 25, 2013 Summary Precipitation since the December 17, 2012, Drought Update has been slightly below average in parts of central and northern Illinois and above average in southern Illinois. Soil
Upper Missouri River Basin December 2017 Calendar Year Runoff Forecast December 5, 2017
 Upper Missouri River Basin December 2017 Calendar Year Runoff Forecast December 5, 2017 Calendar Year Runoff Forecast Explanation and Purpose of Forecast U.S. Army Corps of Engineers, Northwestern Division
Missouri River Basin Water Management
 Missouri River Basin Water Management US Army Corps of Engineers Missouri River Navigator s Meeting February 12, 2014 Bill Doan, P.E. Missouri River Basin Water Management US Army Corps of Engineers BUILDING
A Review of the 2007 Water Year in Colorado
 A Review of the 2007 Water Year in Colorado Nolan Doesken Colorado Climate Center, CSU Mike Gillespie Snow Survey Division, USDA, NRCS Presented at the 28 th Annual AGU Hydrology Days, March 26, 2008,
Upper Missouri River Basin February 2018 Calendar Year Runoff Forecast February 6, 2018
 Upper Missouri River Basin February 2018 Calendar Year Runoff Forecast February 6, 2018 Calendar Year Runoff Forecast Explanation and Purpose of Forecast U.S. Army Corps of Engineers, Northwestern Division
Sediment Deposition LET THE RIVER RUN T E A C H E R. Activity Overview. Activity at a Glance. Time Required. Level of Complexity.
 Activity at a Glance Grade: 6 9 Subject: Science Category: Physical Science, Earth Science Topic: Deposition, River Systems Time Required Two 45-minute periods Level of Complexity Medium Materials* TI-73
PLANNING BOARD An Inventory of Its Water Basin Maps and Graphs
 MINNESOTA HISTORICAL SOCIETY Minnesota State Archives PLANNING BOARD An Inventory of Its Water Basin Maps and Graphs OVERVIEW OF THE RECORDS Agency: Minnesota State Planning Board. Series Title: Dates:
Webinar and Weekly Summary February 15th, 2011
 Webinar and Weekly Summary February 15th, 2011 -Assessment of current water conditions - Precipitation Forecast - Recommendations for Drought Monitor Upper Colorado Normal Precipitation Upper Colorado
NATIONAL WEATHER SERVICE
 January 2016 February 9, 2016 This was a dry month across the HSA despite one large and several smaller snowfalls. Most locations ended up 1-2 inches below normal for the month. The driest locations at
9. PROBABLE MAXIMUM PRECIPITATION AND PROBABLE MAXIMUM FLOOD
 9. PROBABLE MAXIMUM PRECIPITATION AND PROBABLE MAXIMUM FLOOD 9.1. Introduction Due to the size of Watana Dam and the economic importance of the Project to the Railbelt, the Probable Maximum Flood (PMF)
Great Lakes Update. Great Lakes Winter and Spring Summary January June Vol. 187 Great Lakes Update August 2012
 Great Lakes Update Great Lakes Winter and Spring Summary January June 2012 The US Army Corps of Engineers (USACE) Detroit District monitors hydraulic and hydrologic conditions of the Great Lakes. This
2015 Fall Conditions Report
 2015 Fall Conditions Report Prepared by: Hydrologic Forecast Centre Date: December 21 st, 2015 Table of Contents Table of Figures... ii EXECUTIVE SUMMARY... 1 BACKGROUND... 2 SUMMER AND FALL PRECIPITATION...
Water Supply Conditions and Outlook June 4, 2018
 Water Supply Conditions and Outlook June 4, 2018 Flow Forecasting & Operations Planning Water Security Agency Overview Water supply conditions across Saskatchewan are generally good with most reservoir
Stream Flow Response to Climate in Minnesota
 ST. ANTHONY FALLS LABORATORY Engineering, Environmental and Geophysical Fluid Dynamics Project Report No. 510 Stream Flow Response to Climate in Minnesota by Filiz Dadaser-Celik and Heinz G. Stefan Prepared
Disentangling Impacts of Climate & Land Use Changes on the Quantity & Quality of River Flows in Southern Ontario
 Disentangling Impacts of Climate & Land Use Changes on the Quantity & Quality of River Flows in Southern Ontario by Trevor Dickinson & Ramesh Rudra, Water Resources Engineering University of Guelph Acknowledgements
Great Lakes Update. Volume 193: 2015 January through June Summary. Vol. 193 Great Lakes Update August 2015
 Great Lakes Update Volume 193: 2015 January through June Summary The U.S. Army Corps of Engineers (USACE) monitors the water levels of each of the Great Lakes. This report provides a summary of the Great
-Assessment of current water conditions. - Precipitation Forecast. - Recommendations for Drought Monitor
 April 27, 2010 -Assessment of current water conditions - Precipitation Forecast - Recommendations for Drought Monitor 7 Day Precipitation 19-25 April 2010 Month-to-Date Precipitation 1-25 April 2010
Flood Risk Assessment
 Flood Risk Assessment February 14, 2008 Larry Schick Army Corps of Engineers Seattle District Meteorologist General Assessment As promised, La Nina caused an active winter with above to much above normal
SEPTEMBER 2013 REVIEW
 Monthly Long Range Weather Commentary Issued: October 21, 2013 Steven A. Root, CCM, President/CEO sroot@weatherbank.com SEPTEMBER 2013 REVIEW Climate Highlights The Month in Review The average temperature
Climate Change and Climate Trends in Our Own Backyard
 Climate Change and Climate Trends in Our Own Backyard Dr. Mark Seeley Department of Soil, Water, and Climate University of Minnesota St Paul, MN 55108 For IATP: Winona Rural Climate Dialogue Citizen Jury
Illinois Drought Update, December 1, 2005 DROUGHT RESPONSE TASK FORCE Illinois State Water Survey, Department of Natural Resources
 Illinois Drought Update, December 1, 2005 DROUGHT RESPONSE TASK FORCE Illinois State Water Survey, Department of Natural Resources For more drought information please go to http://www.sws.uiuc.edu/. SUMMARY.
Upper Missouri River Basin January 2018 Calendar Year Runoff Forecast January 3, 2018
 Calendar Year Runoff Forecast Upper Missouri River Basin January 2018 Calendar Year Runoff Forecast January 3, 2018 Explanation and Purpose of Forecast U.S. Army Corps of Engineers, Northwestern Division
THE STATE OF SURFACE WATER GAUGING IN THE NAVAJO NATION
 THE STATE OF SURFACE WATER GAUGING IN THE NAVAJO NATION Aregai Tecle Professor of Hydrology Northern Arizona University Flagstaff, AZ Acknowledgement Many thanks to my research team mates and Elisabeth
NIDIS Intermountain West Drought Early Warning System January 15, 2019
 NIDIS Drought and Water Assessment NIDIS Intermountain West Drought Early Warning System January 15, 2019 Precipitation The images above use daily precipitation statistics from NWS COOP, CoCoRaHS, and
Oregon Water Conditions Report May 1, 2017
 Oregon Water Conditions Report May 1, 2017 Mountain snowpack in the higher elevations has continued to increase over the last two weeks. Statewide, most low and mid elevation snow has melted so the basin
A SURVEY OF HYDROCLIMATE, FLOODING, AND RUNOFF IN THE RED RIVER BASIN PRIOR TO 1870
 A SURVEY OF HYDROCLIMATE, FLOODING, AND RUNOFF IN THE RED RIVER BASIN PRIOR TO 1870 W. F. RANNIE (UNIVERSITY OF WINNIPEG) Prepared for the Geological Survey of Canada September, 1998 TABLE OF CONTENTS
Doug Kluck NOAA Kansas City, MO National Center for Environmental Information (NCEI) National Integrated Drought Information System (NIDIS)
 National Integrated Drought Information System (NIDIS)") National Integrated Drought Information System (NIDIS) for the Missouri River Basin Drought Early Warning Information System (DEWS) & Runoff Trends in the Missouri Basin & Latest Flood Outlook Doug Kluck
National Integrated Drought Information System (NIDIS) for the Missouri River Basin Drought Early Warning Information System (DEWS) & Runoff Trends in the Missouri Basin & Latest Flood Outlook Doug Kluck
Great Lakes Update. Volume 194: 2015 Annual Summary
 Great Lakes Update Volume 194: 2015 Annual Summary Background The U.S. Army Corps of Engineers (USACE) tracks and forecasts the water levels of each of the Great Lakes. This report summarizes the hydrologic
Climate also has a large influence on how local ecosystems have evolved and how we interact with them.
 The Mississippi River in a Changing Climate By Paul Lehman, P.Eng., General Manager Mississippi Valley Conservation (This article originally appeared in the Mississippi Lakes Association s 212 Mississippi
Great Lakes Update. Volume 199: 2017 Annual Summary. Background
 Great Lakes Update Volume 199: 2017 Annual Summary Background The U.S. Army Corps of Engineers (USACE) tracks and forecasts the water levels of each of the Great Lakes. This report is primarily focused
Missouri River Flood Task Force River Management Working Group Improving Accuracy of Runoff Forecasts
 Missouri River Flood Task Force River Management Working Group Improving Accuracy of Runoff Forecasts Kevin Grode, P.E. Reservoir Regulation Team Lead Missouri River Basin Water Management Northwestern
Monthly Long Range Weather Commentary Issued: SEPTEMBER 19, 2016 Steven A. Root, CCM, Chief Analytics Officer, Sr. VP,
 Monthly Long Range Weather Commentary Issued: SEPTEMBER 19, 2016 Steven A. Root, CCM, Chief Analytics Officer, Sr. VP, sroot@weatherbank.com SEPTEMBER 2016 Climate Highlights The Month in Review The contiguous
NIDIS Intermountain West Drought Early Warning System December 11, 2018
 NIDIS Drought and Water Assessment NIDIS Intermountain West Drought Early Warning System December 11, 2018 Precipitation The images above use daily precipitation statistics from NWS COOP, CoCoRaHS, and
2. PHYSICAL SETTING FINAL GROUNDWATER MANAGEMENT PLAN. 2.1 Topography. 2.2 Climate
 FINAL GROUNDWATER MANAGEMENT PLAN 2. PHYSICAL SETTING Lassen County is a topographically diverse area at the confluence of the Cascade Range, Modoc Plateau, Sierra Nevada and Basin and Range geologic provinces.
low turbidity high turbidity
 What is Turbidity? Turbidity refers to how clear the water is. The greater the amount of total suspended solids (TSS) in the water, the murkier it appears and the higher the measured turbidity. Excessive
HyMet Company. Streamflow and Energy Generation Forecasting Model Columbia River Basin
 HyMet Company Streamflow and Energy Generation Forecasting Model Columbia River Basin HyMet Inc. Courthouse Square 19001 Vashon Hwy SW Suite 201 Vashon Island, WA 98070 Phone: 206-463-1610 Columbia River
Modeling of peak inflow dates for a snowmelt dominated basin Evan Heisman. CVEN 6833: Advanced Data Analysis Fall 2012 Prof. Balaji Rajagopalan
 Modeling of peak inflow dates for a snowmelt dominated basin Evan Heisman CVEN 6833: Advanced Data Analysis Fall 2012 Prof. Balaji Rajagopalan The Dworshak reservoir, a project operated by the Army Corps
3.0 TECHNICAL FEASIBILITY
 3.0 TECHNICAL FEASIBILITY 3.1 INTRODUCTION To enable seasonal storage and release of water from Lake Wenatchee, an impoundment structure would need to be constructed on the lake outlet channel. The structure
The Great USA Flood of 1993
 Destructive Water: Water-Caused Natural Disasters, their Abatement and Control (Proceedings of the Conference held at Anaheim, California, June 1996). IAHS Publ. no, 239, 1997. 13 The Great USA Flood of
Weather and Climate Summary and Forecast Winter
 Weather and Climate Summary and Forecast Winter 2016-17 Gregory V. Jones Southern Oregon University February 7, 2017 What a difference from last year at this time. Temperatures in January and February
The Documentation of Extreme Hydrometeorlogical Events: Two Case Studies in Utah, Water Year 2005
 The Documentation of Extreme Hydrometeorlogical Events: Two Case Studies in Utah, Water Year 2005 Tim Bardsley1*, Mark Losleben2, Randy Julander1 1. USDA, NRCS, Snow Survey Program, Salt Lake City, Utah.
NIDIS Intermountain West Drought Early Warning System February 12, 2019
 NIDIS Intermountain West Drought Early Warning System February 12, 2019 Precipitation The images above use daily precipitation statistics from NWS COOP, CoCoRaHS, and CoAgMet stations. From top to bottom,
Weather and Climate Summary and Forecast March 2019 Report
 Weather and Climate Summary and Forecast March 2019 Report Gregory V. Jones Linfield College March 2, 2019 Summary: Dramatic flip from a mild winter to a top five coldest February on record in many locations
Preliminary Runoff Outlook February 2018
 Preliminary Runoff Outlook February 2018 Prepared by: Flow Forecasting & Operations Planning Water Security Agency General Overview The Water Security Agency (WSA) is preparing for 2018 spring runoff including
UNITED STATES AND SOUTH AMERICA OUTLOOK (FULL REPORT) Thursday, December 28, 2017
 Thursday, December 28, 2017") T-storm Weather Summary Despite scattered t-storms Sat.-Sun. in central and northern areas in Argentina, more will likely be needed especially in sunflower areas of the southwest. Some t-storms likely
T-storm Weather Summary Despite scattered t-storms Sat.-Sun. in central and northern areas in Argentina, more will likely be needed especially in sunflower areas of the southwest. Some t-storms likely
PH YSIC A L PROPERT IE S TERC.UCDAVIS.EDU
 PH YSIC A L PROPERT IE S 8 Lake surface level Daily since 1900 Lake surface level varies throughout the year. Lake level rises due to high stream inflow, groundwater inflow and precipitation directly onto
Oregon Water Conditions Report April 17, 2017
 Oregon Water Conditions Report April 17, 2017 Mountain snowpack continues to maintain significant levels for mid-april. By late March, statewide snowpack had declined to 118 percent of normal after starting
Hydrologic Conditions in the Delaware River Basin
 2017 Hydrologic Conditions in the Delaware River Basin Prepared by Operations Staff June 2018 Hydrologic Highlights Hydrologic Conditions in the Delaware River Basin Annual Report 2017 At the start of
PRELIMINARY DRAFT FOR DISCUSSION PURPOSES
 Memorandum To: David Thompson From: John Haapala CC: Dan McDonald Bob Montgomery Date: February 24, 2003 File #: 1003551 Re: Lake Wenatchee Historic Water Levels, Operation Model, and Flood Operation This
Minnesota s Climatic Conditions, Outlook, and Impacts on Agriculture. Today. 1. The weather and climate of 2017 to date
 Minnesota s Climatic Conditions, Outlook, and Impacts on Agriculture Kenny Blumenfeld, State Climatology Office Crop Insurance Conference, Sep 13, 2017 Today 1. The weather and climate of 2017 to date
Appendix D. Model Setup, Calibration, and Validation
 . Model Setup, Calibration, and Validation Lower Grand River Watershed TMDL January 1 1. Model Selection and Setup The Loading Simulation Program in C++ (LSPC) was selected to address the modeling needs
NIDIS Intermountain West Drought Early Warning System April 18, 2017
 1 of 11 4/18/2017 3:42 PM Precipitation NIDIS Intermountain West Drought Early Warning System April 18, 2017 The images above use daily precipitation statistics from NWS COOP, CoCoRaHS, and CoAgMet stations.
Upper Missouri River Basin May 2018 Calendar Year Runoff Forecast May 4, 2018
 Calendar Year Runoff Forecast Explanation and Purpose of Forecast Upper Missouri River Basin May 2018 Calendar Year Runoff Forecast May 4, 2018 U.S. Army Corps of Engineers, Northwestern Division Missouri
Rivers and Streams. Streams. Hydrologic Cycle. Drainage Basins and Divides. Colorado River Drainage Basin. Colorado Drainage Basins.
 Chapter 14 Hydrologic Cycle Rivers and Streams Streams A stream is a body of water that is confined in a channel and moves downhill under the influence of gravity. This definition includes all sizes of
Water Supply Conditions and Outlook October 1, 2018
 Water Supply Conditions and Outlook October 1, 2018 Flow Forecasting & Operations Planning Water Security Agency Overview Water supply conditions across Saskatchewan remain near normal, with most reservoirs
Drought and Future Water for Southern New Mexico
 Drought and Future Water for Southern New Mexico David S. Gutzler University of New Mexico gutzler@unm.edu * The big drought of 2018 * Longer term challenges for water supply * Forecasting streamflow Elephant
2017 Fall Conditions Report
 2017 Fall Conditions Report Prepared by: Hydrologic Forecast Centre Date: November 15, 2017 Table of Contents TABLE OF FIGURES... ii EXECUTIVE SUMMARY... 1 BACKGROUND... 4 SUMMER AND FALL PRECIPITATION...
Central Region Climate Outlook May 15, 2014
 Central Region Climate Outlook May 15, 2014 Dr. Jim Angel State Climatologist IL State Water Survey University of Illinois jimangel@illinois.edu 217-333-0729 Chicago-area flooding General Information Providing
Illinois State Water Survey Division
 Illinois State Water Survey Division SURFACE WATER SECTION SWS Miscellaneous Publication 108 SEDIMENT YIELD AND ACCUMULATION IN THE LOWER CACHE RIVER by Misganaw Demissie Champaign, Illinois June 1989
The hydrologic service area (HSA) for this office covers Central Kentucky and South Central Indiana.
 for this office covers Central Kentucky and South Central Indiana.") January 2012 February 13, 2012 An X inside this box indicates that no flooding occurred within this hydrologic service area. January 2012 continued the string of wet months this winter. Rainfall was generally
January 2012 February 13, 2012 An X inside this box indicates that no flooding occurred within this hydrologic service area. January 2012 continued the string of wet months this winter. Rainfall was generally
Impacts of the April 2013 Mean trough over central North America
 Impacts of the April 2013 Mean trough over central North America By Richard H. Grumm National Weather Service State College, PA Abstract: The mean 500 hpa flow over North America featured a trough over
NWS FORM E-5 U.S. DEPARTMENT OF COMMERCE I HYDRO SERVICE AREA NOAA, NATIONAL WEATHER SERVICE I Indianapolis, IN MONTHLY REPORT
 NWS FORM E-5 U.S. DEPARTMENT OF COMMERCE I HYDRO SERVICE AREA NOAA, NATIONAL WEATHER SERVICE I Indianapolis, IN. 1-------------------- MONTHLY REPORT OF RIVER AND FLOOD CONDITIONSI REPORT FOR I November
The hydrologic service area (HSA) for this office covers Central Kentucky and South Central Indiana.
 for this office covers Central Kentucky and South Central Indiana.") MONTH YEAR January 2011 February 15, 2011 X An X inside this box indicates that no flooding occurred within this hydrologic service area. January 2011 was drier than normal in all locations in the area.
MONTH YEAR January 2011 February 15, 2011 X An X inside this box indicates that no flooding occurred within this hydrologic service area. January 2011 was drier than normal in all locations in the area.
Water Year Data Summary, Lake Levels. Introduction
 Lake Levels Introduction The Lake Hydrology Program exists to support the DNR Waters director and staff by collecting and providing data on lake levels and other lake characteristics that are needed to
Midwest and Great Plains Climate- Drought Outlook 17 April 2014
 Midwest and Great Plains Climate- Drought Outlook 17 April 2014 Dr. Dennis Todey State Climatologist South Dakota State Univ. dennis.todey@sdstate.edu 605-688-5141 Photo taken Feb 19, 2013 Tornado-Trenton,
UNITED STATES AND SOUTH AMERICA OUTLOOK (FULL REPORT) Wednesday, April 18, 2018
 Wednesday, April 18, 2018") T-storm Weather Summary Coolness continues over the next week in much of the central U.S., most likely producing the coldest April since 1907 in the Corn Belt, but followed by seasonable to mild weather
T-storm Weather Summary Coolness continues over the next week in much of the central U.S., most likely producing the coldest April since 1907 in the Corn Belt, but followed by seasonable to mild weather
The Colorado Drought of 2002 in Perspective
 The Colorado Drought of 2002 in Perspective Colorado Climate Center Nolan Doesken and Roger Pielke, Sr. Prepared by Tara Green and Odie Bliss http://climate.atmos.colostate.edu Known Characteristics of
The Colorado Drought : 2003: A Growing Concern. Roger Pielke, Sr. Colorado Climate Center.
 The Colorado Drought 2001-2003: 2003: A Growing Concern Roger Pielke, Sr. Colorado Climate Center Prepared by Tara Green and Odie Bliss http://climate.atmos.colostate.edu 2 2002 Drought History in Colorado
UNITED STATES AND SOUTH AMERICA SNAPSHOT REPORT Thursday, December 21, 2017
 T-storm Weather Summary A small but key corn and soybean area in western Argentina was wetter than expected overnight. T-storms affect varying areas of South America at varying times into January, but
Investigation IV: Seasonal Precipitation and Seasonal Surface Runoff in the US
 Investigation IV: Seasonal Precipitation and Seasonal Surface Runoff in the US Purpose Students will consider the seasonality of precipitation and surface runoff and think about how the time of year can
2016 Fall Conditions Report
 2016 Fall Conditions Report Prepared by: Hydrologic Forecast Centre Date: December 13, 2016 Table of Contents TABLE OF FIGURES... ii EXECUTIVE SUMMARY... 1 BACKGROUND... 5 SUMMER AND FALL PRECIPITATION...
United States Streamflow Probabilities based on Forecasted La Niña, Winter-Spring 2000
 United States Streamflow Probabilities based on Forecasted La Niña, Winter-Spring 2000 contributed by Michael D. Dettinger 1, Daniel R. Cayan 1, and Kelly T. Redmond 2 1 U.S. Geological Survey, Scripps
Climate Change and Climate Trends in Our Own Backyard
 Climate Change and Climate Trends in Our Own Backyard Dr. Mark Seeley Department of Soil, Water, and Climate University of Minnesota St Paul, MN 55108 For IATP: Rural Climate Dialogue Grand Rapids, MN
Monthly Long Range Weather Commentary Issued: July 18, 2014 Steven A. Root, CCM, President/CEO
 Monthly Long Range Weather Commentary Issued: July 18, 2014 Steven A. Root, CCM, President/CEO sroot@weatherbank.com JUNE 2014 REVIEW Climate Highlights The Month in Review The average temperature for
Squaw Creek. General Information
 General Information is a tributary to the Salmon River. It enters the north side of the river about 0 miles downstream of North Fork, Idaho. The study reach is about a 30 ft length of stream about 2 miles
Overview of a Changing Climate in Rhode Island
 Overview of a Changing Climate in Rhode Island David Vallee, Hydrologist in Charge, National Weather Service Northeast River Forecast Center, NOAA Lenny Giuliano, Air Quality Specialist, Rhode Island Department
Climate change projections for Ontario: an updated synthesis for policymakers and planners
 Ministry of Natural Resources and Forestry Climate change projections for Ontario: an updated synthesis for policymakers and planners Shannon Fera and Adam Hogg Ontario Ministry of Natural Resources and
Diagnostic Geomorphic Methods for Understanding Future Behavior of Lake Superior Streams What Have We Learned in Two Decades?
 Diagnostic Geomorphic Methods for Understanding Future Behavior of Lake Superior Streams What Have We Learned in Two Decades? Faith Fitzpatrick USGS WI Water Science Center, Middleton, WI fafitzpa@usgs.gov
Colorado s 2003 Moisture Outlook
 Colorado s 2003 Moisture Outlook Nolan Doesken and Roger Pielke, Sr. Colorado Climate Center Prepared by Tara Green and Odie Bliss http://climate.atmos.colostate.edu How we got into this drought! Fort
Lake Tahoe Watershed Model. Lessons Learned through the Model Development Process
 Lake Tahoe Watershed Model Lessons Learned through the Model Development Process Presentation Outline Discussion of Project Objectives Model Configuration/Special Considerations Data and Research Integration
Highlights of the 2006 Water Year in Colorado
 Highlights of the 2006 Water Year in Colorado Nolan Doesken, State Climatologist Atmospheric Science Department Colorado State University http://ccc.atmos.colostate.edu Presented to 61 st Annual Meeting
Chiang Rai Province CC Threat overview AAS1109 Mekong ARCC
 Chiang Rai Province CC Threat overview AAS1109 Mekong ARCC This threat overview relies on projections of future climate change in the Mekong Basin for the period 2045-2069 compared to a baseline of 1980-2005.
Natural Variability in Annual Maximum Water Level and Outflow of Yellowstone Lake
 Natural Variability in Annual Maximum Water Level and Outflow of Yellowstone Lake Phillip E. Farnes Abstract The water level in Yellowstone Lake varies each year in response to differences in the winter
Current Climate Trends and Implications
 Current Climate Trends and Implications Dr. Mark Seeley Professor emeritus Department of Soil, Water, and Climate University of Minnesota St Paul, MN 55108 Crop Insurance Conference September 12, 2018
Kootenai Basin Water Supply Update and Sturgeon Flow Augmentation Kootenai Valley Resource Initiative
 Kootenai Basin Water Supply Update and Sturgeon Flow Augmentation Kootenai Valley Resource Initiative Greg Hoffman Fishery Biologist / Kootenai River Basin Flood Engineer Libby Dam 15 May 2017 US Army
NIDIS Weekly Climate, Water and Drought Assessment Summary. Upper Colorado River Basin July 31, 2012
 NIDIS Weekly Climate, Water and Drought Assessment Summary Upper Colorado River Basin July 31, 2012 Fig. 1: July month-to-date precipitation in inches. Fig. 2: SNOTEL WYTD precipitation percentiles (50%
Technical Notes: Magnitude and Return Period of 2004 Hurricane Rainfall in Florida
 Journal of Floodplain Management Floodplain Management Association NOV. 2005 Vol. 5, No. 1 Glenn Tootle 1 Thomas Mirti 2 Thomas Piechota 3 Technical Notes: Magnitude and Return Period of 2004 Hurricane
PRECIPITATION. Last Week Precipitation:
 12/3/2014 NIDIS Drought and Water Assessment PRECIPITATION The images above use daily precipitation statistics from NWS COOP, CoCoRaHS, and CoAgMet stations. From top to bottom, and left to right: most
The Pennsylvania Observer
 The Pennsylvania Observer April 2, 2010 March 2010 Pennsylvania Weather Recap Prepared by: Katelyn Johnson March did come in as a lion cub this year. The 1 st proved to be a calm day; however most of Pennsylvania
2012 Growing Season Weather Summary for North Dakota. Adnan Akyüz and Barbara A. Mullins Department of Soil Science October 30, 2012
 2012 Growing Season Weather Summary for North Dakota Adnan Akyüz and Barbara A. Mullins Department of Soil Science October 30, 2012 Introduction The 2012 growing season (the period from April through September)
Water Availability and Drought Conditions Report. October 2015
 Water Availability and Drought Conditions Report October 2015 Executive Summary The Water Availability and Drought Conditions Report provides an update on drought conditions throughout Manitoba for October
Missouri River Basin Water Management Monthly Update
 Missouri River Basin Water Management Monthly Update Participating Agencies 255 255 255 237 237 237 0 0 0 217 217 217 163 163 163 200 200 200 131 132 122 239 65 53 80 119 27 National Oceanic and Atmospheric
Monthly Long Range Weather Commentary Issued: APRIL 1, 2015 Steven A. Root, CCM, President/CEO
 Monthly Long Range Weather Commentary Issued: APRIL 1, 2015 Steven A. Root, CCM, President/CEO sroot@weatherbank.com FEBRUARY 2015 Climate Highlights The Month in Review The February contiguous U.S. temperature
Monthly Long Range Weather Commentary Issued: February 15, 2015 Steven A. Root, CCM, President/CEO
 Monthly Long Range Weather Commentary Issued: February 15, 2015 Steven A. Root, CCM, President/CEO sroot@weatherbank.com JANUARY 2015 Climate Highlights The Month in Review During January, the average
NIDIS Weekly Climate, Water and Drought Assessment Summary. Upper Colorado River Basin June 21, 2011
 NIDIS Weekly Climate, Water and Drought Assessment Summary Upper Colorado River Basin June 21, 2011 PrecipitaEon and Snowpack Fig. 1: June month to date precipitaeon in inches. Fig. 2: 24 hour accumulated
but 2012 was dry Most farmers pulled in a crop
 After a winter that wasn t, conditions late in the year pointed to a return to normal snow and cold conditions Most farmers pulled in a crop but 2012 was dry b y M i k e Wr o b l e w s k i, w e a t h e
Kaskaskia Morphology Study Headwaters to Lake Shelbyville
 Kaskaskia Morphology Study Headwaters to Lake Shelbyville KWA Mini Summit 5 March 2012 1 Kaskaskia Morphology Study Headwaters to Lake Shelbyville Conducted by U.S. Army Corps of Engineers, St. Louis District
Current Water Conditions in Massachusetts January 11, 2008
 Current Water Conditions in Massachusetts January 11, 2008 December precipitation was above normal December streamflows were below normal and normal December ground-water levels were below normal and normal