MWCropDSS for SCY4cast system
|
|
|
- Ira Horton
- 6 years ago
- Views:
Transcription


1 MWCropDSS for SCY4cast system SDBMS Admin. boundary MBMS DSSAT 4.6 FILE-X & OTHER INPUTS Crop areas Soil Series Climate zone GCM & RCMs: SWF Roi Et Series TH CMMC KKKU ECHAM4 Production Scenarios OUTPUT FILES SEACLID/CORDEX ANALYSIS PROGRAMS Yield & Production 3-6 Months in advance Jintrawet (2009)

2 Weather Data Minimum Dataset Weather File Structure Weatherman Exercise
3 Minimum data set Minimum set of data that can be easily collected by experimentalists Minimum set of data that can be used as input to models and provide reliable simulaaons of the processes involved

4
5 Minimum weather data Daily ObservaAons Maximum temperature Minimum temperature Solar radiaaon PrecipitaAon/rainfall
6 Minimum weather data Site ObservaAons LaAtude Longitude ElevaAon Long- term average temperature Amplitude of warmest and coolest monthly long- term average temperature Temperature sensor height Wind sensor height
7 *WEATHER DATA :KKFCRC Weather INSI LAT LONG ELEV TAV AMP REFHT WNDHT DTKK SRAD TMAX TMIN RAIN
8 File naming convenaon AABBNNnn.WTH AA = InsAtute IdenAfier (ID) BB = Site ID NN = Year of observaaon nn = Number of years (default = 01)
9 File naming convenaon DTKK1301.WTH DT = Department of Agriculture, Thailand KK = Khon Kaen Field Crop Research Center 13 = = 1 year of data
10 File naming convenaon DTKK1101.WTH DTKK1201.WTH.
11 WeatherMan Weather management uality program Import data Export data in DSSAT format Fill missing data Summarize weather data
12 Data quality Missing data Erroneous data rain < 0.0 radiaaon =< 0.0 Tmax < Tmin Tmax > Extreme_max Tmin < Extreme_min
13 Weather Generators Climate file One file per site AABB.CLI AA = InsAtute ID BB = Site ID DTKK.CLI
14 *CLIMATE : INSI LAT LONG ELEV TAV AMP SRAY TMXY TMNY RAIY GAGR DURN ANGA ANGB REFHT WNDHT SOURCE GSST GSDU *MONTHLY SAMN XAMN NAMN RTOT RNUM SHMN AMTH BMTH
15 *CLIMATE : INSI LAT LONG ELEV TAV AMP SRAY TMXY TMNY RAIY GAGR DURN ANGA ANGB REFHT WNDHT SOURCE GSST GSDU *MONTHLY SAMN XAMN NAMN RTOT RNUM SHMN AMTH BMTH

16 Weatherman Import from text, CVS, XLS, or DBF files Data is stored in Paradox databases and exported into DSSAT weather files InteracAve data management and climate analysis


17 Monthly averages are calculated and can be edited Station Information can be edited


18 Columns can be defined interactively Data can be entered interactively of imported from text, CVS, XLS, or DBF files

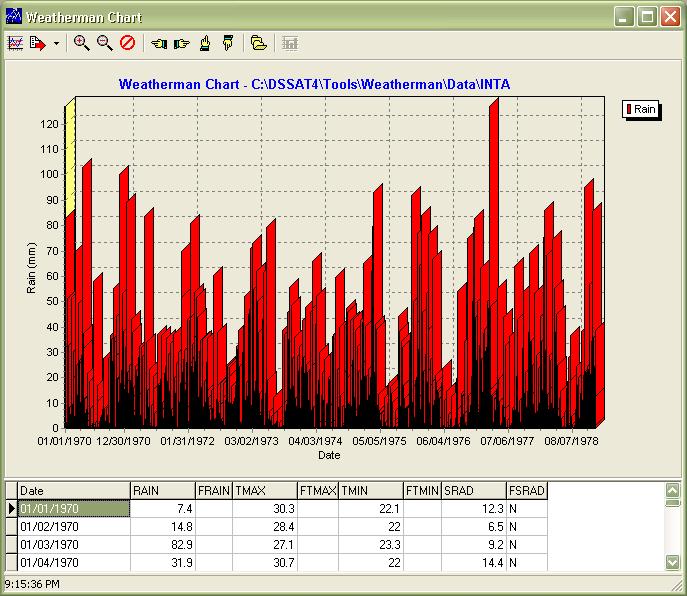

19 .. and graphically analyzed. Data can be edited interactively..

20 Data can then be exported for use in DSSAT
21 Summary Good news DSSATv4 weather files are idenacal to V3.5 New weather generators (long- term targets, ENSO, and GCM) are being developed Less good news Some features are not fully debugged and known problems exist No Y2K format (YYYYDDD) support Befer news An update will likely be ready by workshop end.
22 Acronyms DESCRIPTION ALPHA Rainfall distribution scale parameter, monthly, mm-2 AMTH Angstrom 'a' coefficient, monthly, unitless ANGA Angstrom 'a' coefficient, yearly, unitless ANGB Angstrom 'b' coefficient, yearly, unitless BMTH Angstrom 'b' coefficient, monthly, unitless DATE Date, year + days from Jan. 1 DEWP Daily dewpoint temperature, C DURN Duration of summarization period for climate files, Yr ELEV Elevation, m EVAP Daily pan evaporation (mm d-1) GSDU Growing season duration, Day GSST Growing season start day, Doy INSI Institute and site code LAT Latitude, degrees (decimals) LONG Longitude, degrees (decimals) MTH Month, # NAMN Temperature minimum,all days,monthly average, C NASD Temperature minimum,all days,monthly standard deviation, C PAR Daily photosynthetic radiation, moles m-2 day-1 PDW Probability of a dry-wet sequence RAIN Daily rainfall (incl.snow), mm day-1 RAIY Rainfall, yearly total, mm REFHT Reference height for weather measurements, m RNUM Rainy days, # month-1 RTOT Rainfall total, mm month-1 SAMN Solar radiation,all days,monthly average, MJ m-2 d-1 SDMN Solar radiation,dry days,monthly average, MJ m-2 d-1 SDSD Solar radiation,dry days,monthly standard deviation, MJ m-2 d-1 SHMN Daily sunshine duration, monthly average, percent SOURCE Source of daily weather data, text SRAD Daily solar radiation, MJ m-2 day-1 SRAY Solar radiation,yearly average, MJ m-2 day-1 START Start of summary period for climate (CLI) files, Year SUNH Daily sunshine duration, percent SWMN Solar radiation,wet days,monthly average, MJ m-2 d-1 SWSD Solar radiation,wet days,monthly standard deviation, MJ m-2 d-1 TAMP Temperature amplitude, monthly averages, C TAV Temperature average for whole year, C TDRY Daily dry-bulb temperature, C TMAX Daily temperature maximum, C TMIN Daily temperature minimum, C TMNY Temperature minimum, yearly average, C TMXY Temperature maximum, yearly average, C TWET Daily wet-bulb temperature, C WIND Daily wind speed (km d-1) WNDHT Reference height for windspeed measurements, m XAMN Temperature maximum,all days,monthly average, C XDMN Temperature maximum,dry days,monthly average, C XDSD Temperature maximum,dry days,standard deviation, C XWMN Temperature maximum,wet days,monthly average, C XWSD Temperature maximum,wet days,standard deviation
The principal constraints to many important applied
 SOFTWARE MarkSim Software to Generate Daily Weather Data for Latin America and Africa Peter G. Jones* and Philip K. Thornton ABSTRACT A software package to generate daily weather data for Latin America
Introduction to Climate Projections and Analysis
 Introduction to Climate Projections and Analysis Jack Katzfey, CSIRO Oceans and Atmosphere 1 June 2016 The project is being implemented by the Asian Development Bank through the technical assistance (TA
SWAT WEATHER DATABASE TOOL
 A SUPPORT SYSTEM FOR THE LONG-TERM ANALYSIS OF CLIMATE SCENARIOS WITH SWAT Arthur H. Essenfelder Centro Euro-Mediterraneo sui Cambiamenti Climatici CMCC 2017 INTERNATIONAL SWAT CONFERENCE 28 30 JUNE 2017,
Variability of Reference Evapotranspiration Across Nebraska
 Know how. Know now. EC733 Variability of Reference Evapotranspiration Across Nebraska Suat Irmak, Extension Soil and Water Resources and Irrigation Specialist Kari E. Skaggs, Research Associate, Biological
CliGen (Climate Generator) Addressing the Deficiencies in the Generator and its Databases William J Rust, Fred Fox & Larry Wagner
 Addressing the Deficiencies in the Generator and its Databases William J Rust, Fred Fox & Larry Wagner") CliGen (Climate Generator) Addressing the Deficiencies in the Generator and its Databases William J Rust, Fred Fox & Larry Wagner United States Department of Agriculture, Agricultural Research Service
CliGen (Climate Generator) Addressing the Deficiencies in the Generator and its Databases William J Rust, Fred Fox & Larry Wagner United States Department of Agriculture, Agricultural Research Service
Appendix C. AMEC Evaluation of Zuni PPIW. Appendix C. Page C-1 of 34
 AMEC s Independent Estimate of PPIW Crop Water Use Using the ASCE Standardized Reference Evapotranspiration via Gridded Meteorological Data, and Estimation of Crop Coefficients, and Net Annual Diversions
Analysis of Rainfall and Other Weather Parameters under Climatic Variability of Parbhani ( )
") International Journal of Current Microbiology and Applied Sciences ISSN: 2319-7706 Volume 7 Number 06 (2018) Journal homepage: http://www.ijcmas.com Original Research Article https://doi.org/10.20546/ijcmas.2018.706.295
International Journal of Current Microbiology and Applied Sciences ISSN: 2319-7706 Volume 7 Number 06 (2018) Journal homepage: http://www.ijcmas.com Original Research Article https://doi.org/10.20546/ijcmas.2018.706.295
Format of CLIGEN weather station statistics input files. for CLIGEN versions as of 6/2001 (D.C. Flanagan).
.") Format of CLIGEN weather station statistics input files for CLIGEN versions 4.1-5.1 as of 6/2001 (D.C. Flanagan). updated 12/11/2008 - Jim Frankenberger These files are also known as CLIGEN state files
Format of CLIGEN weather station statistics input files for CLIGEN versions 4.1-5.1 as of 6/2001 (D.C. Flanagan). updated 12/11/2008 - Jim Frankenberger These files are also known as CLIGEN state files
Evapotranspiration. Rabi H. Mohtar ABE 325
 Evapotranspiration Rabi H. Mohtar ABE 325 Introduction What is it? Factors affecting it? Why we need to estimate it? Latent heat of vaporization: Liquid gas o Energy needed o Cooling process Saturation
Meteorology. Chapter 15 Worksheet 1
 Chapter 15 Worksheet 1 Meteorology Name: Circle the letter that corresponds to the correct answer 1) The Tropic of Cancer and the Arctic Circle are examples of locations determined by: a) measuring systems.
CLIMATOLOGICAL REPORT 2002
 Range Cattle Research and Education Center Research Report RC-2003-1 February 2003 CLIMATOLOGICAL REPORT 2002 Range Cattle Research and Education Center R. S. Kalmbacher Professor, IFAS, Range Cattle Research
London Heathrow Field Site Metadata
 London Heathrow Field Site Metadata Field Site Information Name: Heathrow src_id (Station ID number): 708 Geographic Area: Greater London Latitude (decimal ): 51.479 Longitude (decimal ): -0.449 OS Grid
Utilization of seasonal climate predictions for application fields Yonghee Shin/APEC Climate Center Busan, South Korea
 The 20 th AIM International Workshop January 23-24, 2015 NIES, Japan Utilization of seasonal climate predictions for application fields Yonghee Shin/APEC Climate Center Busan, South Korea Background Natural
Downscaling in Time. Andrew W. Robertson, IRI. Advanced Training Institute on Climate Variability and Food Security, 12 July 2002
 Downscaling in Time Andrew W. Robertson, IRI Advanced Training Institute on Climate Variability and Food Security, 12 July 2002 Preliminaries Crop yields are driven by daily weather variations! Current
Chapter 2 Agro-meteorological Observatory
 Chapter 2 Agro-meteorological Observatory Abstract A Meteorological observatory is an area where all the weather instruments and structures are installed. The chapter gives a description of a meteorological
Estimation of Solar Radiation at Ibadan, Nigeria
 Journal of Emerging Trends in Engineering and Applied Sciences (JETEAS) 2 (4): 701-705 Scholarlink Research Institute Journals, 2011 (ISSN: 2141-7016) jeteas.scholarlinkresearch.org Journal of Emerging
Trevor Lee Director, Buildings. Grant Edwards PhD Department of Environment and Geography
 Weather Affects Building Performance Simulation v Monitoring real time solar and coincident weather data for building optimisation and energy management Trevor Lee Director, Buildings Grant Edwards PhD
Table 13 Maximum dewpoint temperature (degrees Celsius), primary meteorological station, H. J. Andrews Experimental Forest, 5/10/72 through 12/31/84
, primary meteorological station, H. J. Andrews Experimental Forest, 5/10/72 through 12/31/84") Table 13 Maximum dewpoint temperature (degrees Celsius), primary meteorological station, H. J. Andrews Experimental Forest, 5/10/72 through 12/31/84 Table 14 Mean nighttime dewpoint temperature (degrees
Table 13 Maximum dewpoint temperature (degrees Celsius), primary meteorological station, H. J. Andrews Experimental Forest, 5/10/72 through 12/31/84 Table 14 Mean nighttime dewpoint temperature (degrees
2.4. Model Outputs Result Chart Growth Weather Water Yield trend Results Single year Results Individual run Across-run summary
 2.4. Model Outputs Once a simulation run has completed, a beep will sound and the Result page will show subsequently. Other output pages, including Chart, Growth, Weather, Water, and Yield trend, can be
Regional Consultative Workshop on
 Regional Consultative Workshop on El Niño in Asia-Pacific Country Presentation of Myanmar 7-9 June 2016 Bangkok, Thailand El Niño Impact (Myanmar Aspect) The impacts of El Nino event on the climate and
Development of Agrometeorological Models for Estimation of Cotton Yield
 DOI: 10.5958/2349-4433.2015.00006.9 Development of Agrometeorological Models for Estimation of Cotton Yield K K Gill and Kavita Bhatt School of Climate Change and Agricultural Meteorology Punjab Agricultural
. Study locations and meteorological data Seven meteorological stations from southern to northern parts in Finland were selected for this study (Fig.
 Long-term trends of pan evaporation and an analysis of its causes in Finland Toshitsugu Moroizumi, Naoya Ito, Jari Koskiaho and Sirkka Tattari Graduate School of Environmental and Life Science, Okayama
Colorado State University, Fort Collins, CO Weather Station Monthly Summary Report
 Colorado State University, Fort Collins, CO Weather Station Monthly Summary Report Month: December Year: 2016 Temperature: Mean T max was 39.7 F which is 3.1 below the 1981-2010 normal for the month. This
[1] Emissions of CO 2 and other GHGs are increasing
![[1] Emissions of CO 2 and other GHGs are increasing](/thumbs/81/84565805.jpg "[1] Emissions of CO 2 and other GHGs are increasing") The science and policy of climate change is based on four major pieces of evidence [1] Emissions of CO 2 and other GHGs are increasing 7 6 5 4 3 2 1 195 1953 1956 1959 1962 1965 1968 1971 1974 1977 198
The science and policy of climate change is based on four major pieces of evidence [1] Emissions of CO 2 and other GHGs are increasing 7 6 5 4 3 2 1 195 1953 1956 1959 1962 1965 1968 1971 1974 1977 198
Estimation of solar radiation at Uturu, Nigeria
 International Journal of Physical Sciences Vol. 3 (5), pp. 126-130, May, 2008 Available online at http://www.academicjournals.org/ijps ISSN 1992 1950 2008 Academic Journals Full Length Research Paper Estimation
WHEN CAN YOU SEED FALLOW GROUND IN THE FALL? AN HISTORICAL PERSPECTIVE ON FALL RAIN
 WHEN CAN YOU SEED FALLOW GROUND IN THE FALL? AN HISTORICAL PERSPECTIVE ON FALL RAIN Steve Petrie and Karl Rhinhart Abstract Seeding at the optimum time is one key to producing the greatest yield of any
Climate Regions. Combining Climate Graphs and Köppen s Classification
 Lab 15 Climate Regions Combining knowledge of the global patterns behind the major climatic controls, this lab will teach students how to construct climate graphs and then allow them to explore patterns
Review of ET o calculation methods and software
 Climate change and Bio-energy Unit (NRCB) Review of ET o calculation methods and software Technical report Delobel François February 2009 1 Table of Content List of figure... 4 1. Introduction... 8 2.
The Climate of Payne County
 The Climate of Payne County Payne County is part of the Central Great Plains in the west, encompassing some of the best agricultural land in Oklahoma. Payne County is also part of the Crosstimbers in the
The Climate of Kiowa County
 The Climate of Kiowa County Kiowa County is part of the Central Great Plains, encompassing some of the best agricultural land in Oklahoma. Average annual precipitation ranges from about 24 inches in northwestern
Chiang Rai Province CC Threat overview AAS1109 Mekong ARCC
 Chiang Rai Province CC Threat overview AAS1109 Mekong ARCC This threat overview relies on projections of future climate change in the Mekong Basin for the period 2045-2069 compared to a baseline of 1980-2005.
Deliverable: D3.6. Description of the. final version of all gridded data sets of the climatology of the Carpathian Region
 Deliverable D3.6 Description of the final version of all gridded data sets of the climatology of the Carpathian Region Contract number: OJEU 2010/S 110 166082 Deliverable: D3.6 Author: Igor Antolovic,
Table of Contents. Page
 Eighteen Years (1990 2007) of Climatological Data on NMSU s Corona Range and Livestock Research Center Research Report 761 L. Allen Torell, Kirk C. McDaniel, Shad Cox, Suman Majumdar 1 Agricultural Experiment
Analyzing spatial and temporal variation of water balance components in La Vi catchment, Binh Dinh province, Vietnam
 Analyzing spatial and temporal variation of water balance components in La Vi catchment, Binh Dinh province, Vietnam Nguyen Duy Liem, Vo Ngoc Quynh Tram, Nguyen Le Tan Dat, Nguyen Kim Loi Nong Lam University-
MT-CLIM for Excel. William M. Jolly Numerical Terradynamic Simulation Group College of Forestry and Conservation University of Montana c 2003
 MT-CLIM for Excel William M. Jolly Numerical Terradynamic Simulation Group College of Forestry and Conservation University of Montana c 2003 1 Contents 1 INTRODUCTION 3 2 MTCLIM for Excel (MTCLIM-XL) 3
Climate and Regional Sustainability
 Climate and Regional Sustainability Anond Snidvongs Southeast Asia START Regional Center Chulalongkorn University Bangkok, Thailand Topics Southeast Asia, a monsoon influenced region Global-regional climate
Hierarchical models for the rainfall forecast DATA MINING APPROACH
 Hierarchical models for the rainfall forecast DATA MINING APPROACH Thanh-Nghi Do dtnghi@cit.ctu.edu.vn June - 2014 Introduction Problem large scale GCM small scale models Aim Statistical downscaling local
Using the EartH2Observe data portal to analyse drought indicators. Lesson 4: Using Python Notebook to access and process data
 Using the EartH2Observe data portal to analyse drought indicators Lesson 4: Using Python Notebook to access and process data Preface In this fourth lesson you will again work with the Water Cycle Integrator
Appendix E. OURANOS Climate Change Summary Report
 Appendix E OURANOS Climate Change Summary Report Production of Climate Scenarios for Pilot Project and Case Studies The protocol developed for assessing the vulnerability of infrastructure requires data
The Climate of Grady County
 The Climate of Grady County Grady County is part of the Central Great Plains, encompassing some of the best agricultural land in Oklahoma. Average annual precipitation ranges from about 33 inches in northern
The Climate of Marshall County
 The Climate of Marshall County Marshall County is part of the Crosstimbers. This region is a transition region from the Central Great Plains to the more irregular terrain of southeastern Oklahoma. Average
The Climate of Bryan County
 The Climate of Bryan County Bryan County is part of the Crosstimbers throughout most of the county. The extreme eastern portions of Bryan County are part of the Cypress Swamp and Forest. Average annual
Assessing bias in satellite rainfall products and their impact in water balance closure at the Zambezi headwaters
 Assessing bias in satellite rainfall products and their impact in water balance closure at the Zambezi headwaters Omondi C.K. 1 Rientjes T.H.M. 1, Haile T.A. 2, Gumindoga W. 1,3 (1) Faculty ITC, University
Reproduction of precipitation characteristics. by interpolated weather generator. M. Dubrovsky (1), D. Semeradova (2), L. Metelka (3), M.
, D. Semeradova (2), L. Metelka (3), M.") Reproduction of precipitation characteristics by interpolated weather generator M. Dubrovsky (1), D. Semeradova (2), L. Metelka (3), M. Trnka (2) (1) Institute of Atmospheric Physics ASCR, Prague, Czechia
Reproduction of precipitation characteristics by interpolated weather generator M. Dubrovsky (1), D. Semeradova (2), L. Metelka (3), M. Trnka (2) (1) Institute of Atmospheric Physics ASCR, Prague, Czechia
Incorporating Climate Scenarios for Studies of Pest and Disease Impacts
 Incorporating Climate Scenarios for Studies of Pest and Disease Impacts Alex Ruane February 24, 2015 AgMIP Pests and Diseases Workshop Gainesville, Florida Thanks to AgMIP Climate co-leader: Sonali McDermid,
Evaluation of Methodologies to Estimate Reference Evapotranspiration in Florida
 Proc. Fla. State Hort. Soc. 123:189 195. 2010. Evaluation of Methodologies to Estimate Reference Evapotranspiration in Florida E.M. Gelcer 1, C.W. Fraisse* 1, and P.C. Sentelhas 2 1University of Florida,
Climate Services in Seychelles
 Climate Services in Seychelles Vincent Amelie Seychelles Met. Services Email: v.amelie@meteo.gov.sc Regional Consultation on Climate Services in the Indian Ocean Islands, Ebène, Mauritius, 14-16 March
MxVision WeatherSentry Web Services Content Guide
 MxVision WeatherSentry Web Services Content Guide July 2014 DTN 11400 Rupp Drive Minneapolis, MN 55337 00.1.952.890.0609 This document and the software it describes are copyrighted with all rights reserved.
PROJECTING THE SOLAR RADIATION IN NASARAWA-NIGERIA USING REITVELD EQUATION
 PROJECTING THE SOLAR RADIATION IN NASARAWA-NIGERIA USING REITVELD EQUATION * Benedicta C. Njoku 1, Musibau A. Adesina 2, Eshipemi W. Lukman 3 and Bankole Omojola 4 1,2,3 Mechanical Engineering Department,
LOCAL CLIMATOLOGICAL DATA Monthly Summary July 2013
 Deg. Days Precip Ty Precip Wind Solar Hu- Adj. to Sea Level mid- ity Avg Res Res Peak Minute 1 fog 2 hvy fog 3 thunder 4 ice plt 5 hail 6 glaze 7 duststm 8 smk, hz 9 blw snw 1 2 3 4A 4B 5 6 7 8 9 12 14
What is happening to the Jamaican climate?
 What is happening to the Jamaican climate? Climate Change and Jamaica: Why worry? Climate Studies Group, Mona (CSGM) Department of Physics University of the West Indies, Mona Part 1 RAIN A FALL, BUT DUTTY
Climpact2 and regional climate models
 Climpact2 and regional climate models David Hein-Griggs Scientific Software Engineer 18 th February 2016 What is the Climate System?? What is the Climate System? Comprises the atmosphere, hydrosphere,
Effect of rainfall and temperature on rice yield in Puri district of Odisha in India
 2018; 7(4): 899-903 ISSN (E): 2277-7695 ISSN (P): 2349-8242 NAAS Rating: 5.03 TPI 2018; 7(4): 899-903 2018 TPI www.thepharmajournal.com Received: 05-02-2018 Accepted: 08-03-2018 A Baliarsingh A Nanda AKB
Performance Assessment of Hargreaves Model in Estimating Global Solar Radiation in Sokoto, Nigeria
 International Journal of Advances in Scientific Research and Engineering (ijasre) E-ISSN : 2454-8006 DOI: http://dx.doi.org/10.7324/ijasre.2017.32542 Vol.3 (11) December-2017 Performance Assessment of
The Climate of Pontotoc County
 The Climate of Pontotoc County Pontotoc County is part of the Crosstimbers. This region is a transition region from the Central Great Plains to the more irregular terrain of southeast Oklahoma. Average
THE LATE BLIGHT MODELING SOFTWARE «Pameseb Late Blight»
 THE LATE BLIGHT MODELING SOFTWARE «Pameseb Late Blight» Pameseb a.s.b.l http://www.pameseb.be Walloon Agricultural Research Center http://www.cra.wallonie.be Armstatehydromet and Ministry of Agriculture
BETWIXT Built EnvironmenT: Weather scenarios for investigation of Impacts and extremes. BETWIXT Technical Briefing Note 1 Version 2, February 2004
 Building Knowledge for a Changing Climate BETWIXT Built EnvironmenT: Weather scenarios for investigation of Impacts and extremes BETWIXT Technical Briefing Note 1 Version 2, February 2004 THE CRU DAILY
LOCAL CLIMATOLOGICAL DATA Monthly Summary September 2016
 Deg. Days Precip Ty Precip Wind Solar Hu- Adj. to Sea Level mid- ity Avg Res Res Peak 2 Minute 1 fog 2 hvy fog 3 thunder 4 ice plt 5 hail 6 glaze 7 duststm 8 smk, hz 9 blw snw 1 2 3 4A 4B 5 6 7 8 9 11
Regional Consultation on Climate Services at the National Level for South East Europe Antalya, Turkey November
 malsale@meteo.gov.vu Regional Consultation on Climate Services at the National Level for South East Europe Antalya, Turkey 21-22 November 2014 n.rudan@rhmzrs.com Capacities for the management of climatic
Colorado State University, Fort Collins, CO Weather Station Monthly Summary Report
 Colorado State University, Fort Collins, CO Weather Station Monthly Summary Report Month: January Year: 2019 Temperature: Mean T max was 47.2 F which is 3.0 above the 1981-2010 normal for the month. This
What makes it difficult to predict extreme climate events in the long time scales?
 What makes it difficult to predict extreme climate events in the long time scales? Monirul Mirza Department of Physical and Environmental Sciences University of Toronto at Scarborough Email: monirul.mirza@utoronto.ca
Drought and Climate Extremes Indices for the North American Drought Monitor and North America Climate Extremes Monitoring System. Richard R. Heim Jr.
 Drought and Climate Extremes Indices for the North American Drought Monitor and North America Climate Extremes Monitoring System Richard R. Heim Jr. NOAA/NESDIS/National Climatic Data Center Asheville,
Jackson County 2014 Weather Data
 Jackson County 2014 Weather Data 62 Years of Weather Data Recorded at the UF/IFAS Marianna North Florida Research and Education Center Doug Mayo Jackson County Extension Director 1952-2008 Rainfall Data
University of Florida Department of Geography GEO 3280 Assignment 3
 G E O 3 2 8 A s s i g n m e n t # 3 Page 1 University of Florida Department of Geography GEO 328 Assignment 3 Modeling Precipitation and Elevation Solar Radiation Precipitation Evapo- Transpiration Vegetation
National Climatic Data Center DATA DOCUMENTATION FOR DATA SET 6406 (DSI-6406) ASOS SURFACE 1-MINUTE, PAGE 2 DATA. July 12, 2006
 ASOS SURFACE 1-MINUTE, PAGE 2 DATA. July 12, 2006") DATA DOCUMENTATION FOR DATA SET 6406 (DSI-6406) ASOS SURFACE 1-MINUTE, PAGE 2 DATA July 12, 2006 151 Patton Ave. Asheville, NC 28801-5001 USA Table of Contents Topic Page Number 1. Abstract... 3 2. Element
DATA DOCUMENTATION FOR DATA SET 6406 (DSI-6406) ASOS SURFACE 1-MINUTE, PAGE 2 DATA July 12, 2006 151 Patton Ave. Asheville, NC 28801-5001 USA Table of Contents Topic Page Number 1. Abstract... 3 2. Element
Water Stress, Droughts under Changing Climate
 Water Stress, Droughts under Changing Climate Professor A.K.M. Saiful Islam Institute of Water and Flood Management Bangladesh University of Engineering and Technology (BUET) Outline of the presentation
The Climate of Murray County
 The Climate of Murray County Murray County is part of the Crosstimbers. This region is a transition between prairies and the mountains of southeastern Oklahoma. Average annual precipitation ranges from
The Climate of Seminole County
 The Climate of Seminole County Seminole County is part of the Crosstimbers. This region is a transition region from the Central Great Plains to the more irregular terrain of southeastern Oklahoma. Average
Sunshine duration climate maps of Belgium and Luxembourg based on Meteosat and in-situ observations
 Open Sciences doi:1.5194/asr-1-15-213 Author(s) 213. CC Attribution 3. License. Advances in Science & Research Open Access Proceedings Drinking Water Engineering and Science Sunshine duration climate maps
Future Climate Projection in Mainland Southeast Asia: Climate change scenario for 21 st century. Suppakorn Chinvanno
 Suppakorn Chinvanno Topics Climate change scenarios development Future Climate Projection in Mainland Southeast Asia: Climate change scenario for 21st century Climate change scenarios development in Thailand
The Climate of Texas County
 The Climate of Texas County Texas County is part of the Western High Plains in the north and west and the Southwestern Tablelands in the east. The Western High Plains are characterized by abundant cropland
AERMOD Sensitivity to AERSURFACE Moisture Conditions and Temporal Resolution. Paper No Prepared By:
 AERMOD Sensitivity to AERSURFACE Moisture Conditions and Temporal Resolution Paper No. 33252 Prepared By: Anthony J Schroeder, CCM Managing Consultant TRINITY CONSULTANTS 7330 Woodland Drive Suite 225
Jackson County 2013 Weather Data
 Jackson County 2013 Weather Data 61 Years of Weather Data Recorded at the UF/IFAS Marianna North Florida Research and Education Center Doug Mayo Jackson County Extension Director 1952-2008 Rainfall Data
 http://www.wrcc.dri.edu/csc/scenic/ USER GUIDE 2017 Introduction... 2 Overview Data... 3 Overview Analysis Tools... 4 Overview Monitoring Tools... 4 SCENIC structure and layout... 5... 5 Detailed Descriptions
Climate Change Indices By: I Putu Santikayasa
 Climate Change Indices By: I Putu Santikayasa Climate Change and Water Resources CE74.9002 Water Engineering and Management (WEM) School of Engineering and Technology (SET) Asian institute of Technology
Climate Dataset: Aitik Closure Project. November 28 th & 29 th, 2018
 1 Climate Dataset: Aitik Closure Project November 28 th & 29 th, 2018 Climate Dataset: Aitik Closure Project 2 Early in the Closure Project, consensus was reached to assemble a long-term daily climate
Linking Climate Prediction to Agricultural Models
 Linking Climate Prediction to Agricultural Models James Hansen International Research Institute for Climate Prediction This is a crucial current research question. Intuition suggests several options. We
Zachary Holden - US Forest Service Region 1, Missoula MT Alan Swanson University of Montana Dept. of Geography David Affleck University of Montana
 Progress modeling topographic variation in temperature and moisture for inland Northwest forest management Zachary Holden - US Forest Service Region 1, Missoula MT Alan Swanson University of Montana Dept.
Interpolation of weather generator parameters using GIS (... and 2 other methods)
") Interpolation of weather generator parameters using GIS (... and 2 other methods) M. Dubrovsky (1), D. Semeradova (2), L. Metelka (3), O. Prosova (3), M. Trnka (2) (1) Institute of Atmospheric Physics
Interpolation of weather generator parameters using GIS (... and 2 other methods) M. Dubrovsky (1), D. Semeradova (2), L. Metelka (3), O. Prosova (3), M. Trnka (2) (1) Institute of Atmospheric Physics
KEY WORDS: Palmer Meteorological Drought Index, SWAP, Kriging spatial analysis and Digital Map.
 PALMER METEOROLOGICAL DROUGHT CLASSIFICATION USING TECHNIQUES OF GEOGRAPHIC INFORMATION SYSTEM IN THAILAND S. Baimoung, W. Waranuchit, S. Prakanrat, P. Amatayakul, N. Sukhanthamat, A. Yuthaphan, A. Pyomjamsri,
CIMIS. California Irrigation Management Information System
 CIMIS California Irrigation Management Information System What is CIMIS? A network of over 130 fully automated weather stations that collect weather data throughout California and provide estimates of
Climpact2 and PRECIS
 Climpact2 and PRECIS WMO Workshop on Enhancing Climate Indices for Sector-specific Applications in the South Asia region Indian Institute of Tropical Meteorology Pune, India, 3-7 October 2016 David Hein-Griggs
What Does It Take to Get Out of Drought?
 What Does It Take to Get Out of Drought? Nolan J. Doesken Colorado Climate Center Colorado State University http://ccc.atmos.colostate.edu Presented at the Insects, Diseases and Drought Workshop, May 19,
Validation of the Weather Generator CLIGEN with Precipitation Data from Uganda. W. J. Elliot C. D. Arnold 1
 Validation of the Weather Generator CLIGEN with Precipitation Data from Uganda W. J. Elliot C. D. Arnold 1 9/19/00 ABSTRACT. Precipitation records from highland and central plains sites in Uganda were
The Climate of Haskell County
 The Climate of Haskell County Haskell County is part of the Hardwood Forest. The Hardwood Forest is characterized by its irregular landscape and the largest lake in Oklahoma, Lake Eufaula. Average annual
Extremes Events in Climate Change Projections Jana Sillmann
 Extremes Events in Climate Change Projections Jana Sillmann Max Planck Institute for Meteorology International Max Planck Research School on Earth System Modeling Temperature distribution IPCC (2001) Outline
FireFamilyPlus Version 5.0
 FireFamilyPlus Version 5.0 Working with the new 2016 NFDRS model Objectives During this presentation, we will discuss Changes to FireFamilyPlus Data requirements for NFDRS2016 Quality control for data
SIMULATION AND PREDICTION OF SUMMER MONSOON CLIMATE OVER THE INDOCHINA PENINSULA BY RSM
 2017 ACTS Workshop on Extreme Weather Forecast and Water Resources Management SIMULATION AND PREDICTION OF SUMMER MONSOON CLIMATE OVER THE INDOCHINA PENINSULA BY RSM Presenter: Nguyen Ngoc Bich Phuong
ClimateBC version history
 ClimateBC version history ClimateBC v5.60 (August 31, 2018) Improvements Historical monthly data from the Climate Research Unit (CRU ts4.01) for the years 1999-2016 have been replaced by our newly developed
Prediction of Monthly Rainfall of Nainital Region using Artificial Neural Network (ANN) and Support Vector Machine (SVM)
 and Support Vector Machine (SVM)") Vol- Issue-3 25 Prediction of ly of Nainital Region using Artificial Neural Network (ANN) and Support Vector Machine (SVM) Deepa Bisht*, Mahesh C Joshi*, Ashish Mehta** *Department of Mathematics **Department
Vol- Issue-3 25 Prediction of ly of Nainital Region using Artificial Neural Network (ANN) and Support Vector Machine (SVM) Deepa Bisht*, Mahesh C Joshi*, Ashish Mehta** *Department of Mathematics **Department
APPENDIX G-7 METEROLOGICAL DATA
 APPENDIX G-7 METEROLOGICAL DATA METEOROLOGICAL DATA FOR AIR AND NOISE SAMPLING DAYS AT MMR Monthly Normals and Extremes for Honolulu International Airport Table G7-1 MMR RAWS Station Hourly Data Tables
5. General Circulation Models
 5. General Circulation Models I. 3-D Climate Models (General Circulation Models) To include the full three-dimensional aspect of climate, including the calculation of the dynamical transports, requires
Introduction to Climatology. GEOG/ENST 2331: Lecture 1
 Introduction to Climatology GEOG/ENST 2331: Lecture 1 Us Graham Saunders graham.saunders@lakeheadu.ca Jason Freeburn (RC 2004) jtfreebu@lakeheadu.ca Graham Saunders Australian Weather Bureau Environment
Long term weather trends in Phaltan, Maharashtra. French intern at NARI, student from Ecole Centrale de Lyon, Ecully 69130, France.
 Long term weather trends in Phaltan, Maharashtra A. Jacob and Anil K. Rajvanshi French intern at NARI, student from Ecole Centrale de Lyon, Ecully 693, France. Director NARI, Nimbkar Agricultural Research
Weather to Climate Investigation: Snow
 Name: Date: Weather to Climate Investigation: Snow Guiding Questions: What are the historical and current weather patterns or events for a location in the United States? What are the long-term weather
Climate Summary for the Northern Rockies Adaptation Partnership
 Climate Summary for the Northern Rockies Adaptation Partnership Compiled by: Linda Joyce 1, Marian Talbert 2, Darrin Sharp 3, John Stevenson 4 and Jeff Morisette 2 1 USFS Rocky Mountain Research Station
Malawi. General Climate. UNDP Climate Change Country Profiles. C. McSweeney 1, M. New 1,2 and G. Lizcano 1
 UNDP Climate Change Country Profiles Malawi C. McSweeney 1, M. New 1,2 and G. Lizcano 1 1. School of Geography and Environment, University of Oxford. 2. Tyndall Centre for Climate Change Research http://country-profiles.geog.ox.ac.uk
Evapotranspiration and Irrigation Water Requirements for Washington State
 Evapotranspiration and Irrigation Water Requirements for Washington State R. Troy Peters, PE, PhD Extension Irrigation Specialist Washington State University Irrigated Ag. Research and Extension Cntr Prosser,
Zambia. General Climate. Recent Climate Trends. UNDP Climate Change Country Profiles. Temperature. C. McSweeney 1, M. New 1,2 and G.
 UNDP Climate Change Country Profiles Zambia C. McSweeney 1, M. New 1,2 and G. Lizcano 1 1. School of Geography and Environment, University of Oxford. 2. Tyndall Centre for Climate Change Research http://country-profiles.geog.ox.ac.uk
THE ROLE OF OCEAN STATE INDICES IN SEASONAL AND INTER-ANNUAL CLIMATE VARIABILITY OF THAILAND
 THE ROLE OF OCEAN STATE INDICES IN SEASONAL AND INTER-ANNUAL CLIMATE VARIABILITY OF THAILAND Manfred Koch and Werapol Bejranonda Department of Geohydraulics and Engineering Hydrology, University of Kassel,