Interpolation of weather generator parameters using GIS (... and 2 other methods)
|
|
|
- Alison Short
- 5 years ago
- Views:
Transcription
1 Interpolation of weather generator parameters using GIS (... and 2 other methods) M. Dubrovsky (1), D. Semeradova (2), L. Metelka (3), O. Prosova (3), M. Trnka (2) (1) Institute of Atmospheric Physics ASCR, Prague, Czechia (dub@ufa.cas.cz), (2) Institute of Landscape Ecology MAFU, Brno, Czechia, (3) Czech Hydrometeorological Institute, Hradec Kralove, Czechia Acknowledgement: sponsored by the Grant Agency of the Czech Republic, project 205/05/2265

2 Abstract Weather generators (WG) are often used in agricultural and hydrological studies to supply crop models or raifall-runoff models with synthetic weather series representing present or future climate. Typically, WG parameters are derived from the observed series in a given station. CaliM&Ro project is focused on calibrating a stochastic single-site daily weather generator Met&Roll for sites with non-existent or insufficient historical daily weather series. Interpolation of WG parameters from the surrounding stations is used here to calibrate the generator for the ungauged station. Selected WG parameters are interpolated using GIS (ArcView), neural network and nearest-neighbours-based interpolation technique. The tests are based on observational data from 125 stations in Czechia.
3 Met&Roll weather generator Met&Roll is a single-site 4-variate stochastic daily weather generator. variables: model: - precipitation amount (PREC) - daily temperature maximum (TMAX) - daily temperature minimum (TMIN) - global solar radiation (SRAD) - precipitation occurrence ~ Markov chain of 1 st to 3 rd order (parameters: transition probabilities) - precipitation amount ~ Gamma distribution (parameters: α, β) - (SRAD, TMAX, TMIN) ~ 3-variate 1st order AR model (parameters: means and std s /separately for wet and dry days/ of the three variables; two 3 3 matrices representing lag-0 and lag-1 covariances among the 3 variables) - daily weather generator is linked to the 1 st order AR model-based monthly generator (parameters: two 4 4 matrices) - most parameters of the generator account for the annual cycle Met&Roll has been mainly used in agricultural studies [see references] dealing with sensitivity of crop yields to changes in climatic characteristics, including impact of the future climate change. It is also implemented in the PERUN system designed for climate change impact studies and probabilistic crop yields forecasting. Within the present project, a new system (M&Rwin) is being developed. This system links Met&Roll with crop models (now available are WOFOST and CERES models) and hydrological model Sacramento. Climate change scenarios and interpolation of WG parameters is implemented in this system, too.
4 GIS GIS is a system designed to capture, store, update, manipulate, analyze, and display the geographic information. ArcGIS is an integrated collection of GIS software products for handling spatial data, developed by Environmental Systems Research Institute (ESRI). For interpolation of selected WG parameters the Geostatistical Analyst (GA) extension of the version ArcView 9.1. were used, which provides a set of tools to create a continuous surface using deterministic and geostatistical methods. For this study geostatistical techniques (Kriging, Cokriging) based on both statistical and mathematical methods were selected. Kriging methods rely on the notion of autocorrelation as a function of distance. Predicted value depends on two factors: a trend and a fluctuation from the trend, called spatially-autocorrelated random error. Cokriging improves surface prediction of a primary variable by taking into account secondary variables, provided that the primary and secondary variables are spatially correlated. In first step the spatial data variability, spatial data dependence, and global trends were explored using Exploratory spatial data analysis tools included with GA. This phase helps to select an appropriate model to create a surface. In the next step diagnostics were performed to assess the uncertainty of the predictions. Subsequently various analytical tools and calculated statistics allow to compare models if more than one surface is produced.
5 Neural Networks Neural networks (NNs) are inspired by the signal processing in the biological neural systems. Artificial NN is composed from a network of individual neurons. Each neuron receives a number of inputs (either from original data, or from the output of other neurons. Each input comes via a connection (synapse) that has a strength (or weight, which corresponds to synaptic efficacy in a biological neuron) and a single threshold value. The weighted sum of the inputs minus threshold composes the activation of the neuron (= postsynaptic potential of the neuron). The activation signal is then passed through a non-linear activation function (= transfer function) to produce the output of the neuron. A simple network has a feedforward structure: signals flow from inputs (which carry the signal of independent variables), forwards through hidden units, eventually reaching the output units (which form predictions or dependent variables values). Quasi-optimal values of network free parameters (synaptic weights, neuron thresholds) are fixed during iterative training from randomly generated initial state of the network, several training algorithms are available. Trained neural network should mirror general features of training data (relations between independent and dependent variables, classification, etc.) and may be used for processing new cases. The maps shown here were made using the ensemble generalization: The network was repeatedly (50-times) trained with different network initialization and different data division into training and selection subsets. Final interpolated values are the mean values of all 50 individual models (ensemble members). [network type = 3-3-1, 19 degrees of freedom] [StatSoft, Inc. (2006). Electronic Statistics Textbook. Tulsa, OK: StatSoft.
6 Nearest Neighbours In this approach, the interpolated value X i^ is defined as a weighted average of observed values of parameter X related to the nearest stations with applying a correction for differences in latitude, longitude and altitude: X i^(λ,φ,h) = j=1,..,k w ij [X(λ j,φ j,h j ) + b (φ φ j ) + c (λ λ j ) + d (z z j )] where - w ij is weight accounting for the distance d ij between the two stations: w ij = [1 (d ij /D) 3 ] 3 ] for d ij < D, w ij = 0 for d ij > D - b, c, d are parameters of the tri-variate linear regression model (X = a + b φ + c λ + d z), which are estimated using data from all available stations (except for the one, for which we interpolate during the cross-validation test) - D defines the surroundings of the location for which we interpolate. The value of D is a subject of optimisation. We found, that D~100 km is optimal for the present experiment. This technique requires an access to the database of the station-specific values of all WG parameters.
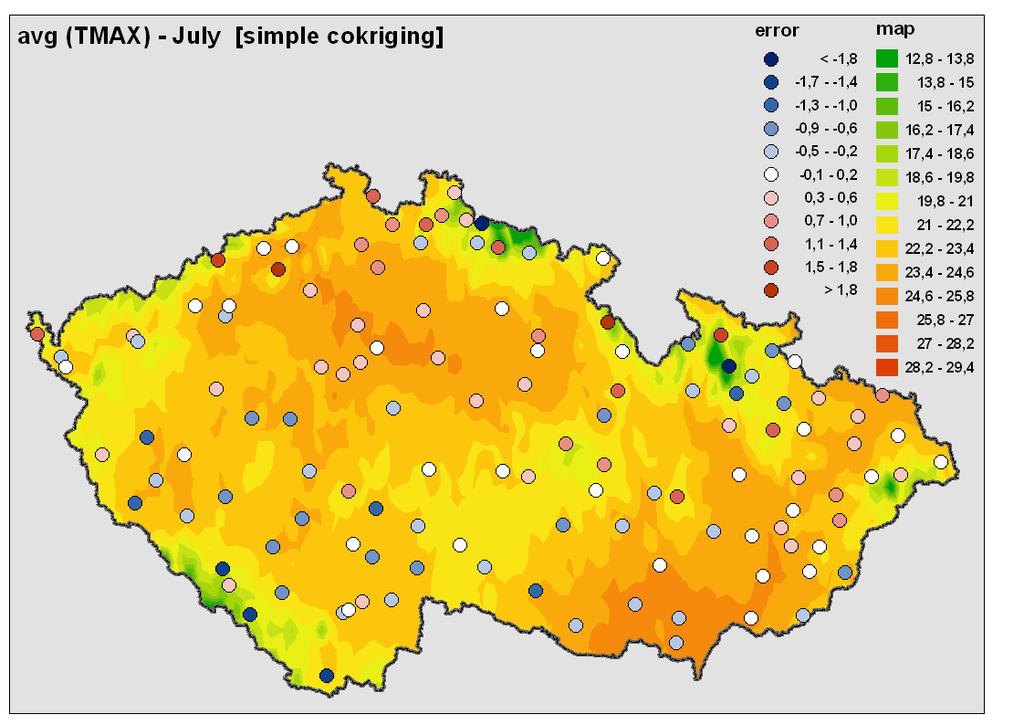
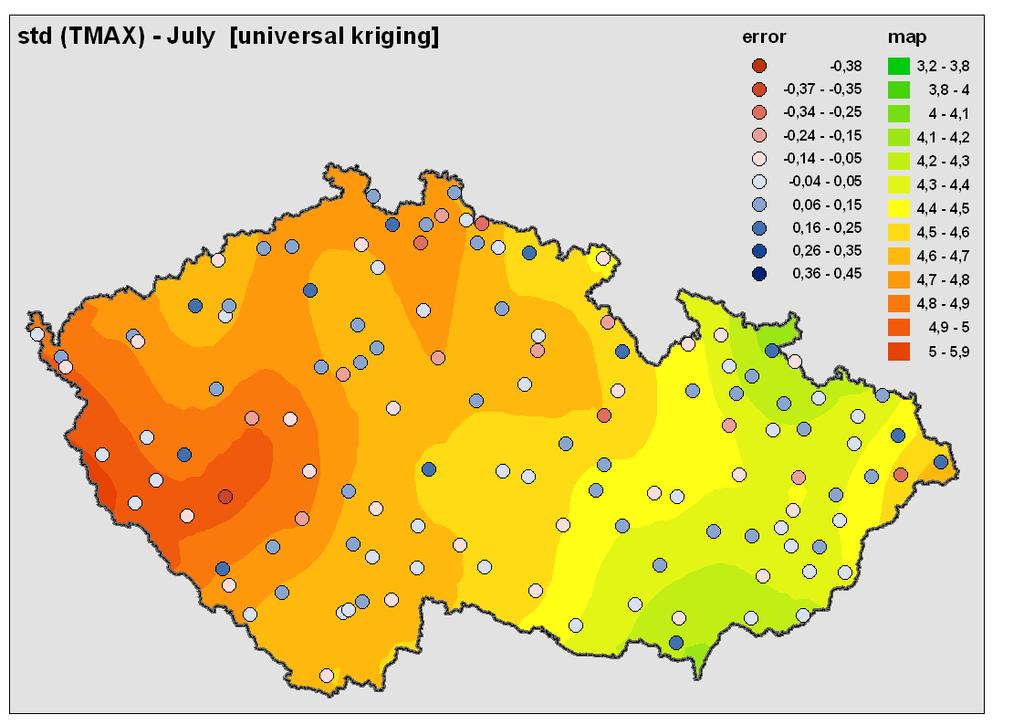
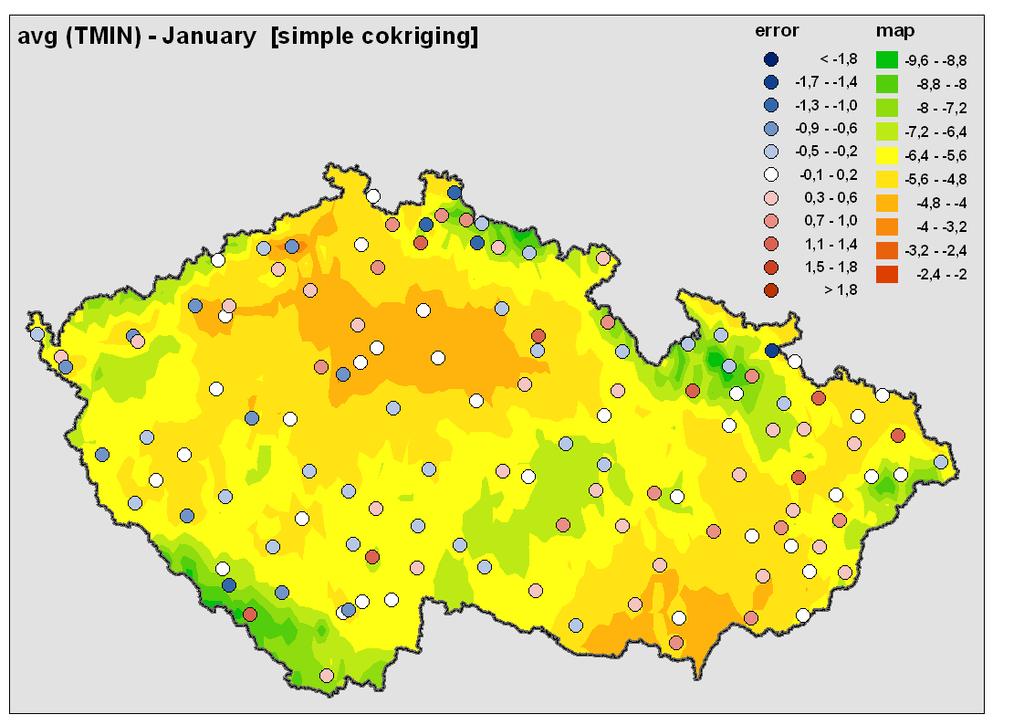
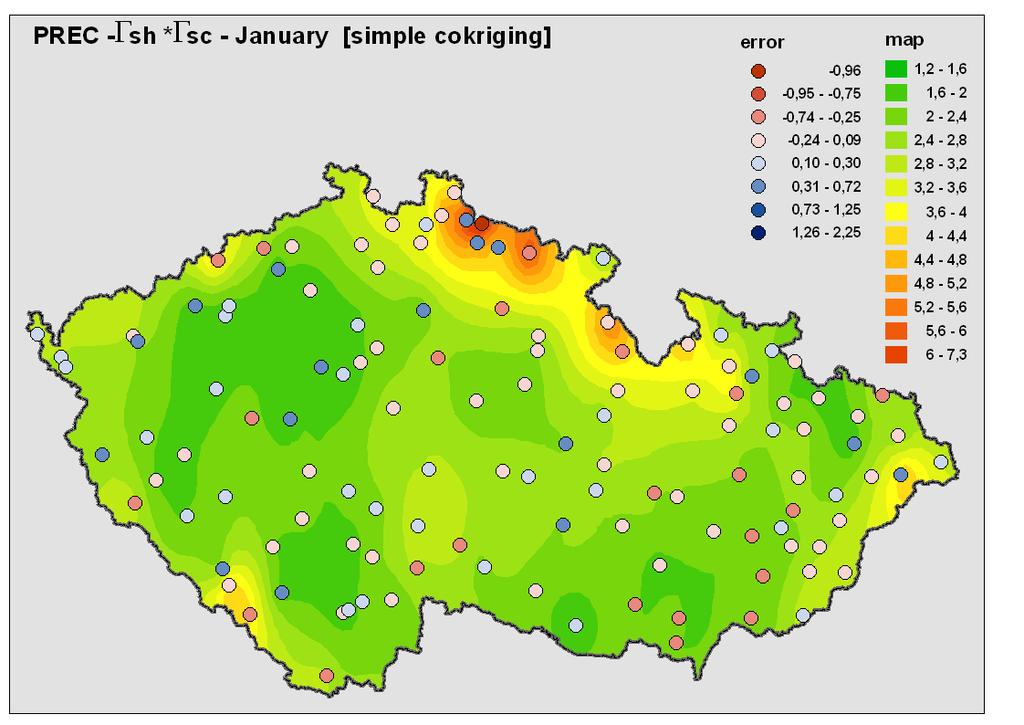
7 Data - Weather data: 125 stations from Czechia with data coverage greater or equal to 75% during (= at least 75% of terms have observed values of TMAX, TMIN, PREC, and CLOUD or SUNSHINE used to estimate SRAD) [location of the stations and their altitude is displayed in Figure 1] - Topography of Czechia is derived from the global digital elevation model GTOPO30 (horizontal grid spacing = 30 arc seconds; i.e. approximately m resolution within the territory of Czechia) [ Experiment A complete set of the Met&Roll s parameters for a single station includes a large number of characteristics, mostly accounting for the annual cycle. Of these, 26 parameters were selected for the present experiment (Table I). 1) Data from all 125 stations were used for mapping individual WG parameters into grid using the GTOPO30 topography. 2) In cross-validation test (station-specific errors are shown in the Figures, summary statistics are given in Table I), WG parameters for each station are interpolated using WG data from the remaining 124 station and the station-specific altitude.
8 Conclusions The poster presents the first results of experiments with interpolating weather generator parameters. 3 interpolation techniques were tested: (i) co-kriging (using GIS), (ii) neural networks, (iii) nearest neighbours. Following the validation scores given in Table I, one could deduce that: - GIS appears to provide the best results, but: the RV and RMSE scores given in the table for this technique are overestimated (RV) and underestimated (RMSE), as the settings of the interpolation procedure for each single WG parameter was optimised using all 125 stations. - nearest neighbours provide slightly better results compared to neural network. But: (i) to use the nearest neighbours, all learning data must be available during interpolation into ungauged stations (in contrast with neural network, which do not need access to learning data after being trained). (ii) Both interpolation techniques may be subject of further improvements. Let s not be hasty! - some WG parameters are successfully interpolated [e.g.mean values of TMAX, TMIN and mean precipitation amount on wet days (= Γsh Γsc)], which follows from their close relationships with latitude+longitude+altitude as inditated by r 2 value. Plans for future (within the frame of CaliM&Ro project): - more detailed validation of the interpolation techniques [(i) with using unbiased skill scores for co-kriging, (ii) trying to further improve neural networks and nearest neighbours interpolators, (iii) involve other WG parameters] - to test how the interpolated weather generator reproduces various climatic characteristics (means, variability, extremes, heat/cold/dry/wet spells,...) - to use synthetic series generated by interpolated weather generator as an input to crop models and hydrological rainfall-runoff model. Output from these models will be compared with the output obtained with using generator calibrated by the site-specific observational data.
9 References [1] Dubrovský, M., 1997: Creating Daily Weather Series with Use of the Weather Generator, Environmetrics 8, [2] Buchtele, J., Buchtelová, M., Fořtová, M., and Dubrovský, M., 1999: Runoff Changes in Czech River Basins - the Outputs of Rainfall-Runoff Simulations Using Different Climate Change Scenarios, J. Hydrol. Hydromech., 47, [3] Dubrovský M., Zalud Z. and Stastna M., 2000: Sensitivity of CERES-Maize yields to statistical structure of daily weather series. Climatic Change 46, [4] Huth R., Kyselý J., Dubrovský M., 2001: Time structure of observed, GCM-simulated, downscaled, and stochastically generated daily temperature series. Journal of Climate, 14, [5] Žalud Z., Dubrovský M., 2002: Modelling climate change impacts on maize growth and development in the Czech republic. Theoretical and Applied Climatology, 72, [6] Huth R., Kyselý J., Dubrovský M., 2003: Simulation of Surface Air Temperature by GCMs, Statistical Downscaling and Weather Generator: Higher- Order Statistical Moments. Studia Geophysica et Geodaetica 47, [7] Hejzlar J., Dubrovský M., Buchtele J. and Růžička M., 2003: The effect of climate change on the concentration of dissolved organic matter in a temperate stream (the Malše River, South Bohemia). Science of Total Environment [8] Dubrovský M., Buchtele J., Žalud Z., 2004: High-Frequency and Low-Frequency Variability in Stochastic Daily Weather Generator and Its Effect on Agricultural and Hydrologic Modelling. Climatic Change 63 (No.1-2), [9] Trnka M., Dubrovský M., Semerádova D., Žalud Z., 2004: Projections of uncertainties in climate change scenarios into expected winter wheat yields. Theoretical and Applied Climatology, 77, [10] Trnka M., Dubrovský M., Žalud Z., 2004: Climate Change Impacts and Adaptation Strategies in Spring Barley Production in the Czech Republic. Climatic Change 64 (No. 1-2), [11] Kyselý J., Dubrovský M., 2005: Simulation of extreme temperature events by a stochastic weather generator: effects of interdiurnal and interannual variability reproduction. Int.J.Climatol. 25,

10 Figure 1 Topography of Czechia and location of the 125 stations used for interpolation. Altitude of the stations is represented by a colour according to the scale
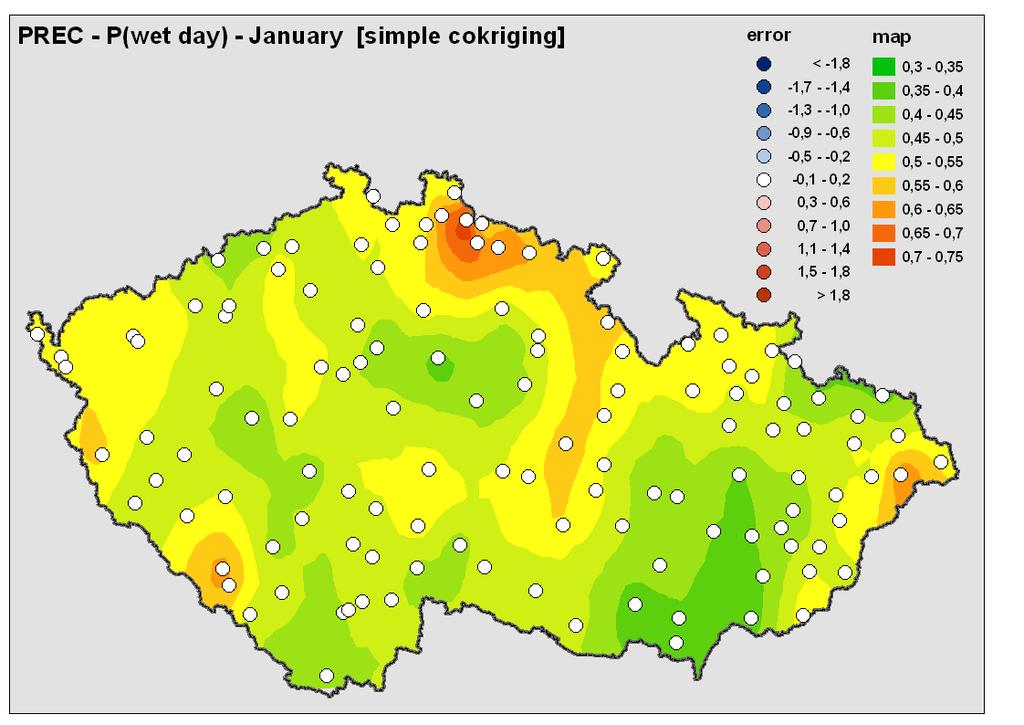
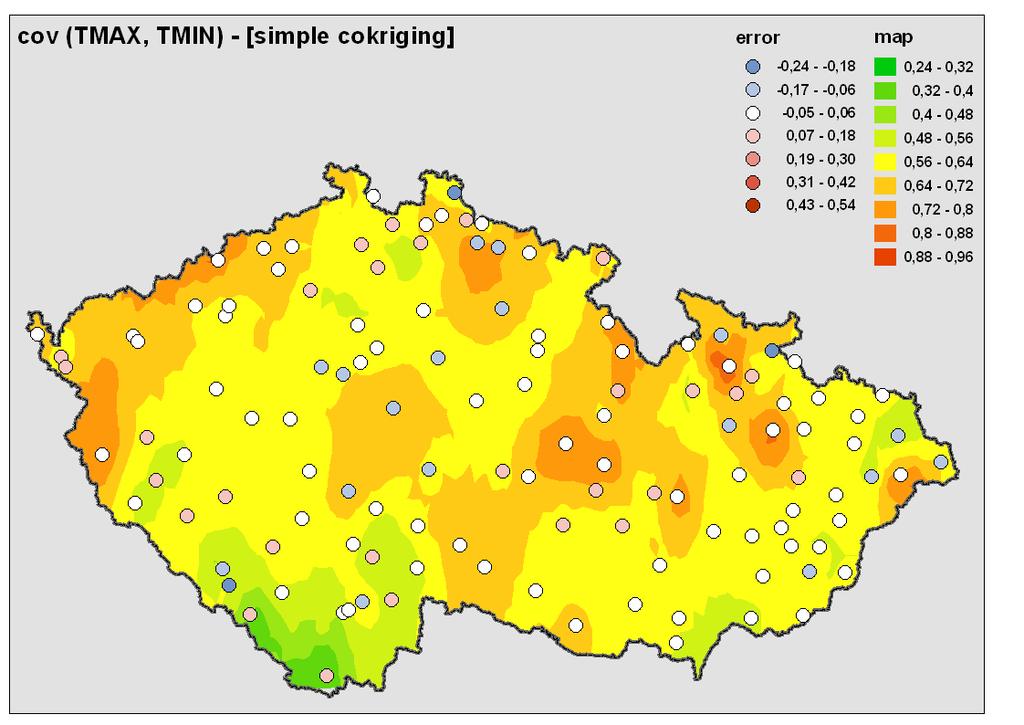
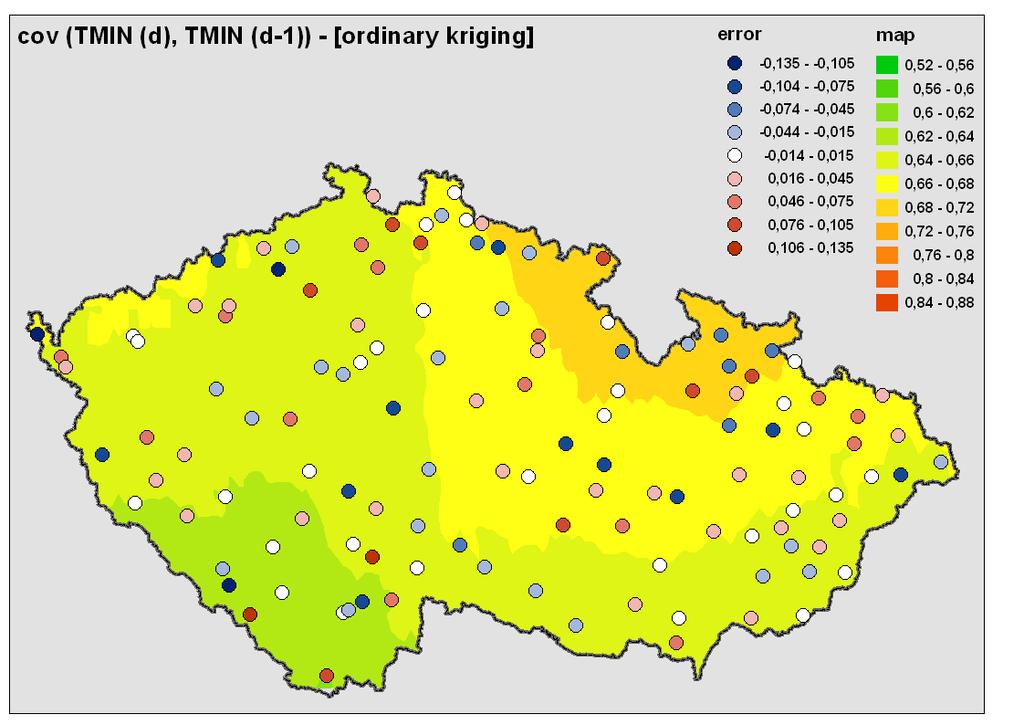
11 Table I. Summary of WG parameters characteristics (average, standard deviation, minimum and maximum from the set of 125 stations) and results of the cross-validation of the three interpolation techniques Fig. avg std min max r2 (λ,φ,z) Neural Network Nearest Neighbours co-kriging RMSE RV[%] RMSE RV[%] RMSE RV[%] a) Solar radiation avg, January avg, July std, January std, July b) Daily temperature maximum avg, January avg, July std*, January std*, July c) Daily temperature minimum 4 avg, January avg, July std, January std, July d) Precipitation Γsh, January Γsh, July Γsh Γsc, Jan Γsh Γsc, July Pwet, January Pwet, July Pwd, January Pwd, July e) lag-0 and lag-1 covariances among SRAD*, TMAX* and TMIN* cov(srad*,tmax*) cov(srad*,tmin*) cov(tmax*,tmin*) lag-1-cov(srad*) lag-1-cov(tmax*) lag-1-cov(tmin*) legend: - r2(λ,φ,z) = multiple correlation coefficient of WG parameter with λ, φ, z - RMSE = Root mean square error - RV = reduction of variance - std* = standard deviation of the deviations from a mean annual cycle - Γsh, Γsc = shape and scale parameters of Gamma distribution (product of the two parameters equals the mean of the Gamma-distributed variable - Pwet = probability of wet day occurrence - Pwd = transition probability of wet day occurrence given the previous day was dry - lag-1-cov = lag-1day covariance; e.g. lag-1-cov(tmax*) = cov(tmax*(d), TMAX*(d-1)) - SRAD*, TMAX*, TMIN* = standardised values of SRAD, TMAX, and TMIN. For standardisation, the averages and std.deviations relate to a given Julian day and for either wet or dry day
")
12 Fig. 2. avg(tmax) July
13
")
14 Fig. 3. std(tmax) July
15
")
16 Fig. 4. avg(tmin) January
17


18 Fig. 5. PREC Γshape Γscale January
19

")
20 Fig. 6. PREC: Prob(wet day) January
21
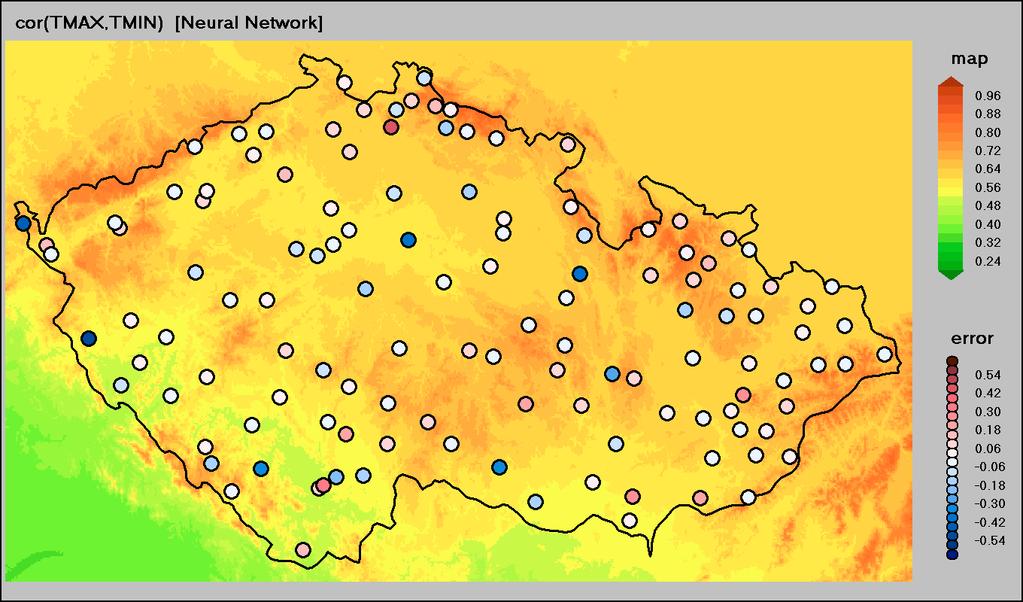
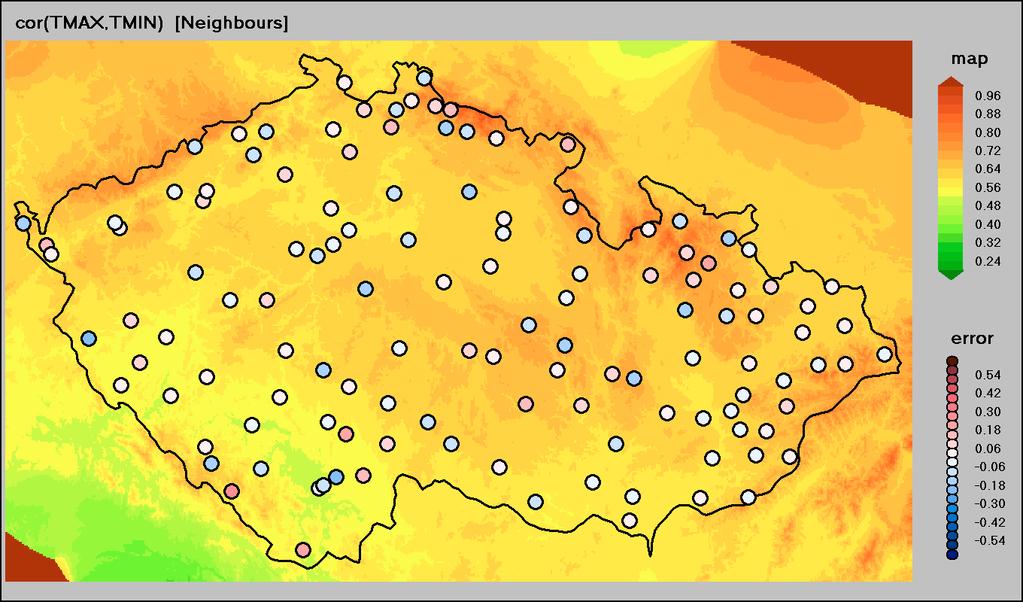
22 Fig. 7. cov(tmax*,tmin*)
23
,")
24 Fig. 8. cov(tmax*(d), TMAX*(d-1))
25
,")
26 Fig. 9. cov(tmin*(d), TMIN*(d-1))
27
Reproduction of precipitation characteristics. by interpolated weather generator. M. Dubrovsky (1), D. Semeradova (2), L. Metelka (3), M.
, D. Semeradova (2), L. Metelka (3), M.") Reproduction of precipitation characteristics by interpolated weather generator M. Dubrovsky (1), D. Semeradova (2), L. Metelka (3), M. Trnka (2) (1) Institute of Atmospheric Physics ASCR, Prague, Czechia
Reproduction of precipitation characteristics by interpolated weather generator M. Dubrovsky (1), D. Semeradova (2), L. Metelka (3), M. Trnka (2) (1) Institute of Atmospheric Physics ASCR, Prague, Czechia
Martin Dubrovský (1), Ladislav Metelka (2), Miroslav Trnka (3), Martin Růžička (4),
, Ladislav Metelka (2), Miroslav Trnka (3), Martin Růžička (4),") The CaliM&Ro Project: Calibration of Met&Roll Weather Generator for sites without or with incomplete meteorological observations Martin Dubrovský (1), Ladislav Metelka (2), Miroslav Trnka (3), Martin Růžička
The CaliM&Ro Project: Calibration of Met&Roll Weather Generator for sites without or with incomplete meteorological observations Martin Dubrovský (1), Ladislav Metelka (2), Miroslav Trnka (3), Martin Růžička
Reproduction of extreme temperature and precipitation events by two stochastic weather generators
 Reproduction of extreme temperature and precipitation events by two stochastic weather generators Martin Dubrovský and Jan Kyselý Institute of Atmospheric Physics ASCR, Prague, Czechia (dub@ufa.cas.cz,
Linking the climate change scenarios and weather generators with agroclimatological models
 Linking the climate change scenarios and weather generators with agroclimatological models Martin Dubrovský (IAP Prague) & Miroslav Trnka, Zdenek Zalud, Daniela Semeradova, Petr Hlavinka, Eva Kocmankova,
Application of Stochastic Weather Generators in Crop Growth Modelling
 Application of Stochastic Weather Generators in Crop Growth Modelling M&Rtin Dubrovsky 1,2 & Miroslav Trnka 2,1 + the rest of MUAF team (Zdenek Zalud, Daniela Semeradova, Petr Hlavinka) 1,2 IAP (Institute
Comparison of two interpolation methods for modelling crop yields in ungauged locations
 Comparison of two interpolation methods for modelling crop yields in ungauged locations M. Dubrovsky (1), M. Trnka (2), F. Rouget (3), P. Hlavinka (2) (1) Institute of Atmospheric Physics ASCR, Prague,
PERUN: THE SYSTEM FOR SEASONAL CROP YIELD FORECASTING BASED ON THE CROP MODEL AND WEATHER GENERATOR
 XXVII General Assembly of EGS *** Nice, France *** 21-26 April 2002 1 PERUN: THE SYSTEM FOR SEASONAL CROP YIELD FORECASTING BASED ON THE CROP MODEL AND WEATHER GENERATOR Martin Dubrovský (1), Zdeněk Žalud
Downscaling in Time. Andrew W. Robertson, IRI. Advanced Training Institute on Climate Variability and Food Security, 12 July 2002
 Downscaling in Time Andrew W. Robertson, IRI Advanced Training Institute on Climate Variability and Food Security, 12 July 2002 Preliminaries Crop yields are driven by daily weather variations! Current
Utilization of seasonal climate predictions for application fields Yonghee Shin/APEC Climate Center Busan, South Korea
 The 20 th AIM International Workshop January 23-24, 2015 NIES, Japan Utilization of seasonal climate predictions for application fields Yonghee Shin/APEC Climate Center Busan, South Korea Background Natural
Uncertainties in multi-model climate projections
 *** EMS Annual Meeting *** 28.9. 2.10.2009 *** Toulouse *** Uncertainties in multi-model climate projections Martin Dubrovský Institute of Atmospheric Physics ASCR, Prague, Czech Rep. The study is supported
SIMULATION OF EXTREME TEMPERATURE EVENTS BY A STOCHASTIC WEATHER GENERATOR: EFFECTS OF INTERDIURNAL AND INTERANNUAL VARIABILITY REPRODUCTION
 INTERNATIONAL JOURNAL OF CLIMATOLOGY Int. J. Climatol. 25: 251 269 (2005) Published online in Wiley InterScience (www.interscience.wiley.com). DOI: 10.1002/joc.1120 SIMULATION OF EXTREME TEMPERATURE EVENTS
Reduced Overdispersion in Stochastic Weather Generators for Statistical Downscaling of Seasonal Forecasts and Climate Change Scenarios
 Reduced Overdispersion in Stochastic Weather Generators for Statistical Downscaling of Seasonal Forecasts and Climate Change Scenarios Yongku Kim Institute for Mathematics Applied to Geosciences National
Gridding of precipitation and air temperature observations in Belgium. Michel Journée Royal Meteorological Institute of Belgium (RMI)
") Gridding of precipitation and air temperature observations in Belgium Michel Journée Royal Meteorological Institute of Belgium (RMI) Gridding of meteorological data A variety of hydrologic, ecological,
Gridding of precipitation and air temperature observations in Belgium Michel Journée Royal Meteorological Institute of Belgium (RMI) Gridding of meteorological data A variety of hydrologic, ecological,
Temporal validation Radan HUTH
 Temporal validation Radan HUTH Faculty of Science, Charles University, Prague, CZ Institute of Atmospheric Physics, Prague, CZ What is it? validation in the temporal domain validation of temporal behaviour
11.4 AGRICULTURAL PESTS UNDER FUTURE CLIMATE CONDITIONS: DOWNSCALING OF REGIONAL CLIMATE SCENARIOS WITH A STOCHASTIC WEATHER GENERATOR
 11.4 AGRICULTURAL PESTS UNDER FUTURE CLIMATE CONDITIONS: DOWNSCALING OF REGIONAL CLIMATE SCENARIOS WITH A STOCHASTIC WEATHER GENERATOR Christoph Spirig 1, Martin Hirschi 1, Mathias W. Rotach 1,5, Martin
A Framework for Daily Spatio-Temporal Stochastic Weather Simulation
 A Framework for Daily Spatio-Temporal Stochastic Weather Simulation, Rick Katz, Balaji Rajagopalan Geophysical Statistics Project Institute for Mathematics Applied to Geosciences National Center for Atmospheric
Climate Change Impact Analysis
 Climate Change Impact Analysis Patrick Breach M.E.Sc Candidate pbreach@uwo.ca Outline July 2, 2014 Global Climate Models (GCMs) Selecting GCMs Downscaling GCM Data KNN-CAD Weather Generator KNN-CADV4 Example
Stochastic decadal simulation: Utility for water resource planning
 Stochastic decadal simulation: Utility for water resource planning Arthur M. Greene, Lisa Goddard, Molly Hellmuth, Paula Gonzalez International Research Institute for Climate and Society (IRI) Columbia
Stochastic Hydrology. a) Data Mining for Evolution of Association Rules for Droughts and Floods in India using Climate Inputs
 Data Mining for Evolution of Association Rules for Droughts and Floods in India using Climate Inputs") Stochastic Hydrology a) Data Mining for Evolution of Association Rules for Droughts and Floods in India using Climate Inputs An accurate prediction of extreme rainfall events can significantly aid in policy
Stochastic Hydrology a) Data Mining for Evolution of Association Rules for Droughts and Floods in India using Climate Inputs An accurate prediction of extreme rainfall events can significantly aid in policy
Impacts of climate change on flooding in the river Meuse
 Impacts of climate change on flooding in the river Meuse Martijn Booij University of Twente,, The Netherlands m.j.booij booij@utwente.nlnl 2003 in the Meuse basin Model appropriateness Appropriate model
What is one-month forecast guidance?
 What is one-month forecast guidance? Kohshiro DEHARA (dehara@met.kishou.go.jp) Forecast Unit Climate Prediction Division Japan Meteorological Agency Outline 1. Introduction 2. Purposes of using guidance
Met Éireann Climatological Note No. 15 Long-term rainfall averages for Ireland,
 Met Éireann Climatological Note No. 15 Long-term rainfall averages for Ireland, 1981-2010 Séamus Walsh Glasnevin Hill, Dublin 9 2016 Disclaimer Although every effort has been made to ensure the accuracy
Hydrologic Response of SWAT to Single Site and Multi- Site Daily Rainfall Generation Models
 Hydrologic Response of SWAT to Single Site and Multi- Site Daily Rainfall Generation Models 1 Watson, B.M., 2 R. Srikanthan, 1 S. Selvalingam, and 1 M. Ghafouri 1 School of Engineering and Technology,
Spatial interpolation of sunshine duration in Slovenia
 Meteorol. Appl. 13, 375 384 (2006) Spatial interpolation of sunshine duration in Slovenia doi:10.1017/s1350482706002362 Mojca Dolinar Environmental Agency of the Republic of Slovenia, Meteorological Office,
Hierarchical models for the rainfall forecast DATA MINING APPROACH
 Hierarchical models for the rainfall forecast DATA MINING APPROACH Thanh-Nghi Do dtnghi@cit.ctu.edu.vn June - 2014 Introduction Problem large scale GCM small scale models Aim Statistical downscaling local
Comparison of Interpolation Methods for Precipitation Data in a mountainous Region (Upper Indus Basin-UIB)
") Comparison of Interpolation Methods for Precipitation Data in a mountainous Region (Upper Indus Basin-UIB) AsimJahangir Khan, Doctoral Candidate, Department of Geohydraulicsand Engineering Hydrology, University
Comparison of Interpolation Methods for Precipitation Data in a mountainous Region (Upper Indus Basin-UIB) AsimJahangir Khan, Doctoral Candidate, Department of Geohydraulicsand Engineering Hydrology, University
Adaptation for global application of calibration and downscaling methods of medium range ensemble weather forecasts
 Adaptation for global application of calibration and downscaling methods of medium range ensemble weather forecasts Nathalie Voisin Hydrology Group Seminar UW 11/18/2009 Objective Develop a medium range
Section 2.2 RAINFALL DATABASE S.D. Lynch and R.E. Schulze
 Section 2.2 RAINFALL DATABASE S.D. Lynch and R.E. Schulze Background to the Rainfall Database The rainfall database described in this Section derives from a WRC project the final report of which was titled
DETECTION AND FORECASTING - THE CZECH EXPERIENCE
 1 STORM RAINFALL DETECTION AND FORECASTING - THE CZECH EXPERIENCE J. Danhelka * Czech Hydrometeorological Institute, Prague, Czech Republic Abstract Contribution presents the state of the art of operational
Improvements of stochastic weather data generators for diverse climates
 CLIMATE RESEARCH Vol. 14: 75 87, 2000 Published March 20 Clim Res Improvements of stochastic weather data generators for diverse climates Henry N. Hayhoe* Eastern Cereal and Oilseed Research Centre, Research
A Comparison of Rainfall Estimation Techniques
 A Comparison of Rainfall Estimation Techniques Barry F. W. Croke 1,2, Juliet K. Gilmour 2 and Lachlan T. H. Newham 2 SUMMARY: This study compares two techniques that have been developed for rainfall and
SELECTED METHODS OF DROUGHT EVALUATION IN SOUTH MORAVIA AND NORTHERN AUSTRIA
 SELECTED METHODS OF DROUGHT EVALUATION IN SOUTH MORAVIA AND NORTHERN AUSTRIA Miroslav Trnka 1, Daniela Semerádová 1, Josef Eitzinger 2, Martin Dubrovský 3, Donald Wilhite 4, Mark Svoboda 4, Michael Hayes
Postprocessing of Numerical Weather Forecasts Using Online Seq. Using Online Sequential Extreme Learning Machines
 Postprocessing of Numerical Weather Forecasts Using Online Sequential Extreme Learning Machines Aranildo R. Lima 1 Alex J. Cannon 2 William W. Hsieh 1 1 Department of Earth, Ocean and Atmospheric Sciences
Ultra-High Resolution Time Traveling AgMet Information from Seeding to Harvesting
 Ultra-High Resolution Time Traveling AgMet Information from Seeding to Harvesting - seamless data for prospect estimation of crop yields - Dec. 5, 2016 Jai-ho Oh & Kyung-Min Choi Dept. Env. & Atmos. Sci.,
Chiang Rai Province CC Threat overview AAS1109 Mekong ARCC
 Chiang Rai Province CC Threat overview AAS1109 Mekong ARCC This threat overview relies on projections of future climate change in the Mekong Basin for the period 2045-2069 compared to a baseline of 1980-2005.
Local Prediction of Precipitation Based on Neural Network
 Environmental Engineering 10th International Conference eissn 2029-7092 / eisbn 978-609-476-044-0 Vilnius Gediminas Technical University Lithuania, 27 28 April 2017 Article ID: enviro.2017.079 http://enviro.vgtu.lt
Appendix D. Model Setup, Calibration, and Validation
 . Model Setup, Calibration, and Validation Lower Grand River Watershed TMDL January 1 1. Model Selection and Setup The Loading Simulation Program in C++ (LSPC) was selected to address the modeling needs
AN OVERVIEW OF ENSEMBLE STREAMFLOW PREDICTION STUDIES IN KOREA
 AN OVERVIEW OF ENSEMBLE STREAMFLOW PREDICTION STUDIES IN KOREA DAE-IL JEONG, YOUNG-OH KIM School of Civil, Urban & Geosystems Engineering, Seoul National University, San 56-1, Sillim-dong, Gwanak-gu, Seoul,
The Analysis of Uncertainty of Climate Change by Means of SDSM Model Case Study: Kermanshah
 World Applied Sciences Journal 23 (1): 1392-1398, 213 ISSN 1818-4952 IDOSI Publications, 213 DOI: 1.5829/idosi.wasj.213.23.1.3152 The Analysis of Uncertainty of Climate Change by Means of SDSM Model Case
Water Balance in the Murray-Darling Basin and the recent drought as modelled with WRF
 18 th World IMACS / MODSIM Congress, Cairns, Australia 13-17 July 2009 http://mssanz.org.au/modsim09 Water Balance in the Murray-Darling Basin and the recent drought as modelled with WRF Evans, J.P. Climate
STOCHASTIC MODELING OF ENVIRONMENTAL TIME SERIES. Richard W. Katz LECTURE 5
 STOCHASTIC MODELING OF ENVIRONMENTAL TIME SERIES Richard W Katz LECTURE 5 (1) Hidden Markov Models: Applications (2) Hidden Markov Models: Viterbi Algorithm (3) Non-Homogeneous Hidden Markov Model (1)
AGROCLIMATOLOGICAL MODEL CLIMEX AND ITS APPLICATION FOR MAPPING OF COLORADO POTATO BEATLE OCCURRENCE
 AGROCLIMATOLOGICAL MODEL CLIMEX AND ITS APPLICATION FOR MAPPING OF COLORADO POTATO BEATLE OCCURRENCE E. Kocmánková 1, M. Trnka 1, Z. Žalud 1 and M. Dubrovský 2 1 Institute of Agrosystems and Bioclimatology,
Enabling Climate Information Services for Europe
 Enabling Climate Information Services for Europe Report DELIVERABLE 6.5 Report on past and future stream flow estimates coupled to dam flow evaluation and hydropower production potential Activity: Activity
MeteoSwiss Spatial Climate Analyses: Documentation of Datasets for Users
 Federal Department of Home Affairs FDHA Federal Office of Meteorology and Climatology MeteoSwiss MeteoSwiss Spatial Climate Analyses: Documentation of Datasets for Users Figure 1: Distribution of the 48-hour
Seasonal forecasting of climate anomalies for agriculture in Italy: the TEMPIO Project
 Seasonal forecasting of climate anomalies for agriculture in Italy: the TEMPIO Project M. Baldi(*), S. Esposito(**), E. Di Giuseppe (**), M. Pasqui(*), G. Maracchi(*) and D. Vento (**) * CNR IBIMET **
Geog 210C Spring 2011 Lab 6. Geostatistics in ArcMap
 Geog 210C Spring 2011 Lab 6. Geostatistics in ArcMap Overview In this lab you will think critically about the functionality of spatial interpolation, improve your kriging skills, and learn how to use several
Projected Change in Climate Under A2 Scenario in Dal Lake Catchment Area of Srinagar City in Jammu and Kashmir
 Current World Environment Vol. 11(2), 429-438 (2016) Projected Change in Climate Under A2 Scenario in Dal Lake Catchment Area of Srinagar City in Jammu and Kashmir Saqib Parvaze 1, Sabah Parvaze 2, Sheeza
Texas A&M University. Zachary Department of Civil Engineering. Instructor: Dr. Francisco Olivera. CVEN 658 Civil Engineering Applications of GIS
 1 Texas A&M University Zachary Department of Civil Engineering Instructor: Dr. Francisco Olivera CVEN 658 Civil Engineering Applications of GIS The Use of ArcGIS Geostatistical Analyst Exploratory Spatial
Climate change analysis in southern Telangana region, Andhra Pradesh using LARS-WG model
 Climate change analysis in southern Telangana region, Andhra Pradesh using LARS-WG model K. S. Reddy*, M. Kumar, V. Maruthi, B. Umesha, Vijayalaxmi and C. V. K. Nageswar Rao Central Research Institute
Regional Climate Simulations with WRF Model
 WDS'3 Proceedings of Contributed Papers, Part III, 8 84, 23. ISBN 978-8-737852-8 MATFYZPRESS Regional Climate Simulations with WRF Model J. Karlický Charles University in Prague, Faculty of Mathematics
VALIDATION OF SPATIAL INTERPOLATION TECHNIQUES IN GIS
 VALIDATION OF SPATIAL INTERPOLATION TECHNIQUES IN GIS V.P.I.S. Wijeratne and L.Manawadu University of Colombo (UOC), Kumarathunga Munidasa Mawatha, Colombo 03, wijeratnesandamali@yahoo.com and lasan@geo.cmb.ac.lk
Modelling changes in the runoff regime in Slovakia using high resolution climate scenarios
 Modelling changes in the runoff regime in Slovakia using high resolution climate scenarios K. HLAVČOVÁ, R. VÝLETA, J. SZOLGAY, S. KOHNOVÁ, Z. MACUROVÁ & P. ŠÚREK Department of Land and Water Resources
Extreme precipitation events in the Czech Republic in the context of climate change
 Adv. Geosci., 14, 251 255, 28 www.adv-geosci.net/14/251/28/ Author(s) 28. This work is licensed under a Creative Coons License. Advances in Geosciences Extreme precipitation events in the Czech Republic
A re-sampling based weather generator
 A re-sampling based weather generator Sara Martino 1 Joint work with T. Nipen 2 and C. Lussana 2 1 Sintef Energy Resources 2 Norwegian Metereologic Institute Stockholm 7th Dec. 2017 Sara Martino Joint
Climate Change and Runoff Statistics in the Rhine Basin: A Process Study with a Coupled Climate-Runoff Model
 IACETH Climate Change and Runoff Statistics in the Rhine Basin: A Process Study with a Coupled Climate-Runoff Model Jan KLEINN, Christoph Frei, Joachim Gurtz, Pier Luigi Vidale, and Christoph Schär Institute
CLIMATE CHANGE IMPACTS ON HYDROMETEOROLOGICAL VARIABLES AT LAKE KARLA WATERSHED
 Proceedings of the 14 th International Conference on Environmental Science and Technology Rhodes, Greece, 3-5 September 2015 CLIMATE CHANGE IMPACTS ON HYDROMETEOROLOGICAL VARIABLES AT LAKE KARLA WATERSHED
Stochastic downscaling of rainfall for use in hydrologic studies
 Stochastic downscaling of rainfall for use in hydrologic studies R. Mehrotra, Ashish Sharma and Ian Cordery School of Civil and Environmental Engineering, University of New South Wales, Australia Abstract:
A re-sampling based weather generator
 A re-sampling based weather generator Sara Martino 1 Joint work with T. Nipen 2 and C. Lussana 2 1 Sintef Energy Resources 2 Norwegian Metereologic Institute Berlin 19th Sept. 2017 Sara Martino Joint work
Regionalization Techniques and Regional Climate Modelling
 Regionalization Techniques and Regional Climate Modelling Joseph D. Intsiful CGE Hands-on training Workshop on V & A, Asuncion, Paraguay, 14 th 18 th August 2006 Crown copyright Page 1 Objectives of this
Investigation of Monthly Pan Evaporation in Turkey with Geostatistical Technique
 Investigation of Monthly Pan Evaporation in Turkey with Geostatistical Technique Hatice Çitakoğlu 1, Murat Çobaner 1, Tefaruk Haktanir 1, 1 Department of Civil Engineering, Erciyes University, Kayseri,
Uncertainty in the SWAT Model Simulations due to Different Spatial Resolution of Gridded Precipitation Data
 Uncertainty in the SWAT Model Simulations due to Different Spatial Resolution of Gridded Precipitation Data Vamsi Krishna Vema 1, Jobin Thomas 2, Jayaprathiga Mahalingam 1, P. Athira 4, Cicily Kurian 1,
ESTIMATING SNOWMELT CONTRIBUTION FROM THE GANGOTRI GLACIER CATCHMENT INTO THE BHAGIRATHI RIVER, INDIA ABSTRACT INTRODUCTION
 ESTIMATING SNOWMELT CONTRIBUTION FROM THE GANGOTRI GLACIER CATCHMENT INTO THE BHAGIRATHI RIVER, INDIA Rodney M. Chai 1, Leigh A. Stearns 2, C. J. van der Veen 1 ABSTRACT The Bhagirathi River emerges from
Time Series Analysis Model for Rainfall Data in Jordan: Case Study for Using Time Series Analysis
 American Journal of Environmental Sciences 5 (5): 599-604, 2009 ISSN 1553-345X 2009 Science Publications Time Series Analysis Model for Rainfall Data in Jordan: Case Study for Using Time Series Analysis
Drought forecasting methods Blaz Kurnik DESERT Action JRC
 Ljubljana on 24 September 2009 1 st DMCSEE JRC Workshop on Drought Monitoring 1 Drought forecasting methods Blaz Kurnik DESERT Action JRC Motivations for drought forecasting Ljubljana on 24 September 2009
Comparison of satellite rainfall estimates with raingauge data for Africa
 Comparison of satellite rainfall estimates with raingauge data for Africa David Grimes TAMSAT Acknowledgements Ross Maidment Teo Chee Kiat Gulilat Tefera Diro TAMSAT = Tropical Applications of Meteorology
11/8/2018. Spatial Interpolation & Geostatistics. Kriging Step 1
 (Z i Z j ) 2 / 2 (Z i Zj) 2 / 2 Semivariance y 11/8/2018 Spatial Interpolation & Geostatistics Kriging Step 1 Describe spatial variation with Semivariogram Lag Distance between pairs of points Lag Mean
Regional climate projections for NSW
 Regional climate projections for NSW Dr Jason Evans Jason.evans@unsw.edu.au Climate Change Projections Global Climate Models (GCMs) are the primary tools to project future climate change CSIROs Climate
Assessment of Three Spatial Interpolation Models to Obtain the Best One for Cumulative Rainfall Estimation (Case study: Ramsar District)
") Assessment of Three Spatial Interpolation Models to Obtain the Best One for Cumulative Rainfall Estimation (Case study: Ramsar District) Hasan Zabihi, Anuar Ahmad, Mohamad Nor Said Department of Geoinformation,
Assessment of Three Spatial Interpolation Models to Obtain the Best One for Cumulative Rainfall Estimation (Case study: Ramsar District) Hasan Zabihi, Anuar Ahmad, Mohamad Nor Said Department of Geoinformation,
Inflow forecasting for lakes using Artificial Neural Networks
 Flood Recovery Innovation and Response III 143 Inflow forecasting for lakes using Artificial Neural Networks R. K. Suryawanshi 1, S. S. Gedam 1 & R. N. Sankhua 2 1 CSRE, IIT Bombay, Mumbai, India 2 National
(Regional) Climate Model Validation
 Climate Model Validation") (Regional) Climate Model Validation Francis W. Zwiers Canadian Centre for Climate Modelling and Analysis Atmospheric Environment Service Victoria, BC Outline - three questions What sophisticated validation
(Regional) Climate Model Validation Francis W. Zwiers Canadian Centre for Climate Modelling and Analysis Atmospheric Environment Service Victoria, BC Outline - three questions What sophisticated validation
Stochastic weather generators and modelling climate change. Mikhail A. Semenov Rothamsted Research, UK
 Stochastic weather generators and modelling climate change Mikhail A. Semenov Rothamsted Research, UK Stochastic weather modelling Weather is the main source of uncertainty Weather.15.12 Management Crop
Paper N National Soil Erosion Research Lab
 Paper N. 11137 National Soil Erosion Research Lab Carlos R. Mello Federal University of Lavras (UF, Lavras, MG, Brazil) crmello@deg.ufla.br Marcelo R. Viola (UF, Brazil) Samuel Beskow Federal University
Regional climate-change downscaling for hydrological applications using a nonhomogeneous hidden Markov model
 Regional climate-change downscaling for hydrological applications using a nonhomogeneous hidden Markov model Water for a Healthy Country Flagship Steve Charles IRI Seminar, September 3, 21 Talk outline
Application and verification of ECMWF products 2008
 Application and verification of ECMWF products 2008 RHMS of Serbia 1. Summary of major highlights ECMWF products are operationally used in Hydrometeorological Service of Serbia from the beginning of 2003.
J11.5 HYDROLOGIC APPLICATIONS OF SHORT AND MEDIUM RANGE ENSEMBLE FORECASTS IN THE NWS ADVANCED HYDROLOGIC PREDICTION SERVICES (AHPS)
") J11.5 HYDROLOGIC APPLICATIONS OF SHORT AND MEDIUM RANGE ENSEMBLE FORECASTS IN THE NWS ADVANCED HYDROLOGIC PREDICTION SERVICES (AHPS) Mary Mullusky*, Julie Demargne, Edwin Welles, Limin Wu and John Schaake
J11.5 HYDROLOGIC APPLICATIONS OF SHORT AND MEDIUM RANGE ENSEMBLE FORECASTS IN THE NWS ADVANCED HYDROLOGIC PREDICTION SERVICES (AHPS) Mary Mullusky*, Julie Demargne, Edwin Welles, Limin Wu and John Schaake
Review of Statistical Downscaling
 Review of Statistical Downscaling Ashwini Kulkarni Indian Institute of Tropical Meteorology, Pune INDO-US workshop on development and applications of downscaling climate projections 7-9 March 2017 The
STATISTICAL DOWNSCALING OF DAILY PRECIPITATION IN THE ARGENTINE PAMPAS REGION
 STATISTICAL DOWNSCALING OF DAILY PRECIPITATION IN THE ARGENTINE PAMPAS REGION Bettolli ML- Penalba OC Department of Atmospheric and Ocean Sciences, University of Buenos Aires, Argentina National Council
Prediction of Snow Water Equivalent in the Snake River Basin
 Hobbs et al. Seasonal Forecasting 1 Jon Hobbs Steve Guimond Nate Snook Meteorology 455 Seasonal Forecasting Prediction of Snow Water Equivalent in the Snake River Basin Abstract Mountainous regions of
Comparison of rainfall distribution method
 Team 6 Comparison of rainfall distribution method In this section different methods of rainfall distribution are compared. METEO-France is the French meteorological agency, a public administrative institution
Buenos días. Perdón - Hablo un poco de español!
 Buenos días Perdón - Hablo un poco de español! Introduction to different downscaling tools Rob Wilby Climate Change Science Manager rob.wilby@environment-agency.gov.uk Source: http://culter.colorado.edu/nwt/site_info/site_info.html
Spatial Interpolation & Geostatistics
 (Z i Z j ) 2 / 2 Spatial Interpolation & Geostatistics Lag Lag Mean Distance between pairs of points 1 y Kriging Step 1 Describe spatial variation with Semivariogram (Z i Z j ) 2 / 2 Point cloud Map 3
Reliability of Daily and Annual Stochastic Rainfall Data Generated from Different Data Lengths and Data Characteristics
 Reliability of Daily and Annual Stochastic Rainfall Data Generated from Different Data Lengths and Data Characteristics 1 Chiew, F.H.S., 2 R. Srikanthan, 2 A.J. Frost and 1 E.G.I. Payne 1 Department of
GENERALIZED LINEAR MODELING APPROACH TO STOCHASTIC WEATHER GENERATORS
 GENERALIZED LINEAR MODELING APPROACH TO STOCHASTIC WEATHER GENERATORS Rick Katz Institute for Study of Society and Environment National Center for Atmospheric Research Boulder, CO USA Joint work with Eva
Abebe Sine Gebregiorgis, PhD Postdoc researcher. University of Oklahoma School of Civil Engineering and Environmental Science
 Abebe Sine Gebregiorgis, PhD Postdoc researcher University of Oklahoma School of Civil Engineering and Environmental Science November, 2014 MAKING SATELLITE PRECIPITATION PRODUCTS WORK FOR HYDROLOGIC APPLICATION
Statistical downscaling daily rainfall statistics from seasonal forecasts using canonical correlation analysis or a hidden Markov model?
 Statistical downscaling daily rainfall statistics from seasonal forecasts using canonical correlation analysis or a hidden Markov model? Andrew W. Robertson International Research Institute for Climate
AN INTERNATIONAL SOLAR IRRADIANCE DATA INGEST SYSTEM FOR FORECASTING SOLAR POWER AND AGRICULTURAL CROP YIELDS
 AN INTERNATIONAL SOLAR IRRADIANCE DATA INGEST SYSTEM FOR FORECASTING SOLAR POWER AND AGRICULTURAL CROP YIELDS James Hall JHTech PO Box 877 Divide, CO 80814 Email: jameshall@jhtech.com Jeffrey Hall JHTech
A sensitivity and uncertainty analysis. Ministry of the Walloon Region Agricultural Research Centre
 Development of an agrometeorological model integrating leaf wetness duration estimation and weather radar data to assess the risk of head blight infection in wheat A sensitivity and uncertainty analysis
Operational Hydrologic Ensemble Forecasting. Rob Hartman Hydrologist in Charge NWS / California-Nevada River Forecast Center
 Operational Hydrologic Ensemble Forecasting Rob Hartman Hydrologist in Charge NWS / California-Nevada River Forecast Center Mission of NWS Hydrologic Services Program Provide river and flood forecasts
Antonello Pasini *, Rocco Langone. CNR, Institute of Atmospheric Pollution, Rome, Italy 1. INTRODUCTION * 2. DATA
 J2.3 MAJOR INFLUENCES OF CIRCULATION PATTERNS ON TEMPERATURES IN THE ITALIAN SIDE OF THE GREATER ALPINE REGION: AN INVESTIGATION VIA NEURAL NETWORK MODELING Antonello Pasini *, Rocco Langone CNR, Institute
AN OPERATIONAL DROUGHT MONITORING SYSTEM USING SPATIAL INTERPOLATION METHODS FOR PINIOS RIVER BASIN, GREECE
 Proceedings of the 13 th International Conference on Environmental Science and Technology Athens, Greece, 5-7 September 2013 AN OPERATIONAL DROUGHT MONITORING SYSTEM USING SPATIAL INTERPOLATION METHODS
Use of the models Safran-Crocus-Mepra in operational avalanche forecasting
 Use of the models Safran-Crocus-Mepra in operational avalanche forecasting Coléou C *, Giraud G, Danielou Y, Dumas J-L, Gendre C, Pougatch E CEN, Météo France, Grenoble, France. ABSTRACT: Avalanche forecast
Prediction of Monthly Rainfall of Nainital Region using Artificial Neural Network (ANN) and Support Vector Machine (SVM)
 and Support Vector Machine (SVM)") Vol- Issue-3 25 Prediction of ly of Nainital Region using Artificial Neural Network (ANN) and Support Vector Machine (SVM) Deepa Bisht*, Mahesh C Joshi*, Ashish Mehta** *Department of Mathematics **Department
Vol- Issue-3 25 Prediction of ly of Nainital Region using Artificial Neural Network (ANN) and Support Vector Machine (SVM) Deepa Bisht*, Mahesh C Joshi*, Ashish Mehta** *Department of Mathematics **Department
Hidden Markov Models for precipitation
 Hidden Markov Models for precipitation Pierre Ailliot Université de Brest Joint work with Peter Thomson Statistics Research Associates (NZ) Page 1 Context Part of the project Climate-related risks for
Stochastic Generation of the Occurrence and Amount of Daily Rainfall
 Stochastic Generation of the Occurrence and Amount of Daily Rainfall M. A. B. Barkotulla Department of Crop Science and Technology University of Rajshahi Rajshahi-625, Bangladesh barkotru@yahoo.com Abstract
Climate Change Assessment in Gilan province, Iran
 International Journal of Agriculture and Crop Sciences. Available online at www.ijagcs.com IJACS/2015/8-2/86-93 ISSN 2227-670X 2015 IJACS Journal Climate Change Assessment in Gilan province, Iran Ladan
The minimisation gives a set of linear equations for optimal weights w:
 4. Interpolation onto a regular grid 4.1 Optimal interpolation method The optimal interpolation method was used to compute climatological property distributions of the selected standard levels on a regular
Gridded monthly temperature fields for Croatia for the period
 Gridded monthly temperature fields for Croatia for the 1981 2010 period comparison with the similar global and European products Melita Perčec Tadid melita.percec.tadic@cirus.dhz.hr Meteorological and
Copyright The McGraw-Hill Companies, Inc. Permission required for reproduction or display.
 Chapter 15. SPATIAL INTERPOLATION 15.1 Elements of Spatial Interpolation 15.1.1 Control Points 15.1.2 Type of Spatial Interpolation 15.2 Global Methods 15.2.1 Trend Surface Models Box 15.1 A Worked Example
A MARKOV CHAIN MODELLING OF DAILY PRECIPITATION OCCURRENCES OF ODISHA
 International Journal of Advanced Computer and Mathematical Sciences ISSN 2230-9624. Vol 3, Issue 4, 2012, pp 482-486 http://bipublication.com A MARKOV CHAIN MODELLING OF DAILY PRECIPITATION OCCURRENCES
Rainfall is the most important climate element affecting the livelihood and wellbeing of the
 Ensemble-Based Empirical Prediction of Ethiopian Monthly-to-Seasonal Monsoon Rainfall Rainfall is the most important climate element affecting the livelihood and wellbeing of the majority of Ethiopians.