(Regional) Climate Model Validation
|
|
|
- Darlene Shepherd
- 6 years ago
- Views:
Transcription
1 (Regional) Climate Model Validation Francis W. Zwiers Canadian Centre for Climate Modelling and Analysis Atmospheric Environment Service Victoria, BC
2 Outline - three questions What sophisticated validation methods can be employed in evaluating regional climate? How do we quantify the value-added (or lost) due to downscaling when compared with raw GCM output? Can (dynamical) downscaling improve the simulations of extreme events over GCMs?
3 Question 1 What sophisticated validation methods can be employed in evaluating regional climate? Are objective skill measures that are mostly developed for large scale diagnostics adequate for regional applications? Implicit in these questions is the suspicion that current large scale techniques are not up to the task data hungry and not powerful enough? not sure they can tell us how models differ from reality (or each other)
4 Question 1 What are the objectives of model assessment? do we reject a model if it is significantly different from observations? would we have any models left? Can we set standards for acceptable model performance? application specific some users will have very stringent standards but useful to consider biomedical science analogy is a rabbit a suitable animal model? Need to accept a rabbit for what it is
5 Question 1 What can statistics do? Identify and assess differences (model vs obs, model vs model) in the context of uncontrolled variability relative to a specified standard usual standard - no difference is acceptable! What are the tools? local assessment (at a grid point or station) multivariate analysis assessment of spatial variability assessment of temporal variability pattern correlation evaluate hindecast and forecast skill
6 Tools Local assessments paired difference tests may be appropriate e.g., to compare different kinds of nesting what does a significant difference mean?» precipitation» large scale (e.g., mslp)» surface temperature Multivariate analysis require estimates of covariance structure spatial modelling may be necessary, but not easy
7 Tools Assess spatial variability/covariability EOF, EEOF, REOF, MCA(SVD), etc. same problems as large scale simple structure not necessarily physical structure data sets too small inference tools very limited no rational selection rules EOFs adapt to data from which they are estimated difficult to compare observed with model need to do common EOF analyses
8 EOFs adapt... Eigenspecturm of annual mean surface temperature from CCCma1 control run - 40S to 90N Eigenspectrum from last 50-year chunk Mean psuedo-eigenspectrum from 19 remaining 50-year chunks Graphic by Slava Kharin
 was divided into 50-year chunks.")
9 Figure Caption From Presentation Notes Figure 1: This diagram illustrates the adaptation of EOFs to the sample from which they are estimated. A 1000 year control run performed with the first generation CCCma coupled model (CGCM1) was divided into 50-year chunks. EOFs and eigenvalues of annual mean surface temperature were estimated from the last 50-year chunk. The domain of analysis used for this calculation covers 90N to 40S, roughly mimicing the coverage of observations during the 2nd half of the 20th century. The black bars illustrate the resulting eigenvalue distribution. Observations in each of the other chunks was projected onto the EOFs obtained from the last chunk. The variance of each of the resulting psuedo PCs was computed for each chunk. For each EOF, the 19 psuedo PC variances obtained in this way were averaged. The result is illustrated by the red bars. The message is that the EOFs estimated from one sample explain less variance in other, independent samples from the same process. This occurs because the EOFs are tuned to best fit the specific realization of variability that is contained in the sample from which they were obtained. Consequently, it is not a good idea to compared samples from two climates (say observed and climate model simulated) by fitting EOFs to one sample (observations), and then comparing the variance explained by each of the EOFs in that sample with the variance explained in the second (model simulated) sample. There is a real danger that such a comparison will erroneously conclude that the second sample contains less variance in the direction of each the EOFs, and therefore that the second climate is inferior.

10 Barnett (1999) variability of annual mean temperature common EOF analysis of first 100 years of 11 CMIP1 runs caution - drift not removed! Observations and 95% confidence interval

11 Figure Caption From Presentation Notes Figure 2: The problem described in Figure 1 is avoided by performing a common EOF analysis. Such an analysis is performed by removing the sample means from the individual samples to be intercompared, combining the resulting anomalies into a large super sample, finding the EOFs of this super sample, and then calculating the variance explained by each of the EOFs in the individual samples. This diagram illustrates the result of such an analysis using annual mean surface temperature simulated by 11 coupled models participating in AMIP. Diagram from Barnett (1999, J. Climate).
12 Tools Assess temporal variability/covariability eigen-analyses SSA, MSSA, EEOF, CEOF, POP, etc. time domain modelling Box-Jenkins markov processes (e.g., for precipitation occurrence) classification / weather typing frequency domain analysis can ask if model produces observed variability on some time/space scale
13

14 Figure Caption From Presentation Notes Figure 3: An illustration of a frequency domain analysis. Illustrated is the estimated power spectrum of global annual mean temperature simulated in 9 long control runs with coupled general circulation models. The solid black curve is a corresponding estimate obtained from observations and the dotted black line is the estimate obtained after an estimate of the anthropogenic signal is removed from the data. The spectral estimates have varying equivalent bandwidths adjusted in such a way that all estimates have the same 5-95% uncertainty band. The vertical dashed lines indicate the range of time scales (10-60 years) most important for detection and attribution studies. Models that simulate significantly less variance than observed on these time scales are indicated by an asterix. From IPCC WG1 Third Assessment Report (2001, Ch 12, Figure 12.2).
15 Tools Pattern correlation include time evolution large gradients in space-time may be a problem assess uncertainty/significance with resampling techniques, and using ensembles
16
17 Figure Caption From Presentation Notes Figure 4: An example of the BLT diagram that can be used to intercompare pattern correlation and related information. This particular diagram (from Lambert and Boer, 2001, Climate Dynamics) intercompares the surface air temperature climatologies of models participating in CMIP1. The pink radii labeled correlation indicate the pattern correlation between observed and simulated climatologies. The horizontal scale indicates the mean squared difference between the climatologies, and the vertical scale compares the spatial variance of the model simulated climatology with the observed spatial variance. A perfect model would be located at the red dot. Dots illustrate the quality of the model simulation of the meriodional structure (zonal means) of DJF mean temperature. Coloured labels indicate models without flux adjustment. Performance is uniformly good because it is easy to reproduce the gross meridional temperature structure of the observed climate. Triangles illustrate the quality of the model simulation of the eddie (pattern) structure that remains when zonal means are removed from the climatological distribution of DJF mean temperature. This statistic discriminates more effectively between models (for example, flux adjusted models tend to perform better) because correlations in this calculation are not dominated by the large (and easy to obtain) pole to equator temperature gradient. Note that in both cases, the ensemble mean simulation outperforms individual simulations.
18
19 Figure Caption From Presentation Notes Figure 5: As Figure 4, except for DJF precipitation.
20 Tools Evaluate hindecast and forecast skill seasonal forecasting climate change detection/attribution turns out to be multiple linear regression p T a S + N t = i =1 i t i t t amplitude of i th signal


21 Model Estimated Signal Observed anomalies
.")
22 Figure Caption From Presentation Notes Figure 6: The diagram illustrates schematically the extended 5-decade observation (on the right) and corresponding model simulated signal pattern (on the left) that are matched by generalized multiple linear regression in modern detection studies (such as Stott et al, 2000, Science). Signal uncertainty resulting from internal climate variability is reduced by decadal averaging, by averaging across an ensemble of transient simulations, and by considering only the largest global scales. The mask that appears in the animation of this diagram illustrates the much greater challenge posed by detection on the regional scale.
23 Summary What sophisticated validation methods can be employed in evaluating regional climate? Need to decide what constitutes an acceptable model We have many validation methods (statistical and physical) Need to use methods that are well understood so that physical interpretation is not obscured Can t avoid cost - long runs and ensembles
24 Question 3 Can downscaling improve the simulations of extreme events over GCMs? How do we demonstrate this, and what measures can be used? What should we expect? How do GCMs do? How might RCMs improve, and how might we tell?
25

26 Figure Caption From Presentation Notes Figure 7: Daily precipitation as observed at the Toronto Airport during a 2-year period and as simulated by two generations of the CCCma atmospheric general circulation model at a grid point near Toronto. The diagram demonstrates that these GCMs simulate precipitation variability that is similar to that which is observed. The more recent version of the model (AGCM3) appears to produce smaller precipitation extremes at this particular location that the earlier version of the model. Scale considerations suggest that models should simulate smaller precipitation extremes than observed, and that there should be increasing agreement as the resolution of the model increases.
27
28 Figure Caption From Presentation Notes Figure 8: As Figure 7, except for a 90-day subset of the two-year record. We see he some suggestion that models precipitate small amounts of moisture more frequently than observed.
 Observed 20-year precipitation")

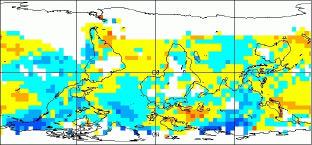
29 CGCM1 simulated precipitation extremes ( ) Observed 20-year precipitation events (mm in 24 hours) 60 mm 80 mm Simulated 20-year precipitation events (present climate)

30 Figure Caption From Presentation Notes Figure 9: Illustration of the ability of a GCM to simulate extreme precipitation. Upper panel: 20-year return values for 24-hour precipitation as estimated from Canadian station data. Lower panel: As above, except as estimated from daily precipitation amounts simulated by the first generation Canadian coupled model (CGCM1) in an ensemble of three transient change simulations (see Boer, et al., 2000, Climate Dynamics) forced with observed changes in greenhouse gas concentrations and sulphate aerosol loadings. The period analysed represents Note that there is some (probably fortuitus) similarity between the return values of the observed and simulated climates. Extreme precipitation events are clearly undersimulated by the model on the west coast of North America (because the model has a very smooth version of the surface topography) and on the eastern seaboard.
")

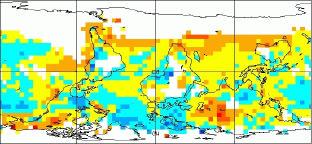
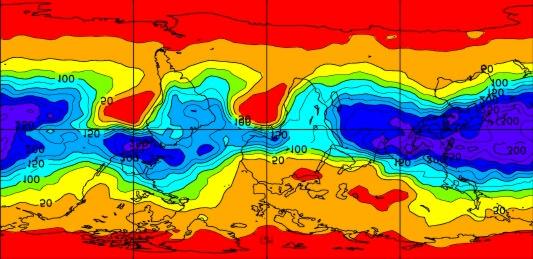
31 Simulated 20-year precip events (present climate) Locations where significantly different from ERA15 too wet too dry

32 Figure Caption From Presentation Notes Figure 10: Continued assessment of the ability of a GCM to simulate observed daily precipitation extremes. Upper panel shows the global distribution of estimated 20-year return values of daily precipitation simulated by CGCM1 for present day climate. The lower panel identifies locations where CGCM1 simulated daily precipitation extremes are significantly from daily precipitation extremes inferred from the ECMWF ERA15 reanalysis.

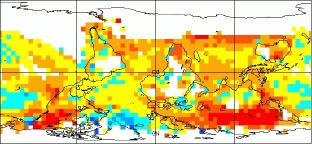
33 T42L18 AMIP2 T42L18 AMIP2

34 Figure Caption From Presentation Notes Figure 11: Continued assessment of the ability of GCMs to simulate daily precipitation extremes. Upper and lower panels illustrate estimated 20-year return values daily precipitation from two AMIP2 simulations performed with two closely related climate models. These two models have different parameterizations of convection, and one is tempted to infer that this is the cause of the large difference. However, comparison between the upper model, and an unrelated model using the same convection scheme (not shown) shows that such a conclusion would be premature. This third model has precipitation extremes behaviour that is very similar to that of the lower model above.
35 Question 3 What should we expect RCMs to improve? Reduction of mean bias Improved stochastic behaviour More realistic variance Better spatial variability Better tail behaviour (i.e., extremes) What would we not expect RCMs to improve? Large scale errors in climate (and forced response) of driving model (e.g., El-Nino like response to ghg forcing).
36 Question 3 - can we demonstrate? Reduction of mean bias yes Improved stochastic behaviour probably can study threshold crossing less demanding of data More realistic variance maybe tests not as powerful, data not as good


37 Question 3 - can we demonstrate? Better spatial variability easy and difficult

38 Figure Caption From Presentation Notes Figure 12: This animated diagram shows that some aspects of the spatial variability of RCMs relative to GCMs are easy to assess. The spatial structure seen in this snapshot from a run with the Canadian RCM is obviously superior to the kinds of spatial structure that make be seen in a typical scene for the same region from the Canadian second generation GCM. Diagram courtesy Rene Laprise and colleagues.
39 Question 3 - can we demonstrate? Better spatial variability? is there a supporting body of literature? many local features have remote links can RCMs simulate these features? Better tail behaviour (I.e., extremes) maybe need appropriate observations model performance mixed, at best
40 Summary Can downscaling improve the simulations of extreme events over GCMs? Yes - they should Can t avoid cost or uncertainty as you move into the tails Again leads to questions about what constitutes acceptable model performance.
Global Climate Models and Extremes
 Global Climate Models and Extremes Francis Zwiers 1, Slava Kharin 1, Xuebin Zhang 1, Gabi Hegerl 2 1 Environment Canada, 2 Duke University Photo: F. Zwiers Outline AMIP2 simulations (subtopic 2) IPCC AR4
SUPPLEMENTARY INFORMATION
 SUPPLEMENTARY INFORMATION doi:10.1038/nature11784 Methods The ECHO-G model and simulations The ECHO-G model 29 consists of the 19-level ECHAM4 atmospheric model and 20-level HOPE-G ocean circulation model.
Diagnosing the Climatology and Interannual Variability of North American Summer Climate with the Regional Atmospheric Modeling System (RAMS)
") Diagnosing the Climatology and Interannual Variability of North American Summer Climate with the Regional Atmospheric Modeling System (RAMS) Christopher L. Castro and Roger A. Pielke, Sr. Department of
Diagnosing the Climatology and Interannual Variability of North American Summer Climate with the Regional Atmospheric Modeling System (RAMS) Christopher L. Castro and Roger A. Pielke, Sr. Department of
Appendix E. OURANOS Climate Change Summary Report
 Appendix E OURANOS Climate Change Summary Report Production of Climate Scenarios for Pilot Project and Case Studies The protocol developed for assessing the vulnerability of infrastructure requires data
Introduction to climate modelling: Evaluating climate models
 Introduction to climate modelling: Evaluating climate models Why? How? Professor David Karoly School of Earth Sciences, University of Melbourne Experiment design Detection and attribution of climate change
How reliable are selected methods of projections of future thermal conditions? A case from Poland
 How reliable are selected methods of projections of future thermal conditions? A case from Poland Joanna Wibig Department of Meteorology and Climatology, University of Łódź, Outline 1. Motivation Requirements
Climate Modelling and Scenarios in Canada. Elaine Barrow Principal Investigator (Science) Canadian Climate Impacts Scenarios (CCIS) Project
 Canadian Climate Impacts Scenarios (CCIS) Project") Climate Modelling and Scenarios in Canada Elaine Barrow Principal Investigator (Science) Canadian Climate Impacts Scenarios (CCIS) Project Canadian Centre for Climate Modelling and Analysis (CCCma) http://www.cccma.bc.ec.gc.ca
Climate Modelling and Scenarios in Canada Elaine Barrow Principal Investigator (Science) Canadian Climate Impacts Scenarios (CCIS) Project Canadian Centre for Climate Modelling and Analysis (CCCma) http://www.cccma.bc.ec.gc.ca
Changes in Weather and Climate Extremes and Their Causes. Xuebin Zhang (CRD/ASTD) Francis Zwiers (PCIC)
 Francis Zwiers (PCIC)") www.ec.gc.ca Changes in Weather and Climate Extremes and Their Causes Xuebin Zhang (CRD/ASTD) Francis Zwiers (PCIC) Outline What do we mean by climate extremes Changes in extreme temperature and precipitation
www.ec.gc.ca Changes in Weather and Climate Extremes and Their Causes Xuebin Zhang (CRD/ASTD) Francis Zwiers (PCIC) Outline What do we mean by climate extremes Changes in extreme temperature and precipitation
Statistical downscaling daily rainfall statistics from seasonal forecasts using canonical correlation analysis or a hidden Markov model?
 Statistical downscaling daily rainfall statistics from seasonal forecasts using canonical correlation analysis or a hidden Markov model? Andrew W. Robertson International Research Institute for Climate
The importance of sampling multidecadal variability when assessing impacts of extreme precipitation
 The importance of sampling multidecadal variability when assessing impacts of extreme precipitation Richard Jones Research funded by Overview Context Quantifying local changes in extreme precipitation
Stochastic decadal simulation: Utility for water resource planning
 Stochastic decadal simulation: Utility for water resource planning Arthur M. Greene, Lisa Goddard, Molly Hellmuth, Paula Gonzalez International Research Institute for Climate and Society (IRI) Columbia
Impacts of Climate Change on Autumn North Atlantic Wave Climate
 Impacts of Climate Change on Autumn North Atlantic Wave Climate Will Perrie, Lanli Guo, Zhenxia Long, Bash Toulany Fisheries and Oceans Canada, Bedford Institute of Oceanography, Dartmouth, NS Abstract
Behind the Climate Prediction Center s Extended and Long Range Outlooks Mike Halpert, Deputy Director Climate Prediction Center / NCEP
 Behind the Climate Prediction Center s Extended and Long Range Outlooks Mike Halpert, Deputy Director Climate Prediction Center / NCEP September 2012 Outline Mission Extended Range Outlooks (6-10/8-14)
Climate Modeling and Downscaling
 Climate Modeling and Downscaling Types of climate-change experiments: a preview 1) What-if sensitivity experiments increase the optically active gases and aerosols according to an assumed scenario, and
The Canadian Seasonal to Interannual Prediction System (CanSIPS)
") The Canadian Seasonal to Interannual Prediction System (CanSIPS) Bill Merryfield, Woo-Sung Lee, Slava Kharin, George Boer, John Scinocca, Greg Flato Canadian Centre for Climate Modelling and Analysis (CCCma)
The Canadian Seasonal to Interannual Prediction System (CanSIPS) Bill Merryfield, Woo-Sung Lee, Slava Kharin, George Boer, John Scinocca, Greg Flato Canadian Centre for Climate Modelling and Analysis (CCCma)
Downscaling in Time. Andrew W. Robertson, IRI. Advanced Training Institute on Climate Variability and Food Security, 12 July 2002
 Downscaling in Time Andrew W. Robertson, IRI Advanced Training Institute on Climate Variability and Food Security, 12 July 2002 Preliminaries Crop yields are driven by daily weather variations! Current
Regional Climate Simulations with WRF Model
 WDS'3 Proceedings of Contributed Papers, Part III, 8 84, 23. ISBN 978-8-737852-8 MATFYZPRESS Regional Climate Simulations with WRF Model J. Karlický Charles University in Prague, Faculty of Mathematics
Predictability and prediction of the North Atlantic Oscillation
 Predictability and prediction of the North Atlantic Oscillation Hai Lin Meteorological Research Division, Environment Canada Acknowledgements: Gilbert Brunet, Jacques Derome ECMWF Seminar 2010 September
DOWNSCALING INTERCOMPARISON PROJECT SUMMARY REPORT
 DOWNSCALING INTERCOMPARISON PROJECT SUMMARY REPORT 1 DOWNSCALING INTERCOMPARISON PROJECT Method tests and future climate projections The Pacific Climate Impacts Consortium (PCIC) recently tested a variety
Robust Arctic sea-ice influence on the frequent Eurasian cold winters in past decades
 SUPPLEMENTARY INFORMATION DOI: 10.1038/NGEO2277 Robust Arctic sea-ice influence on the frequent Eurasian cold winters in past decades Masato Mori 1*, Masahiro Watanabe 1, Hideo Shiogama 2, Jun Inoue 3,
Seasonal Climate Prediction in a Climate Services Context
 Seasonal Climate Prediction in a Climate Services Context F.J. Doblas-Reyes, CFU/IC3 and ICREA, Barcelona, Spain M. Asif (IC3), L. Batté (Météo-France), M. Davis (IC3), J. García- Serrano (IPSL), N. González
Predicting climate extreme events in a user-driven context
 www.bsc.es Oslo, 6 October 2015 Predicting climate extreme events in a user-driven context Francisco J. Doblas-Reyes BSC Earth Sciences Department BSC Earth Sciences Department What Environmental forecasting
ECMWF global reanalyses: Resources for the wind energy community
 ECMWF global reanalyses: Resources for the wind energy community (and a few myth-busters) Paul Poli European Centre for Medium-range Weather Forecasts (ECMWF) Shinfield Park, RG2 9AX, Reading, UK paul.poli
Estimation of Natural Variability and Detection of Anthropogenic Signal in Summertime Precipitation in La Plata Basin
 Estimation of Natural Variability and Detection of Anthropogenic Signal in Summertime Precipitation in La Plata Basin Marcelo Barreiro Stefanie Talento Talento and Barreiro (2012) Facultad de Ciencias
Climate Modeling Dr. Jehangir Ashraf Awan Pakistan Meteorological Department
 Climate Modeling Dr. Jehangir Ashraf Awan Pakistan Meteorological Department Source: Slides partially taken from A. Pier Siebesma, KNMI & TU Delft Key Questions What is a climate model? What types of climate
Physical systematic biases
 Physical systematic biases Aspen Model Evaluation Workshop Greg Flato Canadian Centre for Climate Modelling and Analysis August, 2017 Issues Many large-scale errors/biases persist from one generation of
Extremes Seminar: Tornadoes
 Dec. 01, 2014 Outline Introduction 1 Introduction 2 3 4 Introduction 101: What is a tornado? According to the Glossary of Meteorology (AMS 2000), a tornado is a violently rotating column of air, pendant
An Introduction to Physical Parameterization Techniques Used in Atmospheric Models
 An Introduction to Physical Parameterization Techniques Used in Atmospheric Models J. J. Hack National Center for Atmospheric Research Boulder, Colorado USA Outline Frame broader scientific problem Hierarchy
Trends in Climate Teleconnections and Effects on the Midwest
 Trends in Climate Teleconnections and Effects on the Midwest Don Wuebbles Zachary Zobel Department of Atmospheric Sciences University of Illinois, Urbana November 11, 2015 Date Name of Meeting 1 Arctic
Fidelity and Predictability of Models for Weather and Climate Prediction
 15 August 2013, Northwestern University, Evanston, IL Fidelity and Predictability of Models for Weather and Climate Prediction Jagadish Shukla Department of Atmospheric, Oceanic and Earth Sciences (AOES),
Climate Change Impact Analysis
 Climate Change Impact Analysis Patrick Breach M.E.Sc Candidate pbreach@uwo.ca Outline July 2, 2014 Global Climate Models (GCMs) Selecting GCMs Downscaling GCM Data KNN-CAD Weather Generator KNN-CADV4 Example
Climpact2 and regional climate models
 Climpact2 and regional climate models David Hein-Griggs Scientific Software Engineer 18 th February 2016 What is the Climate System?? What is the Climate System? Comprises the atmosphere, hydrosphere,
Detection of external influence on Northern Hemispheric snow cover
 Detection of external influence on Northern Hemispheric snow cover Tianshu Ma 1, Xuebin Zhang 1,2 Helene Massam 1, Francis Zwiers 3 Georges Monette 1, David Robinson 4 1 Dept. of Mathematics and Statistics,
REQUEST FOR A SPECIAL PROJECT
 REQUEST FOR A SPECIAL PROJECT 2017 2019 MEMBER STATE: Sweden.... 1 Principal InvestigatorP0F P: Wilhelm May... Affiliation: Address: Centre for Environmental and Climate Research, Lund University Sölvegatan
Environment and Climate Change Canada / GPC Montreal
 Environment and Climate Change Canada / GPC Montreal Assessment, research and development Bill Merryfield Canadian Centre for Climate Modelling and Analysis (CCCma) with contributions from colleagues at
Temporal validation Radan HUTH
 Temporal validation Radan HUTH Faculty of Science, Charles University, Prague, CZ Institute of Atmospheric Physics, Prague, CZ What is it? validation in the temporal domain validation of temporal behaviour
Mozambique. General Climate. UNDP Climate Change Country Profiles. C. McSweeney 1, M. New 1,2 and G. Lizcano 1
 UNDP Climate Change Country Profiles Mozambique C. McSweeney 1, M. New 1,2 and G. Lizcano 1 1. School of Geography and Environment, University of Oxford. 2.Tyndall Centre for Climate Change Research http://country-profiles.geog.ox.ac.uk
ENSO Irregularity. The detailed character of this can be seen in a Hovmoller diagram of SST and zonal windstress anomalies as seen in Figure 1.
 ENSO Irregularity The detailed character of this can be seen in a Hovmoller diagram of SST and zonal windstress anomalies as seen in Figure 1. Gross large scale indices of ENSO exist back to the second
Regional climate modelling in the future. Ralf Döscher, SMHI, Sweden
 Regional climate modelling in the future Ralf Döscher, SMHI, Sweden The chain Global H E H E C ( m 3/s ) Regional downscaling 120 adam 3 C HAM 4 adam 3 C HAM 4 trl A2 A2 B2 B2 80 40 0 J F M A M J J A S
Use of the Combined Pacific Variability Mode for Climate Prediction in North America
 Use of the Combined Pacific Variability Mode for Climate Prediction in North America Christopher L. Castro,, Stephen Bieda III, and Francina Dominguez University of Arizona Regional Climate Forum for Northwest
Climate Change Scenarios in Southern California. Robert J. Allen University of California, Riverside Department of Earth Sciences
 Climate Change Scenarios in Southern California Robert J. Allen University of California, Riverside Department of Earth Sciences Overview Climatology of Southern California Temperature and precipitation
FUTURE CARIBBEAN CLIMATES FROM STATISTICAL AND DYNAMICAL DOWNSCALING
 FUTURE CARIBBEAN CLIMATES FROM STATISTICAL AND DYNAMICAL DOWNSCALING Arnoldo Bezanilla Morlot Center For Atmospheric Physics Institute of Meteorology, Cuba The Caribbean Community Climate Change Centre
Julie A. Winkler. Raymond W. Arritt. Sara C. Pryor. Michigan State University. Iowa State University. Indiana University
 Julie A. Winkler Michigan State University Raymond W. Arritt Iowa State University Sara C. Pryor Indiana University Summarize by climate variable potential future changes in the Midwest as synthesized
On the Causes of and Long Term Changes in Eurasian Heat Waves
 On the Causes of and Long Term Changes in Eurasian Heat Waves Siegfried Schubert Hailan Wang*, Randy Koster, Max Suarez NASA/GSFC Global Modeling and Assimilation Office Second Annual Workshop on Understanding
ICRC-CORDEX Sessions A: Benefits of Downscaling Session A1: Added value of downscaling Stockholm, Sweden, 18 May 2016
 ICRC-CORDEX Sessions A: Benefits of Downscaling Session A1: Added value of downscaling Stockholm, Sweden, 18 May 2016 Challenges in the quest for added value of climate dynamical downscaling: Evidence
The PRECIS Regional Climate Model
 The PRECIS Regional Climate Model General overview (1) The regional climate model (RCM) within PRECIS is a model of the atmosphere and land surface, of limited area and high resolution and locatable over
Problems with EOF (unrotated)
") Rotated EOFs: When the domain sizes are larger than optimal for conventional EOF analysis but still small enough so that the real structure in the data is not completely obscured by sampling variability,
Rotated EOFs: When the domain sizes are larger than optimal for conventional EOF analysis but still small enough so that the real structure in the data is not completely obscured by sampling variability,
The North American Regional Climate Change Assessment Program (NARCCAP) Raymond W. Arritt for the NARCCAP Team Iowa State University, Ames, Iowa USA
 Raymond W. Arritt for the NARCCAP Team Iowa State University, Ames, Iowa USA") The North American Regional Climate Change Assessment Program (NARCCAP) Raymond W. Arritt for the NARCCAP Team Iowa State University, Ames, Iowa USA NARCCAP Participants Raymond Arritt, David Flory, William
The North American Regional Climate Change Assessment Program (NARCCAP) Raymond W. Arritt for the NARCCAP Team Iowa State University, Ames, Iowa USA NARCCAP Participants Raymond Arritt, David Flory, William
Andrey Martynov 1, René Laprise 1, Laxmi Sushama 1, Katja Winger 1, Bernard Dugas 2. Université du Québec à Montréal 2
 CMOS-2012, Montreal, 31 May 2012 Reanalysis-driven climate simulation over CORDEX North America domain using the Canadian Regional Climate Model, version 5: model performance evaluation Andrey Martynov
SPECIAL PROJECT PROGRESS REPORT
 SPECIAL PROJECT PROGRESS REPORT Progress Reports should be 2 to 10 pages in length, depending on importance of the project. All the following mandatory information needs to be provided. Reporting year
performance EARTH SCIENCE & CLIMATE CHANGE Mujtaba Hassan PhD Scholar Tsinghua University Beijing, P.R. C
 Temperature and precipitation climatology assessment over South Asia using the Regional Climate Model (RegCM4.3): An evaluation of model performance Mujtaba Hassan PhD Scholar Tsinghua University Beijing,
MJO modeling and Prediction
 MJO modeling and Prediction In-Sik Kang Seoul National University, Korea Madden & Julian Oscillation (MJO) index Composite: OLR & U850 RMM index based on Leading PCs of Combined EOF (OLR, U850, U200) P-1
Empirical climate models of coupled tropical atmosphere-ocean dynamics!
 Empirical climate models of coupled tropical atmosphere-ocean dynamics! Matt Newman CIRES/CDC and NOAA/ESRL/PSD Work done by Prashant Sardeshmukh, Cécile Penland, Mike Alexander, Jamie Scott, and me Outline
CGE TRAINING MATERIALS ON VULNERABILITY AND ADAPTATION ASSESSMENT. Climate change scenarios
 CGE TRAINING MATERIALS ON VULNERABILITY AND ADAPTATION ASSESSMENT Climate change scenarios Outline Climate change overview Observed climate data Why we use scenarios? Approach to scenario development Climate
2. There may be large uncertainties in the dating of materials used to draw timelines for paleo records.
 Limitations of Paleo Data A Discussion: Although paleoclimatic information may be used to construct scenarios representing future climate conditions, there are limitations associated with this approach.
BUILDING CLIMATE CHANGE SCENARIOS OF TEMPERATURE AND PRECIPITATION IN ATLANTIC CANADA USING THE STATISTICAL DOWNSCALING MODEL (SDSM)
") BUILDING CLIMATE CHANGE SCENARIOS OF TEMPERATURE AND PRECIPITATION IN ATLANTIC CANADA USING THE STATISTICAL DOWNSCALING MODEL () GARY S. LINES* MICHAEL PANCURA CHRIS LANDER Meteorological Service of Canada,
BUILDING CLIMATE CHANGE SCENARIOS OF TEMPERATURE AND PRECIPITATION IN ATLANTIC CANADA USING THE STATISTICAL DOWNSCALING MODEL () GARY S. LINES* MICHAEL PANCURA CHRIS LANDER Meteorological Service of Canada,
Application and verification of ECMWF products 2013
 Application and verification of EMWF products 2013 Hellenic National Meteorological Service (HNMS) Flora Gofa and Theodora Tzeferi 1. Summary of major highlights In order to determine the quality of the
Influence of Model Version, Resolution and Driving Data on High Resolution Regional Climate Simulations with CLM
 Influence of Model Version, Resolution and Driving Data on High Resolution Regional Climate Simulations with CLM C. Meißner, G. Schädler, C. Kottmeier Universität / Forschungszentrum Karlsruhe 7.3.27 LM-User-Seminar
Coupled ocean-atmosphere ENSO bred vector
 Coupled ocean-atmosphere ENSO bred vector Shu-Chih Yang 1,2, Eugenia Kalnay 1, Michele Rienecker 2 and Ming Cai 3 1 ESSIC/AOSC, University of Maryland 2 GMAO, NASA/ Goddard Space Flight Center 3 Dept.
1.Decadal prediction ( ) 2. Longer term (to 2100 and beyond)
 2. Longer term (to 2100 and beyond)") Coordinated climate change experiments (formulated by WGCM and AIMES) to be run for assessment in IPCC AR5 Two classes of models to address two time frames and two sets of science questions: 1.Decadal
Coordinated climate change experiments (formulated by WGCM and AIMES) to be run for assessment in IPCC AR5 Two classes of models to address two time frames and two sets of science questions: 1.Decadal
Temperature and rainfall changes over East Africa from multi-gcm forced RegCM projections
 Temperature and rainfall changes over East Africa from multi-gcm forced RegCM projections Gulilat Tefera Diro and Adrian Tompkins - Earth System Physics Section International Centre for Theoretical Physics
Which Climate Model is Best?
 Which Climate Model is Best? Ben Santer Program for Climate Model Diagnosis and Intercomparison Lawrence Livermore National Laboratory, Livermore, CA 94550 Adapting for an Uncertain Climate: Preparing
Global Change and Air Pollution (EPA-STAR GCAP) Daniel J. Jacob
 Daniel J. Jacob") Global Change and Air Pollution (EPA-STAR GCAP) and some more recent work on climate-aq interactions Daniel J. Jacob (djacob@fas.harvard.edu) with Eric M. Leibensperger, Shiliang Wu, Amos Tai, and Loretta
Global Change and Air Pollution (EPA-STAR GCAP) and some more recent work on climate-aq interactions Daniel J. Jacob (djacob@fas.harvard.edu) with Eric M. Leibensperger, Shiliang Wu, Amos Tai, and Loretta
Fig.3.1 Dispersion of an isolated source at 45N using propagating zonal harmonics. The wave speeds are derived from a multiyear 500 mb height daily
 Fig.3.1 Dispersion of an isolated source at 45N using propagating zonal harmonics. The wave speeds are derived from a multiyear 500 mb height daily data set in January. The four panels show the result
Downscaling and Projection of Winter Extreme Daily Precipitation over North America
 1 MARCH 2008 W A N G A N D Z H A N G 923 Downscaling and Projection of Winter Extreme Daily Precipitation over North America JIAFENG WANG AND XUEBIN ZHANG Climate Research Division, Environment Canada,
The Maritime Continent as a Prediction Barrier
 The Maritime Continent as a Prediction Barrier for the MJO Augustin Vintzileos EMC/NCEP SAIC Points to take back home. Forecast of the MJO is at, average, skillful for lead times of up to circa 2 weeks.
Exploring and extending the limits of weather predictability? Antje Weisheimer
 Exploring and extending the limits of weather predictability? Antje Weisheimer Arnt Eliassen s legacy for NWP ECMWF is an independent intergovernmental organisation supported by 34 states. ECMWF produces
Seasonal forecasting activities at ECMWF
 Seasonal forecasting activities at ECMWF An upgraded ECMWF seasonal forecast system: Tim Stockdale, Stephanie Johnson, Magdalena Balmaseda, and Laura Ferranti Progress with C3S: Anca Brookshaw ECMWF June
Climate Change: the Uncertainty of Certainty
 Climate Change: the Uncertainty of Certainty Reinhard Furrer, UZH JSS, Geneva Oct. 30, 2009 Collaboration with: Stephan Sain - NCAR Reto Knutti - ETHZ Claudia Tebaldi - Climate Central Ryan Ford, Doug
Advancing decadal-scale climate prediction in the North Atlantic Sector Noel Keenlyside
 Advancing decadal-scale climate prediction in the North Atlantic Sector Noel Keenlyside M. Latif, J. Jungclaus, L. Kornblueh, E. Roeckner, V. Semenov & W. Park IPCC, 2007 How warm will be the next decade?
Get the Picture: Climate Models
 Students will review scientific infographics to test their understanding of the role, contribution, and limitations of climate models in helping us understand Earth s past, present, and future climate
Malawi. General Climate. UNDP Climate Change Country Profiles. C. McSweeney 1, M. New 1,2 and G. Lizcano 1
 UNDP Climate Change Country Profiles Malawi C. McSweeney 1, M. New 1,2 and G. Lizcano 1 1. School of Geography and Environment, University of Oxford. 2. Tyndall Centre for Climate Change Research http://country-profiles.geog.ox.ac.uk
Supplementary Figure 1. Summer mesoscale convective systems rainfall climatology and trends. Mesoscale convective system (MCS) (a) mean total
 (a) mean total") Supplementary Figure 1. Summer mesoscale convective systems rainfall climatology and trends. Mesoscale convective system (MCS) (a) mean total rainfall and (b) total rainfall trend from 1979-2014. Total
Supplementary Figure 1. Summer mesoscale convective systems rainfall climatology and trends. Mesoscale convective system (MCS) (a) mean total rainfall and (b) total rainfall trend from 1979-2014. Total
Evidence of Decadal Climate Prediction Skill Resulting from Changes in Anthropogenic Forcing
 15 OCTOBER 2006 L E E E T A L. 5305 Evidence of Decadal Climate Prediction Skill Resulting from Changes in Anthropogenic Forcing TERRY C. K. LEE Department of Mathematics and Statistics, University of
International Journal of Scientific and Research Publications, Volume 3, Issue 5, May ISSN
 International Journal of Scientific and Research Publications, Volume 3, Issue 5, May 2013 1 Projection of Changes in Monthly Climatic Variability at Local Level in India as Inferred from Simulated Daily
A Study of the Uncertainty in Future Caribbean Climate Using the PRECIS Regional Climate Model
 A Study of the Uncertainty in Future Caribbean Climate Using the PRECIS Regional Climate Model by Abel Centella and Arnoldo Bezanilla Institute of Meteorology, Cuba & Kenrick R. Leslie Caribbean Community
More extreme precipitation in the world s dry and wet regions
 More extreme precipitation in the world s dry and wet regions Markus G. Donat, Andrew L. Lowry, Lisa V. Alexander, Paul A. O Gorman, Nicola Maher Supplementary Table S1: CMIP5 simulations used in this
Bob Livezey,, Climate Services/NWS/NOAA. 4 th Climate Applications Science Workshop. Tuscon,, AZ, March 22, 2006
 Bob Livezey,, Climate Services/NWS/NOAA 4 th Climate Applications Science Workshop Tuscon,, AZ, March 22, 2006 Outline Introduction Climate Model Capabilities Climate Controls on Weather Downscaling Take
Climate Modeling: From the global to the regional scale
 Climate Modeling: From the global to the regional scale Filippo Giorgi Abdus Salam ICTP, Trieste, Italy ESA summer school on Earth System Monitoring and Modeling Frascati, Italy, 31 July 11 August 2006
Suriname. General Climate. Recent Climate Trends. UNDP Climate Change Country Profiles. Temperature. C. McSweeney 1, M. New 1,2 and G.
 UNDP Climate Change Country Profiles Suriname C. McSweeney 1, M. New 1,2 and G. Lizcano 1 1. School of Geography and Environment, University of Oxford. 2. Tyndall Centre for Climate Change Research http://country-profiles.geog.ox.ac.uk
Vertical Moist Thermodynamic Structure of the MJO in AIRS Observations: An Update and A Comparison to ECMWF Interim Reanalysis
 Vertical Moist Thermodynamic Structure of the MJO in AIRS Observations: An Update and A Comparison to ECMWF Interim Reanalysis Baijun Tian 1 Duane Waliser 1, Eric Fetzer 1, and Yuk Yung 2 1.Jet Propulsion
Karonga Climate Profile: Full Technical Version
 Karonga Climate Profile: Full Technical Version Prepared by: University of Cape Town November 2017 For enquiries regarding this Climate Profile, please contact Lisa van Aardenne (lisa@csag.uct.ac.za) or
HIGH-RESOLUTION CLIMATE PROJECTIONS everyone wants them, how do we get them? KATHARINE HAYHOE
 HIGH-RESOLUTION CLIMATE PROJECTIONS everyone wants them, how do we get them? KATHARINE HAYHOE TEXAS TECH UNIVERSITY ATMOS RESEARCH We produce heat-trapping gases THE CLIMATE PROBLEM INCREASING GHG EMISSIONS
MESA Modeling and Data Assimilation. MESA modeling group: I. Cavalcanti, A. Seth, C. Saulo, B. Kirtman, V. Misra
 MESA Modeling and Data Assimilation MESA modeling group: I. Cavalcanti, A. Seth, C. Saulo, B. Kirtman, V. Misra MESA modeling objectives Model Assessment Model Development Hypothesis Testing RESULTS OF
Winter Forecast for GPC Tokyo. Shotaro TANAKA Tokyo Climate Center (TCC) Japan Meteorological Agency (JMA)
 Japan Meteorological Agency (JMA)") Winter Forecast for 2013 2014 GPC Tokyo Shotaro TANAKA Tokyo Climate Center (TCC) Japan Meteorological Agency (JMA) NEACOF 5, October 29 November 1, 2013 1 Outline 1. Numerical prediction 2. Interannual
Winter Forecast for 2013 2014 GPC Tokyo Shotaro TANAKA Tokyo Climate Center (TCC) Japan Meteorological Agency (JMA) NEACOF 5, October 29 November 1, 2013 1 Outline 1. Numerical prediction 2. Interannual
On the robustness of changes in extreme precipitation over Europe from two high resolution climate change simulations
 QUARTERLY JOURNAL OF THE ROYAL METEOROLOGICAL SOCIETY Q. J. R. Meteorol. Soc. 133: 65 81 (27) Published online in Wiley InterScience (www.interscience.wiley.com).13 On the robustness of changes in extreme
Future extreme precipitation events in the Southwestern US: climate change and natural modes of variability
 Future extreme precipitation events in the Southwestern US: climate change and natural modes of variability Francina Dominguez Erick Rivera Fernandez Hsin-I Chang Christopher Castro AGU 2010 Fall Meeting
3. Carbon Dioxide (CO 2 )
") 3. Carbon Dioxide (CO 2 ) Basic information on CO 2 with regard to environmental issues Carbon dioxide (CO 2 ) is a significant greenhouse gas that has strong absorption bands in the infrared region and
3. Carbon Dioxide (CO 2 ) Basic information on CO 2 with regard to environmental issues Carbon dioxide (CO 2 ) is a significant greenhouse gas that has strong absorption bands in the infrared region and
Investigating Regional Climate Model - RCM Added-Value in simulating Northern America Storm activity
 Investigating Regional Climate Model - RCM Added-Value in simulating Northern America Storm activity E. D. Poan 1, P. Gachon 1, R. Laprise 1, R. Aider 1,2, G. Dueymes 1 1 Centre d Etude et la Simulation
Detection and Attribution of Climate Change
 Detection and Attribution of Climate Change What is D&A? Global Mean Temperature Extreme Event Attribution Geert Jan van Oldenborgh, Sjoukje Philip (KNMI) Definitions Detection: demonstrating that climate
Influence of reducing weather noise on ENSO prediction
 PICES 2009 annual meeting W8 POC workshop Influence of reducing weather noise on ENSO prediction Xiaohui Tang 1, Ping Chang 2, Fan Wang 1 1. Key Laboratory of Ocean Circulation and Waves, Institute of
Climate change and variability -
 Climate change and variability - Current capabilities - a synthesis of IPCC AR4 (WG1) Pete Falloon, Manager Impacts Model Development, Met Office Hadley Centre WMO CaGM/SECC Workshop, Orlando, 18 November
Climate Downscaling 201
 Climate Downscaling 201 (with applications to Florida Precipitation) Michael E. Mann Departments of Meteorology & Geosciences; Earth & Environmental Systems Institute Penn State University USGS-FAU Precipitation
Global climate predictions: forecast drift and bias adjustment issues
 www.bsc.es Ispra, 23 May 2017 Global climate predictions: forecast drift and bias adjustment issues Francisco J. Doblas-Reyes BSC Earth Sciences Department and ICREA Many of the ideas in this presentation
Statistical and dynamical downscaling of precipitation over Spain from DEMETER seasonal forecasts
 Tellus (25), 57A, 49 423 Copyright C Blackwell Munksgaard, 25 Printed in UK. All rights reserved TELLUS Statistical and dynamical downscaling of precipitation over Spain from DEMETER seasonal forecasts
Projected change in the East Asian summer monsoon from dynamical downscaling
 Copyright KIOST, ALL RIGHTS RESERVED. Projected change in the East Asian summer monsoon from dynamical downscaling : Moisture budget analysis Chun-Yong Jung 1,2, Chan Joo Jang 1*, Ho-Jeong Shin 1 and Hyung-Jin
Climate of Illinois and Central United States: Comparison of Model. Simulations of the Current Climate, Comparison of Model
 This project was funded through the Illinois Department of Natural Resources and the Illinois State Geological Survey. Illinois State Water Survey Contract Report 2004-12. This document contains the report
Reduced Overdispersion in Stochastic Weather Generators for Statistical Downscaling of Seasonal Forecasts and Climate Change Scenarios
 Reduced Overdispersion in Stochastic Weather Generators for Statistical Downscaling of Seasonal Forecasts and Climate Change Scenarios Yongku Kim Institute for Mathematics Applied to Geosciences National
ATM S 111, Global Warming Climate Models
 ATM S 111, Global Warming Climate Models Jennifer Fletcher Day 27: July 29, 2010 Using Climate Models to Build Understanding Often climate models are thought of as forecast tools (what s the climate going