Impacts of Updated Design Rainfall Values on Louisiana Infrastructure
|
|
|
- Alicia Houston
- 5 years ago
- Views:
Transcription

1 Louisiana State University LSU Digital Commons LSU Master's Theses Graduate School Impacts of Updated Design Rainfall Values on Louisiana Infrastructure Mario Durbic Follow this and additional works at: Part of the Environmental Education Commons, and the Water Resource Management Commons Recommended Citation Durbic, Mario, "Impacts of Updated Design Rainfall Values on Louisiana Infrastructure" (2018). LSU Master's Theses This Thesis is brought to you for free and open access by the Graduate School at LSU Digital Commons. It has been accepted for inclusion in LSU Master's Theses by an authorized graduate school editor of LSU Digital Commons. For more information, please contact
2 IMPACTS OF UPDATED DESIGN RAINFALL VALUES ON LOUISIANA INFRASTRUCTURE A Thesis Submitted to the Graduate Faculty of the Louisiana State University and Agricultural and Mechanical College In partial fulfillment of the Requirements for the degree of Master of Science in The Department of Civil and Environmental Engineering by Mario Durbic B.A. Louisiana State University, 2015 B.S. Louisiana State University, 2015 December 2018
3 Acknowledgments From being affected by the Great Louisiana Flood of 2016 and starting my very first graduate class one week after, the road has not been an easy one, to say the least. This research would not have been possible without some important people who have supported me not only during the course of this research but throughout my Master s degree. I am grateful to all colleagues that I have had the pleasure to meet and work with during this and other related projects. I would like to thank all of my professors for providing me extensive personal and professional guidance and teaching me a great deal about both scientific research and life in general. I would like to thank the members of my Thesis Committee, Dr. Barry D. Keim and Dr. Zhiqian Deng. A special thank you to Dr. Clint S. Willson, the advisor and chairman of my committee, who introduced this study to me. He has taught me more than I could ever give him credit for. Without his guidance, mentoring, knowledge, and patience, this research would not have been completed. Above all, I would like to thank my family, my parents Ivica and Radmila, my brother, Dario, for their love, inspiration, personal support, and great patience. You have all helped me to focus on achieving this goal. ii
4 Table of Contents Acknowledgments... ii List of Tables... iv List of Figures... vi Abstract... viii Introduction... 1 Literature Review... 7 Objective of Research Study Area Methodology Conclusions and Recommendations References Vita iii
5 List of Tables Table 1. Ann Arbor precipitation totals from Bulletin 71 and Atlas 14 (Bulletin 71/Atlas 14) in inches, for various design storms along with percent change between the two in brackets... 9 Table 2. Design precipitation and peak discharge for each watershed in the study (Markus et al., 2007)... 9 Table 3. Kolmogorov-Smirnov Test Results Table 4. Design Storm Frequencies (LADOTD Hydraulics Manual, 2011) Table 5. Peak Discharge Determination for Ungagged Sites (LADOTD Hydraulics Manual, 2011) Table 6. Rainfall Intensities for Region Table 7. Rainfall Intensities for Region Table 8. Rainfall Intensities for Region Table 9. Louisiana Rainfall Depths (inches) for NRCS Method (LADOTD Hydraulics Manual, 2011) Table 10. Comparisons of derived hourly rainfall intensities for each of the return periods (a-f) using LADOTD vs NOAA Atlas 14 mean values (LADOTD/Atlas 14) along with percent change between the two in brackets Table 11. Comparisons of derived rainfall depths (in), LADOTD and NOAA Atlas 14 mean values, (LADOTD/Atlas 14), for each city along with percent change between the two in brackets Table 12. Comparisons of derived hourly rainfall intensities for each of the return periods (a-f) using LADOTD vs NOAA Atlas 14 upper bound values, (LADOTD/Atlas 14), along with percent change between the two in brackets Table 13. Comparisons of derived rainfall depths (in), LADOTD and NOAA Atlas 14 upper bound values, (LADOTD/Atlas 14), for each city along with percent change between the two in brackets Table 14. Example Excel Spreadsheet used to calculate all of the parameters needed in design of an Open Roadside Channel Table 15. Resulting Peak Discharges for 50 year return period with mean NOAA Atlas Table 16. Resulting Peak Discharges for 50 year return period with upper bound estimates from NOAA Atlas Table 17. Manning s Roughness Coefficient for Channel Linings (LADOTD Hydraulics Manual, 2011) Table 18. Results using the Excel Spreadsheet for each channel (a. Open Excavated, b. Open Lined, c. Highway Channels and Swales with Maintained Vegetation) using mean estimates from NOAA Atlas Table 19. Differences (%) in resulting parameters for individual city when compared to LADOTD suggested parameters for each of the return periods using NOAA Atlas 14 mean estimates Table 20. Results using the Excel Spreadsheet for each channel (a. Open Excavated, b. Open Lined, c. Highway Channels and Swales with Maintained Vegetation) using upper bound estimates from NOAA Atlas Table 21. Differences (%) in resulting parameters for individual city when compared to LADOTD suggested parameters for each of the return periods using NOAA Atlas 14 upper bound estimates iv
6 Table 22. HY-8 Initial Data Inputs for Each One of the Culverts. (a-concrete, b-corrugated) Table 23. Tables (a-f) ADH and AHW for concrete and corrugated pipes using 50 and 100 years return period peak discharges from LADOTD Manual and compared to the NOAA Atlas 14th estimates for each city v
7 List of Figures Figure 1. The Precipitation Frequency Data Server (US Department of Commerce, 2005)... 5 Figure 2. TP40 versus NOAA Atlas 14 Precipitation Depths for Wisconsin (Hahn and Humpal, 2014) Figure 3. Changes in 10-year and 100 year 24-Hour precipitation across Kansas (McEnroe, Young, 2014) Figure 4. Regional Rainfall Distributions for the Ohio Valley and neighboring states (left) and 24-hour rainfall distribution plot (right) (Merkel et al. 2014, p. 6) Figure 5. Louisiana Rainfall Regions with cities of interest Figure 6. Rainfall Intensity Curves for Rational Method Figure 7. Comparisons of rainfall intensities (in/hr) for each return period for Region 1 between LADOTD Manual intensities and cities that fall within the region with intensities derived using NOAA Atlas 14 rainfall intensities Figure 8. Comparisons of rainfall intensities (in/hr) for each return period for Region 2 between LADOTD Manual intensities and city that fall within the region with intensities derived using NOAA Atlas 14 rainfall intensities Figure 9. Comparisons of rainfall intensities (in/hr) for each return period for Region 3 between LADOTD Manual intensities and city that fall within the region with intensities derived using NOAA Atlas 14 rainfall intensities Figure 10. Comparisons of rainfall depths (in) for each return period for Region 1 between LADOTD Manual intensities and city that fall within the region with rainfall depths derived using NOAA Atlas Figure 11. Comparisons of rainfall depths (in) for each return period for Region 2 between LADOTD Manual intensities and city that fall within the region with rainfall depths derived using NOAA Atlas Figure 12. Comparisons of rainfall depths (in) for each return period for Region 3 between LADOTD Manual intensities and city that fall within the region with rainfall depths derived using NOAA Atlas Figure 13. Comparisons of rainfall intensities (in/hr) for each return period for Region 1 between LADOTD Manual intensities and cities that fall within the region with intensities derived using NOAA Atlas 14 upper bound rainfall intensities Figure 14. Comparisons of rainfall intensities (in/hr) for each return period for Region 2 between LADOTD Manual intensities and city that fall within the region with intensities derived using NOAA Atlas 14 upper bound rainfall intensities Figure 15. Comparisons of rainfall intensities (in/hr) for each return period for Region 3 between LADOTD Manual intensities and city that fall within the region with intensities derived using NOAA Atlas 14 upper bound rainfall intensities Figure 16. Comparisons of rainfall depths (in) for each return period for Region 1 between LADOTD Manual intensities and city that fall within the region with rainfall depths derived using NOAA Atlas 14 Upper Bound Estimates Figure 17.Comparisons of rainfall depths (in) for each return period for Region 2 between LADOTD Manual intensities and city that fall within the region with rainfall depths derived using NOAA Atlas 14 Upper Bound Estimates vi
8 Figure 18. Comparisons of rainfall depths (in) for each return period for Region 3 between LADOTD Manual intensities and city that fall within the region with rainfall depths derived using NOAA Atlas 14 Upper Bound Estimates Figure 19. (a-f) Top graph is comparisons of derived rainfall intensities (in/hr) for each return period. Bottom graph is comparisons of calculated peak discharge (cfs) values using each of the rainfall intensities previously derived with assumptions stated for Rational Method Figure 20. Comparisons for Open Excavated Channel, Open Lined Channel, and Highway Channels and Swales with Maintained Vegetation Figure 21. Comparisons for Open Excavated Channel, Open Lined Channel, and Highway Channels and Swales with Maintained Vegetation Figure 22. Guidelines for design parameters Allowable Headwater, AHW, and Allowable Differential Head, ADH (LADOTD Hydraulics Manual, 2011) Figure 23. Peak Discharge data (left) and input data editor (right) in HY Figure 24. Data Inputs needed in HY Figure 25. Example HY-8 Output for each culvert, designed using LADOTD s Peak Discharges, showing AHW and ADH Figure 26. ADH and AHW, both in feet, for concrete and corrugated pipes using 50 and 100 years return period peak discharges from LADOTD Manual and compared to the NOAA Atlas 14th estimates for each city. A line (black line) is drawn to indicate the one foot; if the blue column, representing ADH, is larger than the one foot at that point the design is not satisfactory, similarly if the orange column, representing AHW, is smaller than one foot the design is not satisfactory vii
9 Abstract The Louisiana Department of Transportation and Development (LADOTD) has a Hydraulics Manual which sets forth drainage design standards and codes for projects. The Manual contains maximum annual 24-hour rainfall maps and Intensity-Duration-Frequency (IDF) curves for the return periods of 2, 5, 10, 25, 50, and 100 years. The Manual divides Louisiana into three regions and specifies that all of the cities within a given region should use the same estimated rainfall intensities and rainfall depths. NOAA Atlas 14, the Precipitation-Frequency Atlas of United States, contains the latest rainfall data and statistics for much of the United States and provides the ability to gather rainfall intensities and depths on a city-wide scale. Using Atlas 14, intensities and depths for the return periods of 2, 5, 10, 25, 50, and 100 years were gathered at the local (rather than the regional) level enabling comparisons of individual cities rainfall intensities and depths to those published in the Manual. Six cities were chosen in three different LADOTD designated regions: Baton Rouge, New Orleans, Lafayette, and Lake Charles (Region 1), Natchitoches (Region 2), and Shreveport (Region 3). Comparisons with NOAA Atlas 14 show that the methods employed in the Manual underestimate the design rainfall intensities and depths in most of the cities for every return period. Intensities and depths in Baton Rouge presented the least underestimation, while New Orleans and Lake Charles presented the largest. Further comparisons were done using the upper bound limits of the 90% confidence interval from NOAA Atlas 14 versus the same LADOTD estimates. With this approach, the underestimates increased significantly in all cities. The second part of this thesis analyzed the impact of design storm intensities on two types of water related projects open roadside channels and culverts. Results have shown that the differences in design parameters follow the pattern of underestimating correspondingly to the viii
10 resulting differences in rainfall intensities. For the design of channels, in all cities, area of flow, depth, and width parameters increased slightly and the actual design using LADOTD values, with addition of Free Board, would be able to carry the peak discharges derived using NOAA Atlas 14 mean intensities. However, using upper bound estimates, parameters increased significantly and the actual design using LADOTD values would not be able to carry the peak discharges, derived using NOAA Atlas 14, in all cities. Allowable Differential Head (ADH) and Allowable Headwater (AHW) are the two primary design parameters in the design of a culvert. It was determined that for Baton Rouge, Lafayette, New Orleans, and Lake Charles the pipe sizes, proposed with the use of LADOTD s peak discharges, would not satisfy parameters. Therefore, larger pipe sizes or multiple pipes would have to be used to handle the NOAA Atlas 14 th peak discharges. ix
11 Introduction For many years, climate change has been a looming threat on the minds of infrastructure engineers. But recently, this threat has become much more apparent to the general public. The effects of climate change, mainly changes in extreme temperatures, variations in precipitation, severe weather, increased sea levels, and in some areas, a decrease of clean water availability can all be damaging to infrastructure (Dove, 2017). Rainfall is a principle component of the hydrologic cycle, and its magnitude is a fundamental requirement of many hydrologic studies (Naghavi, 1991). While there are site characteristics that influence the measurable interception and flow of storm water, there are also rainfall characteristics that are considered. Design rainfalls are based on the statistical analysis of historical rainfall data to determine the design rainfall depth or design rainfall intensity corresponding to selected storm durations and frequencies. Storm intensity is the amount of rainfall for a given unit of time and is generally measured in inches per hour. Storm duration is the length of the time between the onset of precipitation and its end (Weiler et al., 2009). The duration refers to the length of time that rainfall occurs. According to American Meteorological Society rainfall frequency is: the probability distribution specifying the exceedance probability of different rainfall depths for a given duration (such as 1 hour, or a 24-hour day). The exceedance frequency is often reported as a return period (in years), which is the reciprocal of the annual exceedance frequency. (American Meteorological Society, 2015). It is an important design parameter because it identifies the level of risk acceptance for the design of highway structures (LADOTD Hydraulics Manual, 2011). Design rainfalls are used by engineers to determine the flood capacity and water level to meet required levels of safety. They are also used to assign a probability to an observed rainfall event and to make decisions about flood warnings and emergency management (Design Rainfalls, 2015). 1
12 In Louisiana, one of the many problems in the design of highway projects is the satisfactory conveyance or transfer of surface runoff from the area of interest. The water from the roadway, roadside channels and streams crossing the project must be conveyed properly without causing property or highway damage due to flooding or erosion. The LADOTD Hydraulics Manual sets forth drainage design standards for the Louisiana Department of Transportation & Development (LADOTD) projects (LADOTD Hydraulics Manual, 2011). Various graphs consisting of rainfall intensity versus duration for various frequencies within the LADOTD 2011 Hydraulics Manual have been prepared for storms with return periods of 2, 10, 25, 50, and 100 years. Dr. Babak Naghavi prepared these graphs, in his 1991 publication LADOTD 24-Hour Rainfall Frequency Maps and I-D-F Curves. In the late 1980s, LADOTD was still using Technical Paper-40 (TP-40), which was developed by David Hershfield in 1961, as the source of obtaining the rainfall design estimates. The objective of Dr. Naghavi s 1991 publication was to develop better maximum annual 24-hour rainfall maps and I-D-F curves for return periods of 2, 5, 10, 25, 50, and 100 years than those currently used (TP-40). According to his research, Dr. Naghavi obtained the data of hourly precipitation from the National Climatic Data Center (NDCD) of National Weather Service (NWS), and the U.S. Department of Commerce. Between the years 1948 and 1987, there were a total of 92 rainfall observation stations in Louisiana. To show a trend in the records with reliable, statistical analysis, any station located in a 10-mile proximity were counted in addition to those stations with no long-term trend. Grouping the rain gauges in this way augmented the total number (26) of synthesized, or representative, stations. Based on the calculations of hourly (1, 3, 6, 12, 24, 36, 48, 60, 72, 84, and 96) quintiles for six return periods (2, 5, 10, 25, 50 and 100 years) the I-D- F curves were developed. Dr. Naghavi writes, the corresponding rainfall intensities for the 11 durations and six return periods were generated using LPEAR3 (Log Pearson Distribution type 3) 2
13 in conjunction with the method of moments for parameter estimation for all 26 stations (Naghavi. 1991, p. 10). With these computed rainfall intensities, he presented a three parameter non-linear model: I = a (D + b) ^ c Where: a, b, and c are three constant parameters; I is the rainfall intensity (inches/hour) for a given return period; D is the rainfall duration (hours). Considering the recent extreme events and damages to the state of Louisiana, the rainfall frequencies and magnitude patterns provided in Dr. Naghavi s publication need to be reexamined for the following reasons: a. There are 30 additional years of precipitation data since its publication. b. Climate change on a global level as well as the potential increase in frequency of extreme meteorological events (Faires et al., 1997). c. The analysis was based on a regional scale approach; Louisiana was divided into three regions and all the cities within designated region are assigned the same rainfall depth and intensity NOAA Atlas 14 contains the latest rainfall data for much of the United States and U.S. affiliated territories. The Atlas is intended as the U.S. Government source of precipitation frequency estimates and associated information (Perica et al., 2013). The Atlas is divided into volumes based on geographic region of the country. NOAA Atlas 14 Volume 9 provides precipitation frequency estimates for six southeastern states: Alabama, Arkansas, Florida, Georgia, Louisiana, and Mississippi. All of the rainfall data can be accessed at city level scale. It includes 3
14 precipitation-frequency data for durations from 5 minutes to 60 days and frequencies of 1-1,000 years with 90% intervals. A confidence interval provides a range of values that is likely to contain the population parameter of interest. In this study the population parameters of interest are the rainfall intensity and rainfall depths. The probability that the true parameter value lies within the confidence interval is Confidence Level and is generally chosen to be at 90, 95, or 99 percent. In the NOAA Atlas 14 Volume 9, the relationship between the frequencies of precipitation and magnitude at individual stations were calculated from a regional frequency analysis approach. These calculations were based on L-moment statistics and calculated using either annual maximum series or partial duration series (Perica et al., 2013). On one hand, the analyses of frequency were shown using an annual maximum series (AMS) for seventeen durations (15-minute, 30-minute, 1- hour, 2-hour, 3-hour, 6-hour, 12-hour, 1-day, 2-day, 3-day, 4-day, 7-day, 10-day, 20-day, 30-day, 45-day and 60-day). On the other hand, some frequency estimates were calculated based on a partial duration series (PDS). The difference is that a PDS analysis includes all amounts for a specified duration at a specific station above a prior specified threshold regardless of the year. Also, some frequencies were developed from AMS data and converted from a formula that allows for conversion between AMS and PDS. Estimates of precipitation frequency taken at 5-minute and 10-minute durations came from corresponding 15-minute estimates (Perica et al., 2013). Confidence intervals at 90% were used to determine the uncertainty in estimates on the frequency curves of both AMS and PDS. Analyzing frequency involves applying an assumed distribution function to the data. Certain distribution functions were used in NOAA Atlas 14 to identify the best precipitation frequency estimates for the project area across all frequencies and durations (specifically 3-parameter Generalized Extreme Value (GEV), Generalized Normal, Generalized Pareto, and Generalized Logistic and Pearson). The GEV distribution was found to 4

15 be the preferred method and was used across all stations and for all durations for the following reasons. First, GEV is a generally recommended distribution method used for analysis of extreme events. Second, it provides an accurate fit to data more often than any other distribution. Finally, the changes in distribution type over differing durations or regions results in obvious discontinuities in frequency estimates across durations or between nearby locations, particularly at less common frequencies (Perica et al., 2013). The resulting rainfall depths and rainfall intensities are provided in tabular and graphical formats through the user friendly Precipitation Frequency Data Server (PFDS); PFDS (Figure 1) is a point-and-click interface developed to deliver NOAA Atlas 14 precipitation frequency estimates and associated information. Figure 1. The Precipitation Frequency Data Server (US Department of Commerce, 2005) Across the Louisiana, patterns in precipitation have been changing. Historical records and analyses done within the LADOTD Hydraulics Manual do not accurately reflect the present and 5
16 projected rainfall depths and rainfall intensities. Because almost all current infrastructure has been designed using climatic design values derived from historical climate data, any changes in regional climates will require changes to how structures are engineered, maintained and operated (Auld, 2008). Unlike the studies done in LADOTD Hydraulics Manual, NOAA Atlas 14 Volume 9 includes most recent 30 years of rainfall data and greater number of gauge stations which in the end leads to more accurate rainfall depth and rainfall intensity estimates. Using the best available data for the management of storm water will produce a better design of water related infrastructure in Louisiana and protect communities from unnecessary risks. 6
17 Literature Review Climate Change Dove (2017, p. 1) wrote: there has been a big increase in weather and climate disasters with damages in the billions of dollars in the U.S. over the last few years. And these numbers will only continue to rise as the climate worsens and our civil infrastructure becomes more and more overloaded. In order to save future lives, as well as our cities, civil and environmental engineers need to incorporate climate change information into their design standards moving forward. But this is much easier said than done. This idea of climate change having a strong impact on our existing infrastructure is not new. Several studies stressed the importance of it. In 2008, Auld (2008, p. 1) warned: climate change has the potential to impact the safety of existing structures, increase the frequency of weather-related disasters, regionally accelerate premature weathering of structures, change climatic design criteria for codes and standards and alter engineering practices. As infrastructure built in current times is intended to survive for decades to come, it is critically important that adaptation options for the changing climate be developed today and that future climate changes be incorporated into infrastructure design whenever possible. In 2013, Watt and Marsalek, (2013) concluded that concerns about climate change (or variability) and the need to adapt to the associated climatic conditions prompted many agencies, and particularly municipalities, to revisit the design storm event issue, particularly in connection with drainage design. In the same study they did a critical review of literature of the evolution of design storms and stated that design storm events, which have been used in specific fields of Canadian and US engineering practice for more than 100 years, can be ascribed to six basic attributes: (1) design return period, (2) storm duration, (3) intensity duration frequency (idf) relations (representing a summary of historical rainfall data, with some extrapolation for longer return periods), (4) temporal distribution (design hyetograph), (5) areal reduction factor, and (6) antecedent moisture conditions. 7
18 Implementation of NOAA Atlas 14 Throughout the US many states have developed their own IDF curves and tables to gather rainfall intensity and depth estimates that are based on U.S. Weather Bureu s Technical Paper No. 40 (Hershfield, 1961) and NOAA s Technical Memorandum NWS Hydro-35 (Frederick et al. 1977). IDF curves are used for a number of water infrastructure applications, such as storm water management systems, detention ponds, sewers, culverts, bridges, dams, channels, pumping stations, roads, among other applications. Even though there is evidence of increased heavy rainfall events and signs of under-designed drainage facilities, many locations across the United States are still referring to those rainfall IDF relationships. The rainfall intensity and rainfall depth information presented in NOAA Atlas 14 (Perica et al. 2013) supersedes all other sources, such as Technical Paper No. 40, and many states have moved towards using NOAA Atlas 14 precipitation data for rainfall intensity and rainfall depth estimates. An example assessment for the Chicago area Guo Y. (2006) demonstrated the need of updating the rainfall IDF relationships to reflect changing climate conditions. Guo Y. concluded that in order to maintain service standards and elude extreme flood damage, updated rainfall IDF relationships should be used in the design of new or replacement of old urban drainage systems (Guo, Y. 2006). Huron River Watershed Council (HRWC) study looked at the implications of precipitation changes in Southeast Michigan and found that precipitation frequency estimates currently used for storm water management do not accurately reflect the depths falling during precipitation events (Table 1). HRWC notes that Atlas 14 provides improved storm definitions that will allow appropriate adjustments to storm water management systems and clarify trends in rainfall that are expected to continue into the future. 8
 calculated design precipitation totals for the Northeastern Illinois region and compared them with those published in TP-40, Bulletin 70, and NOAA-14.")

19 Table 1. Ann Arbor precipitation totals from Bulletin 71 and Atlas 14 (Bulletin 71/Atlas 14) in inches, for various design storms along with percent change between the two in brackets Markus et al. (2007) calculated design precipitation totals for the Northeastern Illinois region and compared them with those published in TP-40, Bulletin 70, and NOAA-14. The average design precipitation for 12 watersheds in the study, based on the current study, was 24.32% larger than that of TP-40, which resulted in 46.92% larger design discharges. Study results are summarized in Table 2. Table 2. Design precipitation and peak discharge for each watershed in the study (Markus et al., 2007) Hahn and Humpal (2014), compared the precipitation frequency and temporal distribution information from various commonly-used sources with NOAA Atlas 14 source. Shown in Figure 2 are the rainfall depth comparisons derived with Technical Paper 40 versus NOAA Atlas 14. Commission staff recommends that NOAA Atlas 14 precipitation data should be used in storm water and flood land management applications. 9
 In 2014, Kansas Department of Transportation s (KDOT) did research that documented the development of")
20 Figure 2. TP40 versus NOAA Atlas 14 Precipitation Depths for Wisconsin (Hahn and Humpal, 2014) In 2014, Kansas Department of Transportation s (KDOT) did research that documented the development of precipitation frequency tables for counties in Kansas based on NOAA Atlas 14 Volume 8 and provided guidelines for their use (McEnroe and Young. 2014). Resulting differences between TP-40 and NOAA Atlas 14 for 10-year and 100- year 24-hour precipitations across Kansas can be seen in Figure 3. The impacts of these changes on design discharges for bridges, culverts and other drainage structures vary by hydrologic method. Design discharges computed with the Rational formula and the Extended Rational equations for Kansas will increase or decrease by the same percentage as the precipitation input to these equations (McEnroe and Young p. 3). 10
 describes updates to rainfall magnitude and rainfall distribution for use in the Natural Resource Conservation Service (NRCS) hydrologic models.")
 with rainfall distributions based on NOAA Atlas 14 precipitation-frequency data, shown in")
21 Figure 3. Changes in 10-year and 100 year 24-Hour precipitation across Kansas (McEnroe, Young, 2014) Merkel et al. (2014) describes updates to rainfall magnitude and rainfall distribution for use in the Natural Resource Conservation Service (NRCS) hydrologic models. Before NOAA Atlas 14, NRCS used rainfall data from Technical Paper No. 40 and NOAA Atlas 2 (in western states) for evaluation and design of water related projects. NRCS is replacing the use of its legacy rainfall distributions (Type I, Type IA, Type II, and Type III) with rainfall distributions based on NOAA Atlas 14 precipitation-frequency data, shown in Figure 4. By developing new rainfall distributions using NOAA Atlas 14 data, the rainfall distributions will reflect the rainfall depth versus duration data at the project location more accurately. This will lead to more accurate estimates of peak discharges and hydrographs for design of projects (Merkel et al p. 8). 11

22 Figure 4. Regional Rainfall Distributions for the Ohio Valley and neighboring states (left) and 24-hour rainfall distribution plot (right) (Merkel et al. 2014, p. 6) Data Comparisons Dr. Babak Naghavi, in his 1991 publication LADOTD 24-Hour Rainfall Frequency Maps and I-D-F Curves, provided IDF curves that were generated using distribution function LP3 (Log Pearson Distribution type 3) in conjunction with the method of moments. NOAA Atlas 14 uses GEV (Generalized Extreme Value) across all stations and for all durations as the preferred distribution function. Since the distribution functions of data are not the same the question of validity of comparing the resulting intensities comes in. But upon further research it was concluded that both methods were made up of the same parameters. The GEV distribution is a family of continuous probability distributions that combines the Gumbel (EV1), Frechet and Weibull distributions. Similarly to LP3, the GEV makes use of 3 parameters: location, scale and shape. The location parameter describes the shift of a distribution in a given direction on the horizontal axis. The scale parameter describes the width of the distribution and defines where the bulk of the distribution lies. As the scale parameter increases, the distribution will become more spread out. The 3rd parameter in the GEV family is the shape parameter, which strictly affects the shape of the distribution, and governs the tail of each distribution (Millington et al,. 2011, p. 10). 12
23 Furthermore, many studies prefer use of GEV distribution over LP3. Millington et al. (2011, p. 10, 11) writes: Since 1967, the U.S. Water Resource Council has recommended and required the use of LPEAR3 distributions for all U.S. analysis. This has recently been called into question by several papers in the U.S. that have done similar studies as carried out in this report, which have found that the GEV distribution is an acceptable distribution, and often preferred over LPEAR3 (Vogel, 1993). A problem arises with LP3 as it has a tendency to give low upper bounds of the precipitation magnitudes, which is undesirable (Cunnane, 1989). 13
24 Objective of Research The overall goal of this research is to study how the updated rainfall intensity and rainfall depth estimates, using NOAA Atlas 14, impact the design process of water related infrastructures in Louisiana. Three main objectives are concentrated on in the study: The first objective of this research is to quantify the differences in the annual 24-hour rainfall intensity and rainfall depth values for the return periods of 2, 5, 10, 25, 50, and 100 years between that specified in the LADOTD Hydraulics Manual and NOAA Atlas 14. The second objective is to examine the variability and differences in the acquired results using a local (city) scale versus a regional scale. Lastly, the third objective is to use the NOAA Atlas 14 rainfall intensity estimates and examine what impacts they have on the various project designs of the water related infrastructures in Louisiana, designed using the guidelines in the LADOTD Hydraulics Manual. 14
 when gathering rainfall intensity and rainfall depth estimates the LADOTD Hydraulic Manual has Louisiana divided into three regions (Figure 5).")
25 Study Area For the purpose of hydrologic and hydraulic design (e.g, NRCS, Rational Method) when gathering rainfall intensity and rainfall depth estimates the LADOTD Hydraulic Manual has Louisiana divided into three regions (Figure 5). The map in the manual was developed by the Louisiana Transportation Research Center (LTRC). For this study, six cities in three different LADOTD designated regions were chosen. The cities were picked based on their population size and impact on Louisiana s economy. Baton Rouge, New Orleans, Lafayette, and Lake Charles, all from Region 1, Natchitoches, Region 2, and Shreveport, Region 3, were selected. Locations of the cities are shown in Figure 5 below. Figure 5. Louisiana Rainfall Regions (LADOTD Hydraulics Manual, 2011) with cities of interest 15
26 Methodology Data Comparison and Kolmogorov-Smirnov Test To make sure that NOAA Atlas 14 estimates are better representations of rainfall depths than LADOTD suggested rainfall depths, a Kolmogorov-Smirnov (K-S) test was performed. K-S test is an efficient way of determining if two sample data are significantly different from each other. Long-term records of daily rainfall for each city were gathered from Southern Regional Climate Center s (SRCC) information data portal called ClimDat (Southern Regional Climate Center, 2018). The most extreme one-day rainfall totals for each year were extracted and ranked from largest rainfall depth to smallest. Each city had a different set of data with different number of years collected. Therefore, to calculate first set of data for the test, named expected exceedance, the number of years collected was divided by the number of years for each return period (2, 5, 10, 25, 50, and 100). To get the second set of data for the K-S test, estimates prescribed from NOAA Atlas 14 and LADOTD for each return period were taken and recorded as to how many times (years) the daily rainfall depth exceeded the proposed estimate. This approach produced three data sets: Expected, NOAA Atlas 14, and LADOTD. K-S test was performed for each city and each return period to examine which data set (NOAA or LADOTD) indicate better agreement with Expected Exceedance. Smaller K-S statistics indicate better agreement between the two data sets. Table 3 shows the results from K-S test and verifies that NOAA Atlas 14 is a better representation of rainfall depths. 16
 Hydraulics Manual (2011) Codes and Guidelines for Design of a Hydraulic Project When designing a particular hydraulic project,")
27 Table 3. Kolmogorov-Smirnov Test Results K-S Test Statistic NOAA Atlas 14 LADOTD Baton Rouge New Orleans Lafayette Lake Charles Natchitoches Shreveport Louisiana Department of Transportation and Development (LADOTD) Hydraulics Manual (2011) Codes and Guidelines for Design of a Hydraulic Project When designing a particular hydraulic project, the first step is to select the required design storm frequency. Table 4, from LADOTD Hydraulic Manual lists the frequencies for different drainage considerations. Table 4. Design Storm Frequencies (LADOTD Hydraulics Manual, 2011) To determine whether an assigned project has a 25 or 50-year frequency, Projected Annual Average Daily Traffic (PAADT) is considered. If PAADT is less than or equal to 3000, then the 25-year frequency is required. If PAADT is more than 3000, then the 50-year frequency is required. The following conditions are also considered when designing for a 50-year frequency: a. The site is on a primary route for emergency vehicles or community evacuation. 17

28 b. The structure is considered a major drainage structure in a designated wetland area. c. It is urban arterial roads and streets. d. The roads and streets have four or more lanes. e. Ramps and approach roadways are within control of access boundaries of freeway. LADOTD Hydraulics Manual contains the procedures and information such as rainfall charts, maps, and tables that are needed to determine the peak discharge or runoff a drainage structure must handle. When gauge data are insufficient or unavailable, LADOTD uses three methods to estimate peak runoff rates essential to the hydraulic design of channels and structures (Table 5). The methods vary according to the size of the area contributing runoff and to the structure application (LADOTD Hydraulics Manual, 2011). Table 5. Peak Discharge Determination for Ungagged Sites (LADOTD Hydraulics Manual, 2011) When determining the rainfall intensity and rainfall depth values for use in the Rational Method and NRCS Method, LADOTD Hydraulic Manual has Louisiana divided in three regions as shown previously in Figure 5. LADOTD Hydraulics Manual contains graphs of rainfall intensity vs. duration for various frequencies that have been prepared for storms with return periods of 2, 10, 25, 50, and 100 years. Graphs and corresponding equations, in Figure 6 below, were prepared from data presented in publication LADOTD 24-Hour Rainfall Frequency Maps and I-D-F Curves. (Naghavi et al., 1991). 18
29 Figure 6. Rainfall Intensity Curves for Rational Method (LADOTD Hydraulics Manual, 2011) The Rational equation is the simplest method to determine peak discharge from drainage basin runoff. When calculating the peak discharge (Q) using Rational Method, in Equation 1, the intensity, i, is determined using the graphs in Figure 6. Q=C*i*A Equation 1 Where: Q = Peak discharge, (cfs) C = Rational method runoff coefficient i = Rainfall intensity (in/hr) A = Drainage area (ac) To compare NOAA Atlas 14 rainfall intensities with all of the rainfall intensities suggested in LADOTD Hydraulic Manual, the initial step was to calculate all of the rainfall intensities from 19
30 LADOTD Hydraulic Manual for all three regions. This was done using rainfall intesity curves presented in Figure 6. The resulting intensities are shown in Table 6, Table 7, and Table 8 below. Table 6. Rainfall Intensities for Region 1 Intensity (in/hr) Duration (hr) yr yr yr yr yr yr Table 7. Rainfall Intensities for Region 2 Intensity (in/hr) Duration (hr) yr yr yr yr yr yr
31 Table 8. Rainfall Intensities for Region 3 Intensity (in/hr) Duration (hr) yr yr yr yr yr yr LADOTD Manual states that if the drainage area of a project is between acres, then the recommended method for finding the peak dischage is the NRCS (Natural Resources Conservation Service) Method, formally known as SCS Methood. Part of the NRCS method is finding the amount of rainfall (inches) associated with the design frequency storm within the desired region. The region is determined using the map in Figure 5. In the LADOTD Manual, the rainfall amount associated with the storm frequency can be determined from Table 9 below. 21
 for NRCS Method (LADOTD Hydraulics Manual, 2011) To compare NOAA Atlas 14 rainfall amounts (depths) with all of the rainfall amounts suggested in LADOTD Hydraulic")
32 Table 9. Louisiana Rainfall Depths (inches) for NRCS Method (LADOTD Hydraulics Manual, 2011) To compare NOAA Atlas 14 rainfall amounts (depths) with all of the rainfall amounts suggested in LADOTD Hydraulic Manual, initial step was to derive all of the rainfall depths from NOAA Atlas 14 and compare them to the amounts in Table 9. Rainfall Intensities and Rainfall Depths Derivations and Comparisons between NOAA Atlas 14 and LADOTD The next step was to gather all of the rainfall intensities and rainfall depths using NOAA Atlas 14 and compare those resulting values to the values of LADOTD Hydraulic Manual that were calculated in Table 6, Table 7, Table 8, and Table 9. Since NOAA Atlas 14 allows one to get the rainfall intensities and depths by city, six largest cities in the state of Louisiana were chosen for examination. The cities of Baton Rouge, New Orleans, Lafayette, and Lake Charles were 22
33 selected and all fall in Region 1 in LADOTD s designated region. Natchitoches falls in Region 2. Finally, the city of Shreveport was selected, which falls in Region 3 in LADOTD s designated region. All regions and cities chosen are illustrated in Figure 5. This approach, at the local scale, provided a method to determine if there are any spatial variations in rainfall intensities, if Rational Method is used, and rainfall depths, if NRCS Method is used, when comparing the local vs. regional scale. Comparisons of rainfall intensities between NOAA Atlas 14 and LADOTD Table 10 contains the NOAA Atlas 14 (mean) and LADOTD Hydraulic Manual rainfall intensities (LADOTD/Atlas 14) for the return periods of 2, 5, 10, 25, 50, and 100 years along with percent change between the two in brackets. Table 10. Comparisons of derived hourly rainfall intensities for each of the return periods (a-f) using LADOTD vs NOAA Atlas 14 mean values (LADOTD/Atlas 14) along with percent change between the two in brackets a) 2 YEARS 2 Hrs 3 Hrs 6 Hrs 12 Hrs 24 Hrs Intensity (in/hr) and Difference (%) Baton New Lake Lafayette Natchitoches Shreveport Rouge Orleans Charles 1.341/ / / / / /1.150 [2.93%] [6.66%] [10.38%] [6.66%] [8.08%] [8.24%] 0.967/ / / / / /0.861 [6.50%] [11.67%] [13.47%] [11.67%] [14.88%] [13.27%] 0.539/ / / / / /0.518 [14.55%] [20.48%] [19.93%] [21.97%] [27.87%] [22.98%] 0.295/ / / / / /0.304 [21.24%] [29.37%] [26.32%] [32.08%] [4.011%] [32%] 0.160/ / / / / /0.178 [28.75%] [40%] [35%] [43.13%] [54.30%] [42.32%] 23
34 b) 5 YEARS 2 Hrs 3 Hrs 6 Hrs 12 Hrs 24 Hrs Intensity (in/hr) and Difference (%) Baton New Lake Lafayette Natchitoches Shreveport Rouge Orleans Charles 1.721/ / / / / /1.430 [-3.57%] [2.82%] [3.40%] [1.66%] [4.40%] [4.03%] 1.270/ / / / / /1.070 [-2.39%] [5.49%] [4.70%] [4.70%] [8.07%] [6.66%] 0.735/ / / / / /0.643 [2.26%] [10.69%] [8.11%] [12.05%] [15.63%] [11.95%] 0.417/ / / / / /0.376 [5.76%] [15.36%] [11.52%] [19.43%] [21.52%] [15.99%] 0.234/ / / / / /0.221 [10.76%] [21.03%] [16.32%] [25.30%] [29.28%] [21.69%] c) 10 YEARS 2 Hrs 3 Hrs 6 Hrs 12 Hrs 24 Hrs Intensity (in/hr) and Difference (%) Baton New Lake Lafayette Natchitoches Shreveport Rouge Orleans Charles 1.985/ / / / / /1.670 [-4.78%] [5.80%] [2.27%] [2.27%] [4.73%] [5%] 1.481/ / / / / /1.250 [-3.42%] [8.07%] [3.34%] [4.69%] [8.37%] [6.72%] 0.873/ / / / / /0.757 [-0.31%] [12.18%] [6.11%] [12.29%] [14.07%] [11.17%] 0.504/ / / / / /0.443 [2.84%] [14.75%] [9%] [18.92%] [17.74%] [13.57%] 0.287/ / / / / /0.261 [6.79%] [17.93%] [13.40%] [23.49%] [22.64%] [17.69%] d) 25 YEARS 2 Hrs 3 Hrs 6 Hrs 12 Hrs 24 Hrs Intensity (in/hr) and Difference (%) Baton New Lake Lafayette Natchitoches Shreveport Rouge Orleans Charles 2.335/ / / / / /2.00 [-4.49%] [11.78%] [1.93%] [4.07%] [6.23%] [6.84%] 1.759/ / / / / /1.520 [-3.91%] [14.85%] [2.91%] [7.46%] [9.57%] [9.48%] 1.055/ / / / / /0.926 [-1.46%] [18.44%] [6.13%] [15.60%] [14.57%] [13.36%] 0.621/ / / / / /0.545 [1.85%] [17.9%] [9.42%] [21.99%] [15.45%] [15.08%] 0.361/ / / / / /0.322 [5.28%] [17.47%] [13.32%] [24.95%] [17.14%] [18.19%] 24
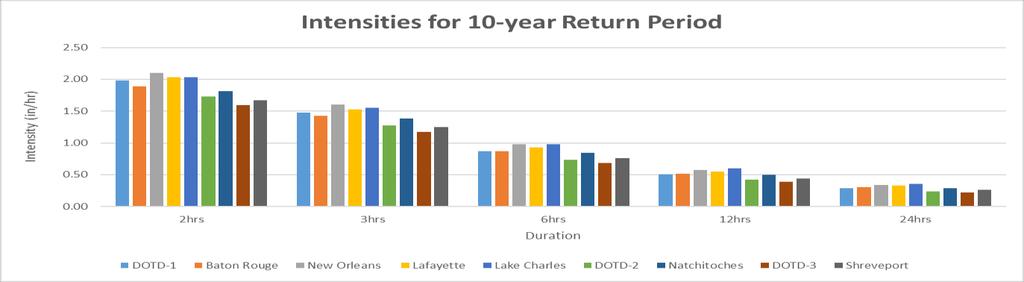
35 e) 50 YEARS 2 Hrs 3 Hrs 6 Hrs 12 Hrs 24 Hrs Intensity (in/hr) and Difference (%) Baton New Lake Lafayette Natchitoches Shreveport Rouge Orleans Charles 2.610/ / / / / /2.280 [-4.21%] [16.86%] [1.15%] [6.13%] [7.70%] [9.44%] 1.977/ / / / / /1.740 [-3.92%] [20.86%] [2.66%] [10.24%] [11.31%] [12.12%] 1.199/ / / / / /1.070 [-1.56%] [24.31%] [6.79%] [18.47%] [15.78%] [16.20%] 0.712/ / / / / /0.633 [2.24%] [21.90%] [10.81%] [25.27%] [15.29%] [17.46%] 0.418/ / / / / /0.375 [5.62%] [18.76%] [14.94%] [27.61%] [15.13%] [19.77%] f) 100 YEARS 2 Hrs 3 Hrs 6 Hrs 12 Hrs 24 Hrs Intensity (in/hr) and Difference (%) Baton New Lake Lafayette Natchitoches Shreveport Rouge Orleans Charles 2.884/ / / / / /2.560 [-3.94%] [22.76%] [0.91%] [8.20%] [8.45%] [11.38%] 2.200/ / / / / /1.960 [-4.09%] [27.73%] [2.28%] [12.73%] [12.06%] [13.93%] 1.352/ / / / / /1.220 [-1.60%] [30.95%] [7.28%] [22.07%] [15.86%] [18.48%] 0.815/ / / / / /0.728 [1.83%] [25.14%] [11.53%] [27.60%] [14.60%] [19.70%] 0.487/ / / / / /0.433 [4.39%] [18.37%] [15.08%] [28.23%] [12.31%] [21.38%] To better visualize and understand the differences from Table 10, Figure 7, Figure 8, Figure 9 were developed to show the rainfall intensities, from DOTD and NOAA Atlas 14 for each one of the return periods (2, 5, 10, 25, 50, and 100 year) within a given region. 25
36 Intensity (in/hr) Intensity (in/hr) Intensity (in/hr) IDF CURVES FOR 2 YEARS RETURN PERIOD (Region 1) hrs 3hrs 6hrs 12hrs 24hrs DOTD-1 Baton Rouge New Orleans Lafayette Lake Charles IDF CURVES FOR 5 YEARS RETURN PERIOD (Region 1) hrs 3hrs 6hrs 12hrs 24hrs DOTD-1 Baton Rouge New Orleans Lafayette Lake Charles IDF CURVES FOR 10 YEARS RETURN PERIOD (Region 1) hrs 3hrs 6hrs 12hrs 24hrs DOTD-1 Baton Rouge New Orleans Lafayette Lake Charles 26
37 Intensity (in/hr) Intensity (in/hr) Intensity (in/hr) IDF CURVES FOR 25 YEARS RETURN PERIOD (Region 1) hrs 3hrs 6hrs 12hrs 24hrs DOTD-1 Baton Rouge New Orleans Lafayette Lake Charles IDF CURVES FOR 50 YEARS RETURN PERIOD (Region 1) hrs 3hrs 6hrs 12hrs 24hrs DOTD-1 Baton Rouge New Orleans Lafayette Lake Charles IDF CURVES FOR 100 YEARS RETURN PERIOD (Region 1) hrs 3hrs 6hrs 12hrs 24hrs DOTD-1 Baton Rouge New Orleans Lafayette Lake Charles Figure 7. Comparisons of rainfall intensities (in/hr) for each return period for Region 1 between LADOTD Manual intensities and cities that fall within the region with intensities derived using NOAA Atlas 14 rainfall intensities. 27
38 Intensity (in/hr) Intensity (in/hr) Intensity (in/hr) IDF CURVES FOR 2 YEARS RETURN PERIOD (Region 2) hrs 3hrs 6hrs 12hrs 24hrs DOTD-2 Natchitoches IDF CURVES FOR 5 YEARS RETURN PERIOD (Region 2) hrs 3hrs 6hrs 12hrs 24hrs DOTD-2 Natchitoches IDF CURVES FOR 10 YEARS RETURN PERIOD (Region 2) hrs 3hrs 6hrs 12hrs 24hrs DOTD-2 Natchitoches 28
39 Intensity (in/hr) Intensity (in/hr) Intensity (in/hr) IDF CURVES FOR 25 YEARS RETURN PERIOD (Region 2) hrs 3hrs 6hrs 12hrs 24hrs DOTD-2 Natchitoches IDF CURVES FOR 50 YEARS RETURN PERIOD (Region 2) hrs 3hrs 6hrs 12hrs 24hrs DOTD-2 Natchitoches IDF CURVES FOR 100 YEARS RETURN PERIOD (Region 2) hrs 3hrs 6hrs 12hrs 24hrs DOTD-2 Natchitoches Figure 8. Comparisons of rainfall intensities (in/hr) for each return period for Region 2 between LADOTD Manual intensities and city that fall within the region with intensities derived using NOAA Atlas 14 rainfall intensities 29
40 Intensity (in/hr) Intensity (in/hr) Intensity (in/hr) IDF CURVES FOR 2 YEARS RETURN PERIOD (Region 3) hrs 3hrs 6hrs 12hrs 24hrs DOTD-3 Shreveport IDF CURVES FOR 5 YEARS RETURN PERIOD (Region 3) hrs 3hrs 6hrs 12hrs 24hrs DOTD-3 Shreveport IDF CURVES FOR 10 YEARS RETURN PERIOD (Region 3) hrs 3hrs 6hrs 12hrs 24hrs DOTD-3 Shreveport 30
41 Intensity (in/hr) Intensity (in/hr) Intensity (in/hr) IDF CURVES FOR 25 YEARS RETURN PERIOD (Region 3) hrs 3hrs 6hrs 12hrs 24hrs DOTD-3 Shreveport IDF CURVES FOR 50 YEARS RETURN PERIOD (Region 3) hrs 3hrs 6hrs 12hrs 24hrs DOTD-3 Shreveport IDF CURVES FOR 100 YEARS RETURN PERIOD (Region 3) hrs 3hrs 6hrs 12hrs 24hrs DOTD-3 Shreveport Figure 9. Comparisons of rainfall intensities (in/hr) for each return period for Region 3 between LADOTD Manual intensities and city that fall within the region with intensities derived using NOAA Atlas 14 rainfall intensities 31
42 Comparisons of rainfall depths between NOAA Atlas 14 and LADOTD If NRCS Method is the method of choice, Table 11, Figure 10, Figure 11, and Figure 12 all illustrate the comparisons of NOAA Atlas 14 (mean) rainfall depths to rainfall depths derived using LADOTD Hydraulic Manual for the return periods of 2, 5, 10, 25, 50, and 100 years. Table 11. Comparisons of derived rainfall depths (in), LADOTD and NOAA Atlas 14 mean values, (LADOTD/Atlas 14), for each city along with percent change between the two in brackets RETURN PERIOD (yrs) DURATION (hrs) BATON NEW LAKE LAFAYETTE ROUGE ORLEANS CHARLES NATCHITOCHES SHREVEPORT 3.5/ / / /3.94 3/ /3.1 [5.71%] [11.14%] [10.86%] [12.57%] [12.33%] [10.71%] 4.1/ / / / / /3.66 [5.12%] [12.20%] [9.76%] [14.63%] [10.83%] [14.38%] 4.8/ / / /5.49 4/ /4.27 [3.13%] [11.88%] [7.71%] [14.38%] [16.75%] [18.61%] 4.6/ / / /4.94 4/ /3.85 [-1.96%] [5.87%] [3.48%] [7.39%] [5.50%] [4.05%] 5.6/ / / /6 4.8/ /4.53 [-5%] [3.57%] [0%] [7.14%] [3.96%] [5.35%] 6.5/ / / / / /5.29 [-4.31%] [4.62%] [0.46%] [8.31%] [8.33%] [7.96%] 5.5/ / / / / /4.53 [-5.09%] [6.55%] [0.91%] [6.73%] [5%] [2.95%] 6.7/ / / / / /5.33 [-6.87%] [3.88%] [-1.19%] [7.76%] [4.56%] [4.51%] 7.8/ / / / / /6.25 [-5.38%] [4.23%] [0.26%] [9.10%] [7.23%] [7.76%] 6.6/ / / / / /5.54 [-5.15%] [13.48%] [1.52%] [10.61%] [7.46%] [4.53%] 8.2/ / / / / /6.57 [-6.95%] [7.56%] [-0.24%] [11.22%] [7.14%] [5.97%] 9.6/ / / /10.8 8/8.74 7/7.74 [-4.90%] [6.25%] [2.29%] [12.50%] [9.25%] [10.57%] 7.6/ / / / /7.46 6/6.39 [-6.32%] [17.76%] [0.79%] [12.11%] [8.12%] [6.50%] 9.5/ / / / /8.85 7/7.63 [-7.58%] [10.53%] [0.11%] [13.68%] [9.26%] [9%] 11.1/ / / / /10.3 8/9.01 [-4.50%] [7.21%] [3.60%] [15.32%] [11.96%] [12.63%] 8.6/ / / / / /7.29 [-6.74%] [23.26%] [0.70%] [14.65%] [10.13%] [7.21%] 10.9/ / / / / /8.78 [-8.26%] [12.84%] [0%] [14.68%] [10.75%] [11.14%] 12.6/ / / / /12 9/10.4 [-3.17%] [9.52%] [6.35%] [19.05%] [14.29%] [15.56%] 32
43 Rainfall (in) Rainfall (in) Rainfall (in) As previously done with the rainfall intensity values, the values from Table 11 are plotted in Figure 10, Figure 11, and Figure 12 for each return period Year Rainfall Depths (Region 1) 3 6 hrs 12 hrs 24 hrs REGION 1 BATON ROUGE NEW ORLEANS LAFAYETTE LAKE CHARLES 5 Year Rainfall Depths (Region 1) hrs 12 hrs 24 hrs REGION 1 BATON ROUGE NEW ORLEANS LAFAYETTE LAKE CHARLES 10 Year Rainfall Depths (Region 1) hrs 12 hrs 24 hrs REGION 1 BATON ROUGE NEW ORLEANS LAFAYETTE LAKE CHARLES 33
44 Rainfall (in) Rainfall (in) Rainfall (in) 25 Year Rainfall Depths (Region 1) hrs 12 hrs 24 hrs REGION 1 BATON ROUGE NEW ORLEANS LAFAYETTE LAKE CHARLES 50 Year Rainfall Depths (Region 1) hrs 12 hrs 24 hrs REGION 1 BATON ROUGE NEW ORLEANS LAFAYETTE LAKE CHARLES 100 Year Rainfall Depths (Region 1) hrs 12 hrs 24 hrs REGION 1 BATON ROUGE NEW ORLEANS LAFAYETTE LAKE CHARLES Figure 10. Comparisons of rainfall depths (in) for each return period for Region 1 between LADOTD Manual intensities and city that fall within the region with rainfall depths derived using NOAA Atlas 14 34
45 Rainfall (in) Rainfall (in) Rainfall (in) 2 Year Rainfall Depths (Region 2) hrs 12 hrs 24 hrs REGION 2 NATCHITOCHES 5 Year Rainfall Depths (Region 2) hrs 12 hrs 24 hrs REGION 2 NATCHITOCHES 10 Year Rainfall Depths (Region 2) hrs 12 hrs 24 hrs REGION 2 NATCHITOCHES 35
46 Rainfall (in) Rainfall (in) Rainfall (in) 25 Year Rainfall Depths (Region 2) hrs 12 hrs 24 hrs REGION 2 NATCHITOCHES 50 Year Rainfall Depths (Region 2) hrs 12 hrs 24 hrs REGION 2 NATCHITOCHES 100 Year Rainfall Depths (Region 2) hrs 12 hrs 24 hrs REGION 2 NATCHITOCHES Figure 11. Comparisons of rainfall depths (in) for each return period for Region 2 between LADOTD Manual intensities and city that fall within the region with rainfall depths derived using NOAA Atlas 14 36
47 Rainfall (in) Rainfall (in) Rainfall (in) 2 Year Rainfall Depths (Region 3) hrs 12 hrs 24 hrs REGION 3 SHREVEPORT 5 Year Rainfall Depths (Region 3) hrs 12 hrs 24 hrs REGION 3 SHREVEPORT 10 Year Rainfall Depths (Region 3) hrs 12 hrs 24 hrs REGION 3 SHREVEPORT 37
48 Rainfall (in) Rainfall (in) Rainfall (in) 25 Year Rainfall Depths (Region 3) hrs 12 hrs 24 hrs REGION 3 SHREVEPORT 50 Year Rainfall Depths (Region 3) hrs 12 hrs 24 hrs REGION 3 SHREVEPORT 100 Year Rainfall Depths (Region 3) hrs 12 hrs 24 hrs REGION 3 SHREVEPORT Figure 12. Comparisons of rainfall depths (in) for each return period for Region 3 between LADOTD Manual intensities and city that fall within the region with rainfall depths derived using NOAA Atlas
49 Comparisons of rainfall intensities and rainfall depths using NOAA Atlas 14 Upper Bound Limits from the 90 percent Confidence Interval The previous two sections analyzed the resulting rainfall intensities and rainfall depths suggested in LADOTD Manual and compared them to NOAA Atlas 14 derived mean rainfall intensities and rainfall depths. NOAA Atlas 14 provides rainfall intensities and rainfall depths with 90 percent confidence intervals. A confidence interval provides a range of values that is likely to contain the population parameter of interest. In this study the population parameters of interest are the rainfall intensity and rainfall depths. The probability that the true parameter value lies within the confidence interval is Confidence Level and is generally chosen to be at 90, 95, or 99 percent. This section analyzes and compares only the upper level estimates from the 90 percent interval from NOAA Atlas 14 to those same estimates previously derived from LADOTD Manual. Exactly the same procedures were done as in the previous two sections. The only change made is the mean values, from the 90 percent interval, were replaced with the upper bound limit values. Comparisons of rainfall intensities between NOAA Atlas 14 upper bound limits and LADOTD Tables (a-f) in Table 12 and graphs in Figure 13, Figure 14, and Figure 15 all illustrate the comparisons of NOAA Atlas 14 upper bound rainfall intensities to rainfall intensities in LADOTD Hydraulic Manual for the return periods of 2, 5, 10, 25, 50, and 100 years. In the graphs each one of the return periods (2, 5, 10, 25, 50, and 100 year) presented in the I-D-F curves in LADOTD Manual, Figure 6, is compared to each city s derived I-D-F curve using NOAA Atlas 14 upper bound estimates. To further evaluate the differences within the rainfall intensities, percentage diffrences were calculated to see how much each cities rainfall intensity, derrived using NOAA Atlas 14 upper bound estimates, change from the LADOTD suggested rainfall intensity. Differences are shown in brackets (Table 12). 39
50 Table 12. Comparisons of derived hourly rainfall intensities for each of the return periods (a-f) using LADOTD vs NOAA Atlas 14 upper bound values, (LADOTD/Atlas 14), along with percent change between the two in brackets a) 2 YEARS 2 Hrs 3 Hrs 6 Hrs 12 Hrs 24 Hrs b) 5 YEARS 2 Hrs 3 Hrs 6 Hrs 12 Hrs 24 Hrs c) 10 YEARS 2 Hrs 3 Hrs 6 Hrs 12 Hrs 24 Hrs Intensity (in/hr) and Difference (%) New Lake Baton Rouge Lafayette Natchitoches Shreveport Orleans Charles 1.341/ / / / / /1.340 [19.33%] [31.27%] [29.78%] [34.25%] [29.17%] [26.12%] 0.967/ / / / / /1.000 [23.05%] [36.49%] [32.35%] [39.59%] [36.17%] [31.56%] 0.539/ / / / / /0.598 [31.60%] [46.25%] [39.20%] [51.81%] [50.36%] [41.98%] 0.295/ / / / / /0.348 [38.18%] [56.13%] [45.63%] [63.24%] [63.82%] [51.10%] 0.160/ / / / / /0.203 [46.25%] [67.50%] [54.38%] [75.63%] [79.75%] [62.31%] Intensity (in/hr) and Difference (%) New Lake Baton Rouge Lafayette Natchitoches Shreveport Orleans Charles 1.721/ / / / / /1.670 [12.12%] [26.64%] [21.41%] [27.80%] [24.74%] [24.49%] 1.270/ / / / / /1.250 [13.36%] [29.10%] [22.80%] [31.46%] [28.57%] [24.61%] 0.735/ / / / / /0.745 [17.62%] [34.76%] [25.65%] [40.06%] [36.62%] [29.71%] 0.417/ / / / / /0.432 [21.11%] [39.58%] [28.55%] [47.73%] [42.65%] [33.26%] 0.234/ / / / / /0.252 [25.73%] [45.40%] [33.43%] [54.38%] [50.48%] [38.76%] Intensity (in/hr) and Difference (%) New Lake Baton Rouge Lafayette Natchitoches Shreveport Orleans Charles 1.985/ / / / / /1.960 [11.34%] [30.48%] [20.41%] [28.97%] [26.14%] [23.23%] 1.481/ / / / / /1.470 [12.12%] [33.06%] [20.90%] [32.38%] [29.58%] [25.50%] 0.873/ / / / / /0.880 [14.59%] [37.50%] [23.75%] [40.94%] [35.48%] [29.24%] 0.504/ / / / / /0.511 [17.93%] [39.37%] [26.27%] [47.71%] [38.67%] [31%] 0.287/ / / / / /0.299 [21.75%] [41.93%] [30.45%] [52.36%] [43.29%] [34.82%] 40
51 d) 25 YEARS 2 Hrs 3 Hrs 6 Hrs 12 Hrs 24 Hrs e) 50 YEARS 2 Hrs 3 Hrs 6 Hrs 12 Hrs 24 Hrs f) 100 YEARS 2 Hrs 3 Hrs 6 Hrs 12 Hrs 24 Hrs Intensity (in/hr) and Difference (%) New Lake Baton Rouge Lafayette Natchitoches Shreveport Orleans Charles 2.335/ / / / / /2.450 [14.78%] [45.19%] [22.92%] [36.62%] [34.46%] [30.88%] 1.759/ / / / / /1.850 [14.85%] [49.53%] [23.95%] [41%] [38.41%] [33.24%] 1.055/ / / / / /1.130 [18.44%] [53.50%] [27.92%] [51.61%] [44.83%] [38.34%] 0.621/ / / / / /0.663 [24.51%] [51.32%] [32.15%] [59.22%] [45.15%] [40%] 0.361/ / / / / /0.390 [25.23%] [48.50%] [36.59%] [62.08%] [46.10%] [43.15%] Intensity (in/hr) and Difference (%) New Lake Baton Rouge Lafayette Natchitoches Shreveport Orleans Charles 2.610/ / / / / /2.810 [16.10%] [52.88%] [23.38%] [40.24%] [37.46%] [34.88%] 1.977/ / / / / /2.140 [16.31%] [58.29%] [24.91%] [45.64%] [42.47%] [37.90%] 1.199/ / / / / /1.310 [19.30%] [62.68%] [30.15%] [56.84%] [47.28%] [42.26%] 0.712/ / / / / /0.778 [22.88%] [57.29%] [34.82%] [64.31%] [46.55%] [44.37%] 0.418/ / / / / /0.459 [26.41%] [51.02%] [39.31%] [66.56%] [44.99%] [46.59%] Intensity (in/hr) and Difference (%) New Lake Baton Rouge Lafayette Natchitoches Shreveport Orleans Charles 2.884/ / / / / /3.240 [18.95%] [64.03%] [25.53%] [45.99%] [42.87%] [40.96%] 2.200/ / / / / /2.480 [18.64%] [70.46%] [27.28%] [52.28%] [47.63%] [44.16%] 1.352/ / / / / /1.540 [21.33%] [73.86%] [32.43%] [64.24%] [52.61%] [49.55%] 0.815/ / / / / /0.917 [25.14%] [64.41%] [37.41%] [70.54%] [49.59%] [50.77%] 0.487/ / / / / /0.542 [27.41%] [53.71%] [42%] [70.97%] [45.47%] [51.93%] 41
52 Intensity (in/hr) Intensity (in/hr) Intensity (in/hr) IDF CURVES FOR 2 YEARS RETURN PERIOD (Region 1) hrs 3hrs 6hrs 12hrs 24hrs DOTD-1 Baton Rouge New Orleans Lafayette Lake Charles IDF CURVES FOR 5 YEARS RETURN PERIOD (Region 1) hrs 3hrs 6hrs 12hrs 24hrs DOTD-1 Baton Rouge New Orleans Lafayette Lake Charles IDF CURVES FOR 10 YEARS RETURN PERIOD (Region 1) hrs 3hrs 6hrs 12hrs 24hrs DOTD-1 Baton Rouge New Orleans Lafayette Lake Charles 42
53 Intensity (in/hr) Intensity (in/hr) Intensity (in/hr) IDF CURVES FOR 25 YEARS RETURN PERIOD (Region 1) hrs 3hrs 6hrs 12hrs 24hrs DOTD-1 Baton Rouge New Orleans Lafayette Lake Charles IDF CURVES FOR 50 YEARS RETURN PERIOD (Region 1) hrs 3hrs 6hrs 12hrs 24hrs DOTD-1 Baton Rouge New Orleans Lafayette Lake Charles IDF CURVES FOR 100 YEARS RETURN PERIOD (Region 1) hrs 3hrs 6hrs 12hrs 24hrs DOTD-1 Baton Rouge New Orleans Lafayette Lake Charles Figure 13. Comparisons of rainfall intensities (in/hr) for each return period for Region 1 between LADOTD Manual intensities and cities that fall within the region with intensities derived using NOAA Atlas 14 upper bound rainfall intensities 43
54 Intensity (in/hr) Intensity (in/hr) Intensity (in/hr) IDF CURVES FOR 2 YEARS RETURN PERIOD (Region 2) hrs 3hrs 6hrs 12hrs 24hrs DOTD-2 Natchitoches IDF CURVES FOR 5 YEARS RETURN PERIOD (Region 2) hrs 3hrs 6hrs 12hrs 24hrs DOTD-2 Natchitoches IDF CURVES FOR 10 YEARS RETURN PERIOD (Region 2) hrs 3hrs 6hrs 12hrs 24hrs DOTD-2 Natchitoches 44
55 Intensity (in/hr) Intensity (in/hr) Intensity (in/hr) IDF CURVES FOR 25 YEARS RETURN PERIOD (Region 2) hrs 3hrs 6hrs 12hrs 24hrs DOTD-2 Natchitoches IDF CURVES FOR 50 YEARS RETURN PERIOD (Region 2) hrs 3hrs 6hrs 12hrs 24hrs DOTD-2 Natchitoches IDF CURVES FOR 100 YEARS RETURN PERIOD (Region 2) hrs 3hrs 6hrs 12hrs 24hrs DOTD-2 Natchitoches Figure 14. Comparisons of rainfall intensities (in/hr) for each return period for Region 2 between LADOTD Manual intensities and city that fall within the region with intensities derived using NOAA Atlas 14 upper bound rainfall intensities 45
56 Intensity (in/hr) Intensity (in/hr) Intensity (in/hr) IDF CURVES FOR 2 YEARS RETURN PERIOD (Region 3) hrs 3hrs 6hrs 12hrs 24hrs DOTD-3 Shreveport IDF CURVES FOR 5 YEARS RETURN PERIOD (Region 3) hrs 3hrs 6hrs 12hrs 24hrs DOTD-3 Shreveport IDF CURVES FOR 10 YEARS RETURN PERIOD (Region 3) hrs 3hrs 6hrs 12hrs 24hrs DOTD-3 Shreveport 46
57 Intensity (in/hr) Intensity (in/hr) Intensity (in/hr) IDF CURVES FOR 25 YEARS RETURN PERIOD (Region 3) hrs 3hrs 6hrs 12hrs 24hrs DOTD-3 Shreveport IDF CURVES FOR 50 YEARS RETURN PERIOD (Region 3) hrs 3hrs 6hrs 12hrs 24hrs DOTD-3 Shreveport IDF CURVES FOR 100 YEARS RETURN PERIOD (Region 3) hrs 3hrs 6hrs 12hrs 24hrs DOTD-3 Shreveport Figure 15. Comparisons of rainfall intensities (in/hr) for each return period for Region 3 between LADOTD Manual intensities and city that fall within the region with intensities derived using NOAA Atlas 14 upper bound rainfall intensities 47
58 Comparisons of rainfall depths between NOAA Atlas 14 upper bound limits and LADOTD Table 13 and Figure 16, Figure 17, and Figure 18 all illustrate the comparisons of NOAA Atlas 14 upper bound rainfall depths to rainfall depths derived using LADOTD Hydraulic Manual for the return periods of 2, 5, 10, 25, 50, and 100 years. Each rainfall depth, associated to its return period, presented in LADOTD Manual is compared to each city s derived rainfall depth using NOAA Atlas 14 upper bound estimates. As previously done, to further evaluate the differences within the rainfall depths, percentage differences were calculated to determine how much each cities rainfall depth, derrived using NOAA Atlas 14, changed from the LADOTD suggested rainfall depth. The differences are shown in brackets (Table 13). 48
59 Table 13. Comparisons of derived rainfall depths (in), LADOTD and NOAA Atlas 14 upper bound values, (LADOTD/Atlas 14), for each city along with percent change between the two in brackets RETURN PERIOD (yrs) DURATION (hrs) BATON NEW LAKE LAFAYETTE ROUGE ORLEANS CHARLES NATCHITOCHES SHREVEPORT 3.5/ / / /4.9 3/ /3.58 [21.43%] [35.14%] [28.57%] [40%] [32.33%] [27.86%] 4.1/ / / / / /4.2 [20%] [35.37%] [26.34%] [41.71%] [29.72%] [31.25%] 4.8/ / / /6.74 4/ /4.86 [16.88%] [34.17%] [23.33%] [40.42%] [35.50%] [35%] 4.6/ / / /6.15 4/ /4.46 [12.61%] [29.13%] [20.22%] [33.710%] [24.75%] [20.54%] 5.6/ / / / / /5.21 [8.57%] [25.36%] [15.36%] [32.50%] [21.88%] [21.16%] 6.5/ / / / / /6.05 [8.62%] [25.69%] [15.23%] [33.23%] [26.11%] [23.47%] 5.5/ / / / / /5.27 [9.45%] [30.36%] [17.64%] [33.45%] [24.79%] [19.77%] 6.7/ / / / / /6.16 [6.72%] [26.27%] [14.48%] [33.88%] [23.33%] [20.78%] 7.8/ / / / / /7.18 [7.69%] [25.64%] [15.26%] [34.62%] [25.69%] [23.79%] 6.6/ / / / / /6.75 [13.03%] [47.27%] [22.58%] [44.85%] [35.76%] [27.36%] 8.2/ / / / / /7.99 [10.73%] [37.80%] [20.61%] [45.12%] [34.71%] [28.87%] 9.6/ / / /14.1 8/10.9 7/9.36 [12.50%] [34.38%] [22.92%] [46.88%] [36.25%] [33.71%] 7.6/ / / / /9.53 6/7.87 [12.50%] [53.95%] [22.63%] [47.37%] [38.12%] [31.17%] 9.5/ / / / /11.2 7/9.38 [10.53%] [42.11%] [22.11%] [48.42%] [38.27%] [34%] 11.1/ / / / / Aug [14.41%] [36.94%] [26.13%] [50.45%] [40.22%] [37.50%] 8.6/ /14 8.6/ / / /9.21 [14.07%] [62.79%] [24.42%] [54.65%] [44.30%] [35.44%] 10.9/ / / / / /11.1 [12.84%] [47.71%] [24.77%] [54.13%] [45.16%] [40.51%] 12.6/ / / / / Sep [18.25%] [42.86%] [31.75%] [58.73%] [47.62%] [44.44%] 49
60 Rainfall (in) Rainfall (in) Rainfall (in) 2 Year Rainfall Depths (Region 1) hrs 12 hrs 24 hrs REGION 1 BATON ROUGE NEW ORLEANS LAFAYETTE LAKE CHARLES 5 Year Rainfall Depths (Region 1) hrs 12 hrs 24 hrs REGION 1 BATON ROUGE NEW ORLEANS LAFAYETTE LAKE CHARLES 10 Year Rainfall Depths (Region 1) hrs 12 hrs 24 hrs REGION 1 BATON ROUGE NEW ORLEANS LAFAYETTE LAKE CHARLES 50
61 Rainfall (in) Rainfall (in) Rainfall (in) 25 Year Rainfall Depths (Region 1) hrs 12 hrs 24 hrs REGION 1 BATON ROUGE NEW ORLEANS LAFAYETTE LAKE CHARLES 50 Year Rainfall Depths (Region 1) hrs 12 hrs 24 hrs REGION 1 BATON ROUGE NEW ORLEANS LAFAYETTE LAKE CHARLES 100 Year Rainfall Depths (Region 1) hrs 12 hrs 24 hrs REGION 1 BATON ROUGE NEW ORLEANS LAFAYETTE LAKE CHARLES Figure 16. Comparisons of rainfall depths (in) for each return period for Region 1 between LADOTD Manual intensities and city that fall within the region with rainfall depths derived using NOAA Atlas 14 Upper Bound Estimates 51
62 Rainfall (in) Rainfall (in) Rainfall (in) 2 Year Rainfall Depths (Region 2) hrs 12 hrs 24 hrs REGION 2 NATCHITOCHES 5 Year Rainfall Depths (Region 2) hrs 12 hrs 24 hrs REGION 2 NATCHITOCHES 10 Year Rainfall Depths (Region 2) hrs 12 hrs 24 hrs REGION 2 NATCHITOCHES 52
63 Rainfall (in) Rainfall (in) Rainfall (in) 25 Year Rainfall Depths (Region 2) hrs 12 hrs 24 hrs REGION 2 NATCHITOCHES 50 Year Rainfall Depths (Region 2) hrs 12 hrs 24 hrs REGION 2 NATCHITOCHES 100 Year Rainfall Depths (Region 2) hrs 12 hrs 24 hrs REGION 2 NATCHITOCHES Figure 17.Comparisons of rainfall depths (in) for each return period for Region 2 between LADOTD Manual intensities and city that fall within the region with rainfall depths derived using NOAA Atlas 14 Upper Bound Estimates 53
64 Rainfall (in) Rainfall (in) Rainfall (in) 2 Year Rainfall Depths (Region 3) hrs 12 hrs 24 hrs REGION 3 SHREVEPORT 5 Year Rainfall Depths (Region 3) hrs 12 hrs 24 hrs REGION 3 SHREVEPORT 10 Year Rainfall Depths (Region 3) hrs 12 hrs 24 hrs REGION 3 SHREVEPORT 54
65 Rainfall (in) Rainfall (in) Rainfall (in) 25 Year Rainfall Depths (Region 3) hrs 12 hrs 24 hrs REGION 3 SHREVEPORT 50 Year Rainfall Depths (Region 3) hrs 12 hrs 24 hrs REGION 3 SHREVEPORT 100 Year Rainfall Depths (Region 3) hrs 12 hrs 24 hrs REGION 3 SHREVEPORT Figure 18. Comparisons of rainfall depths (in) for each return period for Region 3 between LADOTD Manual intensities and city that fall within the region with rainfall depths derived using NOAA Atlas 14 Upper Bound Estimates 55
66 Peak Discharge (Q) Calculations and Comparisons Knowing that there are differences in rainfall intensities when using NOAA Atlas 14 rainfall estimates, the next step was to see how those new rainfall inensities affect the design of a certain water related projects. For any water related project design, one of the key parameters of the design is the peak disharge. The National Oceanic and Atmospheric Administration (NOAA) defines peak disharge as the highest rate of discharge of a volume of water passing a given location during a given period of time (e.g., during the year, or a flood event). (NOAA, 2017) To calculate peak discharge, the Rational method (pg.19) was used. Note that the Rational Method formula from Equation 1 is simply a multiplication of drainage area, rational method runoff coefficient, and rainfall intensity. Since we are comparing the new rainfall intensities derived using NOAA Atlas 14, the drainage area and Rational method runoff coefficient are kept constant at 90 acres and 0.65, respectively. Note that it is unimportant which value is chosen since it will not effect the comparisons in the results. Only changing variable is rainfall intenisty, i. Using these values, the peak discharges were calculated for each return period, using the apropriate rainfall intensity. The graphs in Figure 19 show, for each return period and duration, rainfall intensities (in/hr) and calculated peak discharges, Q (cfs), using the rainfall intensities. Also, note that within the graphs DOTD-1 stands for Region 1, DOTD-2 for Region 2, and DOTD-3 for Region 3 from LADOTD Hydraulics Manual, as shown in Figure 5. Six cities in three different LADOTD designated regions are: Baton Rouge, New Orleans, Lafayette, and Lake Charles all fall in Region 1, Natchitoches falls in Region 2, and Shreveport falls in Region 3. 56


67 a) b) 57
68 c) d) 58
 values using each of the rainfall intensities previously derived (top graphs) with assumptions stated for Rational")
69 e) f) Figure 19. (a-f) Top graph is comparisons of derived rainfall intensities (in/hr) for each return period. Bottom graph is comparisons of calculated peak discharge (cfs) values using each of the rainfall intensities previously derived (top graphs) with assumptions stated for Rational Method. *DOTD-1 is Region 1, DOTD-2 is Region 2, and DOTD-3 is Region 3. 59
70 The percentage differences for each of the return periods for peak discharges were exactly the same as the ones from the intensity comparisons in Table 10. They are the same because, when using the the Rational Method the only changing variable is the intensity (i) and the other two variables (drainage area, A, and rational method runoff coefficient, C) are kept constant. From this analysis, it can be concluded that when using the upper bound estimates from NOAA Atlas percent interval to calculate the peak discharges, the resulting percentage differences in peak disharges will be the precisely the same as the ones presented in Table 12. Infrastructure Design Calculations and Comparisons The next step of the analysis was to determine if the changes in peak discharges, calculated using the NOAA Atlas 14 rainfall intensities, impact the design of water related infrastructures in Louisiana. For this section, two project types were chosen for evaluation: Open roadside channels and Culverts. All of the project design calculations follow the guidelines set in LADOTD Hydraulics Manual. Design of an Open Roadside Channel The initial step was to examine what impacts the NOAA Atlas 14 design rainfall intensities and resultant peak discharges would have on the design of a simple open roadside channel. The design guidelines for open channel hydraulics are covered in chapter four of the LADOTD Hydraulics Manual. DOTD stipulates that open channels shall be sized and analyzed according to the Manning s equation to accommodate the design flow from the area draining into the channel (LADOTD Hydraulics Manual, 2011). For simplicity purposes, three types of open channels were chosen: Open Lined Channel, Open Excavated Channel, and Highway Channels and Swales with Maintained Vegetation. An Excel spreadsheet was developed using the DOTD equations and guidelines and used to calculate 60
71 and compare the resulting Area of the Flow (ft^2), Wetted Perimeter (ft), Depth (ft), and Width (ft) of each channel type. There are four inputs that need to be provided by the user to get the results: Peak Disharge, Manning s n, Channel Slope, and the Side Slope. The Manning s n, for each of the channel types, was chosen from Table 17, which is given in LADOTD Hydraulics Manual. For easier comparison of the results, the side slope, Z, and bed slope, S, of the channel were kept constant. The LADOTD Hydraulics Manual states that trapezoidal sections are normally used with the side slopes not to be steeper than 3:1 therefore, this value was used here. Also, from the Manual, the suggested bed slope was set to be 0.1 %. Note that from Table 4, the minimum required design storm frequency for Roadside Channel is 5 years and the duration is 24 hours. However, when designing for a culvert, the minimum design storm frequency is 50 years. Therefore, the channel design analysis was also done for the 50 year storm, with the assumption that the channel would be conveying water to or from the culvert. Therefore, channels with 50 year storm frequencies were designed. The 50 year 24 hour peak discharge values used are the ones calculated using the Rational Method and the LADOTD regional and the NOAA Atlas 14 based rainfall intensities (both average and upper 90% bound values). The peak discharges are shown in Table 15 and Table
72 Table 14. Example Excel Spreadsheet used to calculate all of the parameters needed in design of an Open Roadside Channel. DOTD-1 Baton Rouge Trapezoidal Channel Spreadsheet New Orleans Lafayette Lake Charles DOTD-2 Natchitoches DOTD-3 Shreveport Input Q (50yr, 24hrs) (cfs) Input Manning s n Input Channel Slope, S A*R^2/ Depth, D (ft) Channel Width, B (ft), Input Side Slope, Z Area of Flow (ft^2), A Wetted Perimeter, P (ft) Hydraulic Radius, R (ft) Check for A*R^2/ Calculated Velocity, V (ft/sec^2) Top Width, T (ft) Table 15. Resulting Peak Discharges for 50 year return period with mean NOAA Atlas years DOTD-1 Baton Rouge New Orleans Lafayette Lake Charles DOTD-2 Natchitoches DOTD-3 Shreveport Q (50yr, 2hrs) Q (50yr, 3hrs) Q (50yr, 6hrs) Q (50yr, 12hrs) Q (50yr, 24hrs) Table 16. Resulting Peak Discharges for 50 year return period with upper bound estimates from NOAA Atlas years DOTD-1 Baton Rouge New Orleans Lafayette Lake Charles DOTD-2 Natchitoches DOTD-3 Shreveport Q (50yr, 2hrs) Q (50yr, 3hrs) Q (50yr, 6hrs) Q (50yr, 12hrs) Q (50yr, 24hrs)
 Table 18 (a-c) and Figure 20 show the calculated Channel Depths, Widths, Areas of Flow, and Wetted Perimeters for")
73 Table 17. Manning s Roughness Coefficient for Channel Linings (LADOTD Hydraulics Manual, 2011) Table 18 (a-c) and Figure 20 show the calculated Channel Depths, Widths, Areas of Flow, and Wetted Perimeters for each of the three Channel types and the calculated 50 year, 24 hour peak discharges. Table 18. Results using the Excel Spreadsheet for each channel (a. Open Excavated, b. Open Lined, c. Highway Channels and Swales with Maintained Vegetation) using mean estimates from NOAA Atlas 14 a) Open Excavated Channel DOTD-1 Baton Rouge New Orleans Lafayette Lake Charles DOTD-2 Natchitoches DOTD-3 Shreveport Q (50yr, 24hrs) (cfs) Depth (ft), D Channel Width (ft), B Area of Flow (ft^2), A Wetted Perimeter (ft), P
74 b) Open Lined Channel DOTD-1 Baton Rouge New Orleans Lafayette Lake Charles DOTD-2 Natchitoches DOTD-3 Shreveport Q (50yr, 24hrs) (cfs) Depth (ft), D Channel Width (ft), B Area of Flow (ft^2), A Wetted Perimeter (ft), P c) Highway Channels and Swales with Maintained Vegetation to 2 Inches DOTD-1 Baton Rouge New Orleans Lafayette Lake Charles DOTD-2 Natchitoches DOTD-3 Shreveport Q (50yr, 24hrs) (cfs) Depth (ft), D Channel Width (ft), B Area of Flow (ft^2), A Wetted Perimeter (ft), P
75 Open Channel, Excavated Depth (ft), D Channel Width (ft), B Area of Flow (ft^2), A Wetted Perimiter (ft), P DOTD-1 Baton Rouge New Orleans Lafayette Lake Charles DOTD-2 Natchitoches DOTD-3 Shreveport Open Channel, Lined Depth f(t), D Channel Width (ft), B Area of Flow (ft^2), A Wetted Perimiter (ft), P DOTD-1 Baton Rouge New Orleans Lafayette Lake Charles DOTD-2 Natchitoches DOTD-3 Shreveport Highway Channels and Swales with Maintained Vegetation - Moved to 2" Depth f(t), D Channel Width (ft), B Area of Flow (ft^2), A Wetted Perimiter (ft), P DOTD-1 Baton Rouge New Orleans Lafayette Lake Charles DOTD-2 Natchitoches DOTD-3 Shreveport Figure 20. Comparisons for Open Excavated Channel, Open Lined Channel, and Highway Channels and Swales with Maintained Vegetation *DOTD-1 is Region 1, DOTD-2 is Region 2, and DOTD-3 is Region 3 65
76 Table 19 shows the % difference in the calculated channel parameters between the average NOAA Atlas 14- and the LADOTD- based rainfall values. Table 19. Differences (%) in resulting parameters for individual city when compared to LADOTD suggested parameters for each of the return periods using NOAA Atlas 14 mean estimates All Cities Compared to LADOTD Difference (%) DOTD-1 Baton Rouge New Orleans Lafayette Lake Charles DOTD-2 Shreveport DOTD-3 Natchitoches Q (50yr, 24hrs) (cfs) Area of Flow (ft^2), A Channel Width (ft), B Channel Depth (ft), D It is to be noted here that the differences calculated for each of the channel types (Open Excavated, Open Lined, and Highway Channels and Swales with Maintained Vegetation) are all the exact same since the only input parameter that is changed is the Manning s n. Also, Wetted Perimeter parameter differences are exactly the same as Channel Width and Channel Depth. Table 20 (a-c), and Figure 21 show the channel parameters calculated using the NOAA Atlas 90% upper bound rainfall estimates. 66
77 Table 20. Results using the Excel Spreadsheet for each channel (a. Open Excavated, b. Open Lined, c. Highway Channels and Swales with Maintained Vegetation) using upper bound estimates from NOAA Atlas 14 a) Open Excavated Channel DOTD-1 Baton Rouge New Orleans Lafayette Lake Charles DOTD-2 Natchitoches DOTD-3 Shreveport Q (50yr, 24hrs) (cfs) Depth (ft), D Channel Width (ft), B Area of Flow (ft^2), A Wetted Perimeter (ft), P b) Open Lined Channel DOTD-1 Baton Rouge New Orleans Lafayette Lake Charles DOTD-2 Natchitoches DOTD-3 Shreveport Q (50yr, 24hrs) (cfs) Depth (ft), D Channel Width (ft), B Area of Flow (ft^2), A Wetted Perimeter (ft), P c) Highway Channels and Swales with Maintained Vegetation to 2 Inches DOTD-1 Baton Rouge New Orleans Lafayette Lake Charles DOTD-2 Natchitoches DOTD-3 Shreveport Q (50yr, 24hrs) (cfs) Depth (ft), D Channel Width (ft), B Area of Flow (ft^2), A Wetted Perimeter (ft), P


78 Figure 21. Comparisons for Open Excavated Channel, Open Lined Channel, and Highway Channels and Swales with Maintained Vegetation *DOTD-1 is Region 1, DOTD-2 is Region 2, and DOTD-3 is Region 3. 68
79 Table 21 shows the % difference in the calculated channel parameters between the 90% upper bound NOAA Atlas 14- and the LADOTD-based rainfall values. Table 21. Differences (%) in resulting parameters for individual city when compared to LADOTD suggested parameters for each of the return periods using NOAA Atlas 14 upper bound estimates All Cities Compared to LADOTD Difference (%) DOTD-1 Baton Rouge New Orleans Lafayette Lake Charles DOTD-2 Shreveport DOTD-3 Natchitoches Q (5yr, 24hrs) (cfs) Area of Flow (ft^2), A Channel Width (ft), B Channel Depth (ft), D As before, the differences calculated for each of the channel types (Open Excavated, Open Lined, and Highway Channels and Swales with Maintained Vegetation) are all the exact same since the only input parameter that is changed is the Manning s n. Design of Culverts The next step was to look at what impacts the NOAA Atlas 14 rainfall intensities and Rational Method calculated peak discharges would have on the design of a culvert. The design guidelines and equations for culvert hydraulics are covered in chapters five and six. The hydraulic design of a cross drain consists of an analysis of the performance of the culvert in conveying flow from one side of the roadway to the other. Proper culvert design includes discharge, tailwater elevation, headwater elevation, proper alignment, outlet velocity and proper maintenance (LADOTD Hydraulics Manual, 2011). 69
80 Culvert design includes the use of the following terms and concepts (LADOTD Hydraulics Manual, 2011): Allowable Differential Head (ΔH): The difference between headwater and tailwater. Flow Line (FL): Flow line is defined as the elevation of the bottom of the inside of a culvert. Headwater (HW): Any culvert, which constricts the natural stream flow, will cause a rise in upstream water surface to some extent. Headwater (HW) is defined as the total flow depth of the upstream water surface measured from the culvert inlet flow line. Tailwater (TW): Tailwater (TW) is defined as the flow depth of water downstream of the culvert measured from the flow line of the culvert outlet. Tailwater can be an important factor in culvert hydraulic design because a submerged outlet may cause culverts to flow full rather than partially full. The design storm frequency used in the analysis is based on the Projected Annual Average Daily Traffic (PAADT). The figure below, Figure 22, shows the general guidelines for design parameters for a project with related topography. 70
 controls, it should be less than or equal to one foot.")
81 Figure 22. Guidelines for design parameters Allowable Headwater, AHW, and Allowable Differential Head, ADH (LADOTD Hydraulics Manual, 2011) Differential head is most practical design consideration. On one hand, in areas that Differential Head ( H) controls, it should be less than or equal to one foot. On the other hand, in areas that are flood sensitive (such as urban areas in low spots that flood frequently), ΔH should be kept at a slight increase that does not exceed 0.5 ft. Overall, when the gradient of the upstream land is appreciable and the existing development is smallest, then the Allowable Headwater (AHW) asserts more importance than the Differential Head (ΔH). It is also important to note that the Allowable Headwater Elevation for the design event should be at least one foot below the lowest 71
82 elevation of the paved surface (excluding the shoulder), but may not exceed three (3) feet above the top opening elevation of the pipe.citation. (LADOTD Hydraulics Manual, 2011) The LADOTD Hydraulics Manual specifies use of the following programs for the design of hydraulic structures for LADOTD highways: A. The LADOTD computer program HYDR1120: Hydraulic Analysis of Culverts is based on the procedures outlined in this section. B. HY 8 FHWA computer program for hydraulic analysis of culverts. Federal Highway Administration's (FHWA) software package HY-8 is a direct and technically accurate approach to culvert analysis. HY-8 automates culvert hydraulic computations utilizing a number of essential features that make culvert analysis and design easier (Bridges & Structures, 2017). HY-8 allows users to evaluate: The performance of culverts Multiple culvert barrels at a single crossing as well as multiple crossings Roadway overtopping at the crossing Documentation in the form of performance tables, graphs, and key information regarding the input variables HY-8 Culvert Hydraulic Analysis Program can be used to perform calculations for culvert analysis (including independent and multiple barrel sizing), hydrograph generation, hydrograph routing, roadway overtopping and outlet scour estimates. With the appropriate input data, HY-8 computes the culvert hydraulics for circular, rectangular, elliptical, arch and custom culverts. To conduct the culvert analysis, there needs to be a particular culvert file, which much include the following: maximum discharge values, inlet and outlet stations and inverts, culvert material and 72
 These values can be input into HY-8 using the step-by-step data editor (Figure 23) for creating a new file or modifying an existing file. a) Figure 23.")
83 dimensions, inlet type and inlet conditions, roadway elevation and material, and a tailwater rating curve. (Ministry of Transportation, 2013) These values can be input into HY-8 using the step-by-step data editor (Figure 23) for creating a new file or modifying an existing file. a) Figure 23. Peak Discharge data (left) and input data editor (right) in HY-8 Figure 24 (a and b) is a visual representation of the HY-8 input parameters. Flow River or Channel Road Crest Lenght 73
Design Storms for Hydrologic Analysis
 Design Storms for Hydrologic Analysis Course Description This course is designed to fulfill two hours of continuing education credit for Professional Engineers. Its objective is to provide students with
Extreme Rain all Frequency Analysis for Louisiana
 78 TRANSPORTATION RESEARCH RECORD 1420 Extreme Rain all Frequency Analysis for Louisiana BABAK NAGHAVI AND FANG XIN Yu A comparative study of five popular frequency distributions and three parameter estimation
New NOAA Precipitation-Frequency Atlas for Wisconsin
 New NOAA Precipitation-Frequency Atlas for Wisconsin #215966 Presentation to the Milwaukee Metropolitan Sewerage District Technical Advisory Team January 16, 2014 Michael G. Hahn, P.E., P.H. SEWRPC Chief
LITERATURE REVIEW. History. In 1888, the U.S. Signal Service installed the first automatic rain gage used to
 LITERATURE REVIEW History In 1888, the U.S. Signal Service installed the first automatic rain gage used to record intensive precipitation for short periods (Yarnell, 1935). Using the records from this
Changes to Extreme Precipitation Events: What the Historical Record Shows and What It Means for Engineers
 Changes to Extreme Precipitation Events: What the Historical Record Shows and What It Means for Engineers Geoffrey M Bonnin National Oceanic and Atmospheric Administration National Weather Service Office
Results of Intensity-Duration- Frequency Analysis for Precipitation and Runoff under Changing Climate
 Results of Intensity-Duration- Frequency Analysis for Precipitation and Runoff under Changing Climate Supporting Casco Bay Region Climate Change Adaptation RRAP Eugene Yan, Alissa Jared, Julia Pierce,
Section 4: Model Development and Application
 Section 4: Model Development and Application The hydrologic model for the Wissahickon Act 167 study was built using GIS layers of land use, hydrologic soil groups, terrain and orthophotography. Within
The effectiveness of the Natural Resource Conservation Service (NRCS) and Huff rainfall distribution methods for use in detention basin design
 and Huff rainfall distribution methods for use in detention basin design") Scholars' Mine Masters Theses Student Theses and Dissertations Spring 2010 The effectiveness of the Natural Resource Conservation Service (NRCS) and Huff rainfall distribution methods for use in detention
Scholars' Mine Masters Theses Student Theses and Dissertations Spring 2010 The effectiveness of the Natural Resource Conservation Service (NRCS) and Huff rainfall distribution methods for use in detention
INFLOW DESIGN FLOOD CONTROL SYSTEM PLAN 40 C.F.R. PART PLANT YATES ASH POND 2 (AP-2) GEORGIA POWER COMPANY
 GEORGIA POWER COMPANY") INFLOW DESIGN FLOOD CONTROL SYSTEM PLAN 40 C.F.R. PART 257.82 PLANT YATES ASH POND 2 (AP-2) GEORGIA POWER COMPANY EPA s Disposal of Coal Combustion Residuals from Electric Utilities Final Rule (40 C.F.R.
INFLOW DESIGN FLOOD CONTROL SYSTEM PLAN 40 C.F.R. PART 257.82 PLANT YATES ASH POND 2 (AP-2) GEORGIA POWER COMPANY EPA s Disposal of Coal Combustion Residuals from Electric Utilities Final Rule (40 C.F.R.
Using PRISM Climate Grids and GIS for Extreme Precipitation Mapping
 Using PRISM Climate Grids and GIS for Extreme Precipitation Mapping George H. Taylor, State Climatologist Oregon Climate Service 316 Strand Ag Hall Oregon State University Corvallis OR 97331-2209 Tel:
Updating Precipitation Intensities for Runoff Estimation and Infrastructure Designs.
 PROJECT TITLE: Estimation and Infrastructure Designs. PROJECT MANAGER: C. Bruce Wilson AFFILIATION : Minnesota Pollution Control Agency MAILING ADDRESS: 520 Lafayette Road North CITY/STATE/ZIP: St. Paul,
Technical Memorandum. City of Salem, Stormwater Management Design Standards. Project No:
 Technical Memorandum 6500 SW Macadam Avenue, Suite 200 Portland, Oregon, 97239 Tel: 503-244-7005 Fax: 503-244-9095 Prepared for: Project Title: City of Salem, Oregon City of Salem, Stormwater Management
Hydrology and Hydraulics Design Report. Background Summary
 To: National Park Services Montezuma Castle National Monument Richard Goepfrich, Facility Manager From: Multicultural Technical Engineers Date: Tuesday - February 13, 2018 Subject: 30% Hydrology and Hydraulics
THE DEVELOPMENT OF RAIN-BASED URBAN FLOOD FORECASTING METHOD FOR RIVER MANAGEMENT PRACTICE USING X-MP RADAR OBSERVATION
 Research Paper Advances in River Engineering, JSCE, Vol.19, 2013,June THE DEVELOPMENT OF RAIN-BASED URBAN FLOOD FORECASTING METHOD FOR RIVER MANAGEMENT PRACTICE USING X-MP RADAR OBSERVATION Seongsim YOON
Flash Flood Guidance System On-going Enhancements
 Flash Flood Guidance System On-going Enhancements Hydrologic Research Center, USA Technical Developer SAOFFG Steering Committee Meeting 1 10-12 July 2017 Jakarta, INDONESIA Theresa M. Modrick Hansen, PhD
RAINFALL FREQUENCY ANALYSIS FOR NEW BRAUNFELS, TX (or Seems like we ve been having lots of 100-yr storms)
") RAINFALL FREQUENCY ANALYSIS FOR NEW BRAUNFELS, TX (or Seems like we ve been having lots of 100-yr storms) Presented By: SAUL NUCCITELLI, PE, CFM (LAN) BLAKE KRONKOSKY, EIT (LAN) JIM KLEIN, PE (CITY OF
RAINFALL FREQUENCY ANALYSIS FOR NEW BRAUNFELS, TX (or Seems like we ve been having lots of 100-yr storms) Presented By: SAUL NUCCITELLI, PE, CFM (LAN) BLAKE KRONKOSKY, EIT (LAN) JIM KLEIN, PE (CITY OF
USGS ATLAS. BACKGROUND
 USGS ATLAS. BACKGROUND 1998. Asquith. DEPTH-DURATION FREQUENCY OF PRECIPITATION FOR TEXAS. USGS Water-Resources Investigations Report 98 4044. Defines the depth-duration frequency (DDF) of rainfall annual
Depth-Duration Frequency (DDF) and Depth-Area- Reduction Factors (DARF)
 and Depth-Area- Reduction Factors (DARF)") Spatial Analysis of Storms Using GIS Brian Hoblit, Steve Zelinka, Cris Castello, and David Curtis Abstract Point data from rain gages have been historically used to develop depth-area relationships, design
Spatial Analysis of Storms Using GIS Brian Hoblit, Steve Zelinka, Cris Castello, and David Curtis Abstract Point data from rain gages have been historically used to develop depth-area relationships, design
ENGINEERING HYDROLOGY
 ENGINEERING HYDROLOGY Prof. Rajesh Bhagat Asst. Professor Civil Engineering Department Yeshwantrao Chavan College Of Engineering Nagpur B. E. (Civil Engg.) M. Tech. (Enviro. Engg.) GCOE, Amravati VNIT,
Volume 1, Chapter 4 Rainfall
 Volume 1, Chapter 4 Rainfall Users Guidance: If a UDFCD Section number in this chapter is skipped: It was adopted as is; please refer to that Section in the corresponding UDFCD Manual, Volume, Chapter
HEC-HMS Lab 4 Using Frequency Storms in HEC-HMS
 HEC-HMS Lab 4 Using Frequency Storms in HEC-HMS Created by Venkatesh Merwade (vmerwade@purdue.edu) Learning outcomes The objective of this lab is to learn how HEC-HMS is used to determine design flow by
THE 3D SIMULATION INFORMATION SYSTEM FOR ASSESSING THE FLOODING LOST IN KEELUNG RIVER BASIN
 THE 3D SIMULATION INFORMATION SYSTEM FOR ASSESSING THE FLOODING LOST IN KEELUNG RIVER BASIN Kuo-Chung Wen *, Tsung-Hsing Huang ** * Associate Professor, Chinese Culture University, Taipei **Master, Chinese
Ground Water Protection Council 2017 Annual Forum Boston, Massachusetts. Ben Binder (303)
") Ground Water Protection Council 2017 Annual Forum Boston, Massachusetts Protecting Groundwater Sources from Flood Borne Contamination Ben Binder (303) 860-0600 Digital Design Group, Inc. The Problem Houston
Ground Water Protection Council 2017 Annual Forum Boston, Massachusetts Protecting Groundwater Sources from Flood Borne Contamination Ben Binder (303) 860-0600 Digital Design Group, Inc. The Problem Houston
Generation of synthetic design storms for the Upper Thames River basin
 Generation of synthetic design storms for the Upper Thames River basin CFCAS project: Assessment of Water Resources Risk and Vulnerability to Changing Climatic Conditions Project Report V. November 2004
STREUVER FIDELCO CAPPELLI, LLC YONKERS DOWNTOWN DEVELOPMENT PHASE 1. DRAFT ENVIRONMENTAL IMPACT STATEMENT For: PALISADES POINT
 STREUVER FIDELCO CAPPELLI, LLC YONKERS DOWNTOWN DEVELOPMENT PHASE 1 DRAFT ENVIRONMENTAL IMPACT STATEMENT For: PALISADES POINT Prepared by: PAULUS, SOKOLOWSKI & SARTOR STORMWATER MANAGEMENT 1. Methodology
Rainfall and Design Storms
 Methods in Stormwater Management Using HydroCAD Rainfall and Design Storms H03 Rainfall and Design Storms.pdf 1 Topics Covered 1. Rainfall characteristics 2. Rainfall sources 3. Design Storms 4. Example:
City of Thornton Attn: Tim Semones Development Engineeering 9500 Civic Center Dr. Thornton, CO 80229
 Development Engineering Land Surveying Construction Administration District Services October 20, 2017 City of Thornton Attn: Tim Semones Development Engineeering 9500 Civic Center Dr. Thornton, CO 80229
Lecture 2: Precipitation
 2-1 GEOG415 Lecture 2: Precipitation Why do we study precipitation? Precipitation measurement -- depends on the study purpose. Non-recording (cumulative) Recording (tipping bucket) Important parameters
Objectives: After completing this assignment, you should be able to:
 Data Analysis Assignment #1 Evaluating the effects of watershed land use on storm runoff Assignment due: 21 February 2013, 5 pm Objectives: After completing this assignment, you should be able to: 1) Calculate
NEW YORK STATE WATER RESOURCES INSTITUTE Department of Biological and Environmental Engineering
 NEW YORK STATE WATER RESOURCES INSTITUTE Department of Biological and Environmental Engineering 230 Riley-Robb Hall, Cornell University Tel: (607) 254-7163 Ithaca, NY 14853-5701 Fax: (607) 255-4080 http://wri.cals.cornell.edu
Changing Climate. An Engineering challenge for today and the future. Milwaukee School of Engineering December 2, 2015
 Changing Climate An Engineering challenge for today and the future David S. Liebl UW- Madison, EPD; UW-Extension; Wisconsin Initiative on Climate change Impacts Milwaukee School of Engineering December
SOUTHERN CLIMATE MONITOR
 SOUTHERN CLIMATE MONITOR MARCH 2011 VOLUME 1, ISSUE 3 IN THIS ISSUE: Page 2 to 4 Severe Thunderstorm Climatology in the SCIPP Region Page 4 Drought Update Page 5 Southern U.S. Precipitation Summary for
David R. Vallee Hydrologist-in-Charge NOAA/NWS Northeast River Forecast Center
 David R. Vallee Hydrologist-in-Charge NOAA/NWS Northeast River Forecast Center Record flooding along the Shawsheen River during the 2006 Mother s Day Floods Calibrate and implement a variety of hydrologic
RELIABILITY OF DESIGN STORMS IN MODELLING
 Page 1 of 13 RELIABILITY OF DESIGN STORMS IN MODELLING BY BEN URBONAS CHIEF, MASTER P LANNING P ROGRAM URBAN DRAINAGE AND FLOOD CONTROL DISTRICT DENVER, COLORADO Abstract. Stormwater runoff is generally
1. TEMPORAL CHANGES IN HEAVY RAINFALL FREQUENCIES IN ILLINOIS
 to users of heavy rainstorm climatology in the design and operation of water control structures. A summary and conclusions pertaining to various phases of the present study are included in Section 8. Point
ARTICLE 5 (PART 2) DETENTION VOLUME EXAMPLE PROBLEMS
 DETENTION VOLUME EXAMPLE PROBLEMS") ARTICLE 5 (PART 2) DETENTION VOLUME EXAMPLE PROBLEMS Example 5.7 Simple (Detention Nomograph) Example 5.8 Offsite and Unrestricted Areas (HEC-HMS) Example 5.9 Ponds in Series w/ Tailwater (HEC-HMS) Example
ARTICLE 5 (PART 2) DETENTION VOLUME EXAMPLE PROBLEMS Example 5.7 Simple (Detention Nomograph) Example 5.8 Offsite and Unrestricted Areas (HEC-HMS) Example 5.9 Ponds in Series w/ Tailwater (HEC-HMS) Example
Doug Kluck NOAA Kansas City, MO National Center for Environmental Information (NCEI) National Integrated Drought Information System (NIDIS)
 National Integrated Drought Information System (NIDIS)") National Integrated Drought Information System (NIDIS) for the Missouri River Basin Drought Early Warning Information System (DEWS) & Runoff Trends in the Missouri Basin & Latest Flood Outlook Doug Kluck
National Integrated Drought Information System (NIDIS) for the Missouri River Basin Drought Early Warning Information System (DEWS) & Runoff Trends in the Missouri Basin & Latest Flood Outlook Doug Kluck
An Alternative Temporal Rainfall Distribution for Hydrologic Analysis and Design
 An Alternative Temporal Rainfall Distribution for Hydrologic Analysis and Design Joseph P. Wilson, PE, PH Wilson Hydro, LLC PhD Candidate Missouri University of Science Technology Rolla, Missouri Sorry
FLOOD/SCS EVENT, APRIL 28 MAY 4
 REPORT DATE: May 4, 2017 EVENT DATE: April 28-May 4, 2017 FLOOD/SCS EVENT, APRIL 28 MAY 4 Event Summary General Significant Flood Outlook. SOURCE: National Weather Service. A significant severe thunderstorm
 Red River Flooding June 2015 Caddo and Bossier Parishes Presented by: Flood Technical Committee Where the Rain Falls Matters I-30 versus I-20 I-20 Backwater and Tributary Floods (Localized) 2016 Flood
Another 100-Year Storm. October 26, 2016 Mark Dennis, PE, CFM
 Another 100-Year Storm October 26, 2016 Mark Dennis, PE, CFM Agenda Are severe rainfall events becoming more frequent? Is there confusion about the 100-year storm that makes it seem like they happen all
Floodplain Modeling and Mapping Using The Geographical Information Systems (GIS) and Hec-RAS/Hec-GeoRAS Applications. Case of Edirne, Turkey.
 and Hec-RAS/Hec-GeoRAS Applications. Case of Edirne, Turkey.") Floodplain Modeling and Mapping Using The Geographical Information Systems (GIS) and Hec-RAS/Hec-GeoRAS Applications. Case of Edirne, Turkey. Fuad Hajibayov *1, Basak Demires Ozkul 1, Fatih Terzi 1 1 Istanbul
Floodplain Modeling and Mapping Using The Geographical Information Systems (GIS) and Hec-RAS/Hec-GeoRAS Applications. Case of Edirne, Turkey. Fuad Hajibayov *1, Basak Demires Ozkul 1, Fatih Terzi 1 1 Istanbul
Updated Precipitation Frequency Estimates for Minnesota
 1 Updated Precipitation Frequency Estimates for Minnesota Presenter: Authors: (alphabetical order) Sanja Perica, Director Hydrometeorological Design Studies Center (HDSC), Office of Hydrology, National
Comparative Analysis of Hurricane Vulnerability in New Orleans and Baton Rouge. Dr. Marc Levitan LSU Hurricane Center. April 2003
 Comparative Analysis of Hurricane Vulnerability in New Orleans and Baton Rouge Dr. Marc Levitan LSU Hurricane Center April 2003 In order to compare hurricane vulnerability of facilities located in different
Climate Change and Stormwater. Daniel Brown, Research Associate, GLISA
 Climate Change and Stormwater Daniel Brown, Research Associate, GLISA Global Trends and Regional Trends Global trends are more certain than regional trends. Natural variability plays a larger role at the
Intensity-Duration-Frequency (IDF) Curves Example
 Curves Example") Intensity-Duration-Frequency (IDF) Curves Example Intensity-Duration-Frequency (IDF) curves describe the relationship between rainfall intensity, rainfall duration, and return period (or its inverse, probability
Intensity-Duration-Frequency (IDF) Curves Example Intensity-Duration-Frequency (IDF) curves describe the relationship between rainfall intensity, rainfall duration, and return period (or its inverse, probability
New design rainfalls. Janice Green, Project Director IFD Revision Project, Bureau of Meteorology
 New design rainfalls Janice Green, Project Director IFD Revision Project, Bureau of Meteorology Design Rainfalls Design Rainfalls Severe weather thresholds Flood forecasting assessing probability of rainfalls
Lessons Learned and Shared
 Lessons Learned and Shared Plan for the worst. Hope for the best. Remember that hope is not a strategy. Agnes 8 Lessons 1. Identify Susceptible Communities 2. Develop a Plan 3. Threat Recognition 4. Review
Typical Hydrologic Period Report (Final)
") (DELCORA) (Final) November 2015 (Updated April 2016) CSO Long-Term Control Plant Update REVISION CONTROL REV. NO. DATE ISSUED PREPARED BY DESCRIPTION OF CHANGES 1 4/26/16 Greeley and Hansen Pg. 1-3,
(DELCORA) (Final) November 2015 (Updated April 2016) CSO Long-Term Control Plant Update REVISION CONTROL REV. NO. DATE ISSUED PREPARED BY DESCRIPTION OF CHANGES 1 4/26/16 Greeley and Hansen Pg. 1-3,
Analysis of the Sacramento Soil Moisture Accounting Model Using Variations in Precipitation Input
 Meteorology Senior Theses Undergraduate Theses and Capstone Projects 12-216 Analysis of the Sacramento Soil Moisture Accounting Model Using Variations in Precipitation Input Tyler Morrison Iowa State University,
TXHYETO.XLS: A Tool To Facilitate Use of Texas- Specific Hyetographs for Design Storm Modeling. Caroline M. Neale Texas Tech University
 TXHYETO.XLS: A Tool To Facilitate Use of Texas- Specific Hyetographs for Design Storm Modeling Caroline M. Neale Texas Tech University Acknowledgements Funding and direction provided by the Texas Department
Climatic Change Implications for Hydrologic Systems in the Sierra Nevada
 Climatic Change Implications for Hydrologic Systems in the Sierra Nevada Part Two: The HSPF Model: Basis For Watershed Yield Calculator Part two presents an an overview of why the hydrologic yield calculator
The Great USA Flood of 1993
 Destructive Water: Water-Caused Natural Disasters, their Abatement and Control (Proceedings of the Conference held at Anaheim, California, June 1996). IAHS Publ. no, 239, 1997. 13 The Great USA Flood of
Chapter 5 CALIBRATION AND VERIFICATION
 Chapter 5 CALIBRATION AND VERIFICATION This chapter contains the calibration procedure and data used for the LSC existing conditions model. The goal of the calibration effort was to develop a hydraulic
Monte Carlo Simulations for Probabilistic Flood Hazard Assessment
 Monte Carlo Simulations for Probabilistic Flood Hazard Assessment Jemie Dababneh, Ph.D., P.E., 1 and Mark Schwartz, P.E. 1 1 RIZZO Associates, Monroeville, Pennsylvania Presentation to PSA 2017 International
LOCATED IN INDIAN RIVER COUNTY PREPARED FOR S.J.R.W.M.D. AND F.W.C.D. DECEMBER, 2003 Updated 2007 Updated May 2014 PREPARED BY
 FELLSMERE WATER CONTROL DISTRICT EAST MASTER DRAINAGE PLAN AND STORMWATER HYDROLOGIC ANALYSIS OF THE GRAVITY DRAINAGE SYSTEM LOCATED BETWEEN THE EAST BOUNDARY, LATERAL U, THE MAIN CANAL, AND DITCH 24 LOCATED
Stormwater Guidelines and Case Studies. CAHILL ASSOCIATES Environmental Consultants West Chester, PA (610)
") Stormwater Guidelines and Case Studies CAHILL ASSOCIATES Environmental Consultants West Chester, PA (610) 696-4150 www.thcahill.com Goals and Challenges for Manual State Stormwater Policy More Widespread
Stormwater Guidelines and Case Studies CAHILL ASSOCIATES Environmental Consultants West Chester, PA (610) 696-4150 www.thcahill.com Goals and Challenges for Manual State Stormwater Policy More Widespread
Detailed Storm Rainfall Analysis for Hurricane Ivan Flooding in Georgia Using the Storm Precipitation Analysis System (SPAS) and NEXRAD Weather Radar
 and NEXRAD Weather Radar") Detailed Storm Rainfall Analysis for Hurricane Ivan Flooding in Georgia Using the Storm Precipitation Analysis System (SPAS) and NEXRAD Weather Radar Ed Tomlinson, PhD and Bill Kappel Applied Weather Associates
Detailed Storm Rainfall Analysis for Hurricane Ivan Flooding in Georgia Using the Storm Precipitation Analysis System (SPAS) and NEXRAD Weather Radar Ed Tomlinson, PhD and Bill Kappel Applied Weather Associates
ANALYSIS OF RAINFALL DATA FROM EASTERN IRAN ABSTRACT
 ISSN 1023-1072 Pak. J. Agri., Agril. Engg., Vet. Sci., 2013, 29 (2): 164-174 ANALYSIS OF RAINFALL DATA FROM EASTERN IRAN 1 M. A. Zainudini 1, M. S. Mirjat 2, N. Leghari 2 and A. S. Chandio 2 1 Faculty
12/07/2017. Flash Flood Warning Service, an advanced approach towards flood resilient cities Floodplain Management Association Conference, Newcastle
 12/07/2017 Worldwide problem: Flash Floods Flash Floods are a Global Problem Flash Flood Warning Service, an advanced approach towards flood resilient cities Floodplain Management Association Conference,
Flash flood disaster in Bayangol district, Ulaanbaatar
 Flash flood disaster in Bayangol district, Ulaanbaatar Advanced Training Workshop on Reservoir Sedimentation Management 10-16 October 2007. IRTCES, Beijing China Janchivdorj.L, Institute of Geoecology,MAS
Mid-West Heavy rains 18 April 2013
 Abstract: Mid-West Heavy rains 18 April 2013 By Richard H. Grumm and Charles Ross National Weather Service State College, PA The relatively wet conditions during the first 16 days of April 2013 set the
Appendix D. Model Setup, Calibration, and Validation
 . Model Setup, Calibration, and Validation Lower Grand River Watershed TMDL January 1 1. Model Selection and Setup The Loading Simulation Program in C++ (LSPC) was selected to address the modeling needs
Lecture 14: Floods. Key Questions
 Lecture 14: Floods Key Questions 1. What is an upstream flood? 2. What is a downstream flood? 3. What were the setup conditions that cause floods? 4. What is a 100-year flood? 5. How are 100-year flood
2017 Fall Conditions Report
 2017 Fall Conditions Report Prepared by: Hydrologic Forecast Centre Date: November 15, 2017 Table of Contents TABLE OF FIGURES... ii EXECUTIVE SUMMARY... 1 BACKGROUND... 4 SUMMER AND FALL PRECIPITATION...
PRELIMINARY DRAFT FOR DISCUSSION PURPOSES
 Memorandum To: David Thompson From: John Haapala CC: Dan McDonald Bob Montgomery Date: February 24, 2003 File #: 1003551 Re: Lake Wenatchee Historic Water Levels, Operation Model, and Flood Operation This
A GIS-based Approach to Watershed Analysis in Texas Author: Allison Guettner
 Texas A&M University Zachry Department of Civil Engineering CVEN 658 Civil Engineering Applications of GIS Instructor: Dr. Francisco Olivera A GIS-based Approach to Watershed Analysis in Texas Author:
Areal Reduction Factors for the Colorado Front Range and Analysis of the September 2013 Colorado Storm
 Areal Reduction Factors for the Colorado Front Range and Analysis of the September 2013 Colorado Storm Doug Hultstrand, Bill Kappel, Geoff Muhlestein Applied Weather Associates, LLC - Monument, Colorado
Recent Updates to NOAA/NWS Precipitation Frequency Estimates
 Recent Updates to NOAA/NWS Precipitation Frequency Estimates Geoffrey M. Bonnin Director, Hydrometeorological Design Studies Center Chief, Hydrologic Data Systems Branch Office of Hydrologic Development
Climate Adaptation Challenges for Boston s Water and Sewer Systems
 National Association of Flood & Stormwater Management Agencies Climate Adaptation Challenges for Boston s Water and Sewer Systems John P Sullivan P.E. October 15,2014 Boston 1630 Boston 1630-2012 Boston
PLANNED UPGRADE OF NIWA S HIGH INTENSITY RAINFALL DESIGN SYSTEM (HIRDS)
") PLANNED UPGRADE OF NIWA S HIGH INTENSITY RAINFALL DESIGN SYSTEM (HIRDS) G.A. Horrell, C.P. Pearson National Institute of Water and Atmospheric Research (NIWA), Christchurch, New Zealand ABSTRACT Statistics
PLANNED UPGRADE OF NIWA S HIGH INTENSITY RAINFALL DESIGN SYSTEM (HIRDS) G.A. Horrell, C.P. Pearson National Institute of Water and Atmospheric Research (NIWA), Christchurch, New Zealand ABSTRACT Statistics
The Development of Intensity-Duration Frequency Curve for Ulu Moyog and Kaiduan Station of Sabah
 Transactions on Science and Technology Vol. 4, No. 2, 149-156, 2017 The Development of Intensity-Duration Frequency Curve for Ulu Moyog and Kaiduan Station of Sabah Nicklos Jefrin 1 *, Nurmin Bolong 1,
Appendix E Guidance for Shallow Flooding Analyses and Mapping
 Appendix E Guidance for Shallow Flooding Analyses and Mapping E.1 Introduction Different types of shallow flooding commonly occur throughout the United States. Types of flows that result in shallow flooding
Determination of Urban Runoff Using ILLUDAS and GIS
 Texas A&M University Department of Civil Engineering Instructor: Dr. Francisco Olivera CVEN689 Applications of GIS to Civil Engineering Determination of Urban Runoff Using ILLUDAS and GIS Tae Jin Kim 03.
Areal Reduction Factors for the Colorado Front Range and Analysis of the September 2013 Colorado Storm
 Areal Reduction Factors for the Colorado Front Range and Analysis of the September 2013 Colorado Storm Doug Hultstrand, Bill Kappel, Geoff Muhlestein Applied Weather Associates, LLC - Monument, Colorado
Regional Flash Flood Guidance and Early Warning System
 WMO Training for Trainers Workshop on Integrated approach to flash flood and flood risk management 24-28 October 2010 Kathmandu, Nepal Regional Flash Flood Guidance and Early Warning System Dr. W. E. Grabs
MAPPING THE RAINFALL EVENT FOR STORMWATER QUALITY CONTROL
 Report No. K-TRAN: KU-03-1 FINAL REPORT MAPPING THE RAINFALL EVENT FOR STORMWATER QUALITY CONTROL C. Bryan Young The University of Kansas Lawrence, Kansas JULY 2006 K-TRAN A COOPERATIVE TRANSPORTATION
Haiti and Dominican Republic Flash Flood Initial Planning Meeting
 Dr Rochelle Graham Climate Scientist Haiti and Dominican Republic Flash Flood Initial Planning Meeting September 7 th to 9 th, 2016 Hydrologic Research Center http://www.hrcwater.org Haiti and Dominican
Floods Lecture #21 20
 Floods 20 Lecture #21 What Is a Flood? Def: high discharge event along a river! Due to heavy rain or snow-melt During a flood, a river:! Erodes channel o Deeper & wider! Overflows channel o Deposits sediment
Summary of the 2017 Spring Flood
 Ottawa River Regulation Planning Board Commission de planification de la régularisation de la rivière des Outaouais The main cause of the exceptional 2017 spring flooding can be described easily in just
MODELING STUDIES WITH HEC-HMS AND RUNOFF SCENARIOS IN YUVACIK BASIN, TURKIYE
 MODELING STUDIES WITH HEC-HMS AND RUNOFF SCENARIOS IN YUVACIK BASIN, TURKIYE Yener, M.K. Şorman, A.Ü. Department of Civil Engineering, Middle East Technical University, 06531 Ankara/Türkiye Şorman, A.A.
Extreme Events: What Do the Data Say?
 Extreme Events: What Do the Data Say? Objectives: Students will be able to: compare a typical and extreme weather event using precipitation and streamflow data use descriptive statistics (measures of central
Ellen L. Mecray NOAA Regional Climate Services Director, Eastern Region Taunton, MA
 Ellen L. Mecray NOAA Regional Climate Services Director, Eastern Region Taunton, MA Regions of the US National Climate Assessment What we Observe: Climate changes and impacts Increasing temperature Increasingly
George Mason University Department of Civil, Environmental and Infrastructure Engineering
 George Mason University Department of Civil, Environmental and Infrastructure Engineering Dr. Celso Ferreira Prepared by Lora Baumgartner December 2015 Revised by Brian Ross July 2016 Exercise Topic: Getting
3/3/2013. The hydro cycle water returns from the sea. All "toilet to tap." Introduction to Environmental Geology, 5e
 Introduction to Environmental Geology, 5e Running Water: summary in haiku form Edward A. Keller Chapter 9 Rivers and Flooding Lecture Presentation prepared by X. Mara Chen, Salisbury University The hydro
A Cloud-Based Flood Warning System For Forecasting Impacts to Transportation Infrastructure Systems
 A Cloud-Based Flood Warning System For Forecasting Impacts to Transportation Infrastructure Systems Jon Goodall Associate Professor, Civil and Environmental Engineering Associate Director, Link Lab April
Chapter 7 Mudflow Analysis
 Chapter 7 Mudflow Analysis 7.0 Introduction This chapter provides information on the potential and magnitude of mud floods and mudflows that may develop in Aspen due to rainfall events, snowmelt, or rain
2016 Fall Conditions Report
 2016 Fall Conditions Report Prepared by: Hydrologic Forecast Centre Date: December 13, 2016 Table of Contents TABLE OF FIGURES... ii EXECUTIVE SUMMARY... 1 BACKGROUND... 5 SUMMER AND FALL PRECIPITATION...
Folsom Dam Water Control Manual Update
 Folsom Dam Water Control Manual Update Public Workshop April 3, 2014 Location: Sterling Hotel Ballroom 1300 H Street, Sacramento US Army Corps of Engineers BUILDING STRONG WELCOME & INTRODUCTIONS 2 BUILDING
Natural and Human Influences on Flood Zones in Wake County. Georgia Ditmore
 Natural and Human Influences on Flood Zones in Wake County Georgia Ditmore Prepared for GEOG 591 December 5, 2014 2 Table of Contents Introduction.3 Objectives...5 Methods...6 Conclusion.11 References
The general procedure for estimating 24-hour PMP includes the following steps:
 14th Conference on Applied Climatology Abstract # 71520 Using PRISM Climate Grids and GIS for Extreme Precipitation Mapping George H. Taylor and Christopher Daly Oregon State University Corvallis Oregon
GC Briefing. Weather Sentinel Hurricane Florence. Status at 5 PM EDT (21 UTC) Today (NHC) Discussion. September 13, 2018
 Today (NHC) Discussion. September 13, 2018") GC Briefing September 13, 2018 Weather Sentinel Hurricane Florence Tropical storm conditions have been reported for areas of North Carolina and will continue to spread inland to the west and south. Hurricane
GC Briefing September 13, 2018 Weather Sentinel Hurricane Florence Tropical storm conditions have been reported for areas of North Carolina and will continue to spread inland to the west and south. Hurricane
Winter Weather. National Weather Service Buffalo, NY
 Winter Weather National Weather Service Buffalo, NY Average Seasonal Snowfall SNOWFALL = BIG IMPACTS School / government / business closures Airport shutdowns/delays Traffic accidents with injuries/fatalities
Guide to Hydrologic Information on the Web
 NOAA s National Weather Service Guide to Hydrologic Information on the Web Colorado River at Lees Ferry Photo: courtesy Tim Helble Your gateway to web resources provided through NOAA s Advanced Hydrologic
sea levels 100 year/ payments. FIGURE 1
 MIAMI DADE COUNTY CLIMATE INDICATORS RAINFALL SUMMARY Much of Miami Dade County is susceptible to localized flooding, particularly during the rainy season of June through October. The County s flat terrain
INDIAN INSTITUTE OF SCIENCE STOCHASTIC HYDROLOGY. Lecture -29 Course Instructor : Prof. P. P. MUJUMDAR Department of Civil Engg., IISc.
 INDIAN INSTITUTE OF SCIENCE STOCHASTIC HYDROLOGY Lecture -29 Course Instructor : Prof. P. P. MUJUMDAR Department of Civil Engg., IISc. Summary of the previous lecture Goodness of fit Chi-square test χ
Enhancing Weather Information with Probability Forecasts. An Information Statement of the American Meteorological Society
 Enhancing Weather Information with Probability Forecasts An Information Statement of the American Meteorological Society (Adopted by AMS Council on 12 May 2008) Bull. Amer. Meteor. Soc., 89 Summary This
United States Multi-Hazard Early Warning System
 United States Multi-Hazard Early Warning System Saving Lives Through Partnership Lynn Maximuk National Weather Service Director, Central Region Kansas City, Missouri America s s Weather Enterprise: Protecting
StreamStats: Delivering Streamflow Information to the Public. By Kernell Ries
 StreamStats: Delivering Streamflow Information to the Public By Kernell Ries U.S. Department of the Interior U.S. Geological Survey MD-DE-DC District 410-238-4317 kries@usgs.gov StreamStats Web Application
PENNSYLVANIA DEPARTMENT OF TRANSPORTATION ENGINEERING DISTRICT 3-0
 PENNSYLVANIA DEPARTMENT OF TRANSPORTATION ENGINEERING DISTRICT 3-0 LYCOMING COUNTY S.R.15, SECTION C41 FINAL HYDROLOGIC AND HYDRAULIC REPORT STEAM VALLEY RUN STREAM RELOCATION DATE: June, 2006 REVISED: