NEW YORK STATE WATER RESOURCES INSTITUTE Department of Biological and Environmental Engineering
|
|
|
- Piers Randall
- 6 years ago
- Views:
Transcription


1 NEW YORK STATE WATER RESOURCES INSTITUTE Department of Biological and Environmental Engineering 230 Riley-Robb Hall, Cornell University Tel: (607) Ithaca, NY Fax: (607) Analyzing the discrepancy between return period stream flows using the TR - 55 Method and USGS recorded stream discharges Karin Teuffer, M.Eng Civil and Environmental Engineering, kt428@cornell.edu Small culvert in need of maintenance and inspection Abstract Stream flows calculated with the TR-55 method and obtained from USGS empirical data were compared for twenty stream gauges and their corresponding watersheds in New York State. The overall differences between the distributions of the two methods were measured using the Kolmogorov-Smirnov statistic, and 1, 10, and 100 year return period percent differences in flows. The three variables regressed against were average curve number, latitude and drainage area. Multiple linear regression, and lasso and ridge regression showed that none of the predictor variables had significant influence on the difference between modeled and the measured values. Area and latitude have higher correlations with the raw flows for the three return period storms than curve number when analyzed individually. This was not seen in multiple regression and may be representative of a curve number influence on the discrepancy between model and empirical data.
2 Three Summary Points of Interest The small quantity of watersheds analyzed is an important factor to consider in this analysis. A greater number of locations, even further diversified in terms of latitude and drainage area, could yield more credible results. The limiting obstacle in this case was processing time in ArcMap due to the size of the 10 meter DEM. The results show that neither curve number, nor latitude or drainage area, heavily affects the discrepancy between the TR-55 model and the empirical stream flow values recorded by the USGS. Keywords USGS stream gauges, Multivariate analysis, Hydrograph model comparison Introduction Comparing a model to empirical data is a form of attaining credibility as well as determining the parameters that can reflect the dynamic nature of real world scenarios. When using environmental data, it is often difficult to discern the individual effects of the predictors because they tend to be highly correlated. Thus, statistical methods can help determine which variables have the greatest influence over the model's output and if the inputs match the overall effects of environmental variables seen in nature. Regression analysis is one method for gauging the discrepancy, and is used in this report to analyze which out of three tested variables contribute the most to distribution differences of stream flow data obtained through two methods. The three predictors are curve number, latitude, and drainage area. The dependent variable is either the Kolmigorov-Smirnov statistic, or 1, 10, and 100 year return period flow percent differences. The two datasets being compared are one calculated using the TR-55 and triangular hydrograph method and an empirical one obtained from the USGS recorded instantaneous peak flows. The models compared are relevant to current studies conducted on culverts within New York State. The capacity of culverts compared to the flows they must convey, is an important factor to be studied due to their purpose in mitigating flooding and other disruptions, as well as their function as ecological connections. Culverts that may have the correct capacity at present, might nevertheless be on the verge of failing and thus be vulnerable to the increasing intensity of storms seen to arise from climate change. Work by Marjerison et al. (unpublished) suggests that there are areas in the Lower Hudson River watershed whose culverts are not able to convey peak flows for return period storms of 5, 10 or 100 years. A suitability threshold was placed at a capacity for flows corresponding to a 5-year storm. The results show that 62 percent of the culverts had at least this capacity. This was an overall number, however, and the study delved deeper into what caused differences between suitability percentages by watershed. They found that median income and state road ownership were positively correlated with suitability. Likewise, the New York State Water Resources Institute has been working on developing and enhancing a computer model using Python and ArcMap to determine the capacity of culverts within the state. Field data on culvert dimensions, type, maintenance state, location, ownership and many other characteristics are collected first, and then used to calculate capacity. The model also compares the results to precipitation curves, for 24-hour duration storms for various return periods, to determine the maximum intensity that each culvert can bear. This is where the model evaluation step commences. To ensure that the method for capacity extraction is accurate, the results were compared against StreamStats values for the same return periods. This yielded a sense that the WRI model mostly overestimates the area of the watersheds and likewise the runoff that each culvert receives. The model parameters modified were the percent of storage that is quantified as the initial abstraction. Decreasing it from 0.2 to 0.03 increased the ratio proximity to 1 but still showed a discrepancy. There NYSWRI


3 were doubts as to whether the interpolation of the StreamStats method was influencing results and whether there were other important factors apart from initial abstraction. Hence, the goal of this study was to evaluate the WRI model with empirical data recorded by the USGS at actual stream gauges. The model steps were completed manually, rather than through Python - ArcGIS modeling tools, and were compared to USGS values. Results & Discussion The Pearson correlation coefficients were calculated between all predictor variables, and between all predictor variables and dependent variables. The variance inflation factor (VIF) values were also extracted from regression of all the predictor variables against each other to determine the magnitude of the multicollinearity. Usually a VIF value equal to or greater than 10 is considered a problem for model development because it signifies that the variance of the predictor estimates are increased by an order of magnitude. That is not the case here. Table 1 shows that the VIFs are relatively insignificant and supports the finding that most of the highest multicollinearity effects occur with latitude. Table 2 shows that the curve numbers and both latitude and drainage area are negatively correlated, while latitude and drainage area are positively correlated with each other. Table 3 shows that the sign of the correlation coefficients differs significantly between the Kolmigorov-Smirnov statistic (K-S variable) and the percent difference variables for all return periods. Latitude and area are positively correlated with the percent differences while they are both negatively correlated with K-S values. In addition, latitude is again the greatest in magnitude in all cases. Table 2 Table 3 The coefficient estimates from linear multiple regression further support the correlation values. The signs of the estimates in Table 4 reflect those of Table 3. The fact that the variables were centered and scaled before analysis helps reduce the absolute standard error. The p values for all coefficient estimates are all greater than P values are usually not the best measure of each predictor because multicollinearity affects how much each variable contributes to the total variance of the dependent variable. When two variables are correlated, their contribution is divided and reflected in increased p values. However, in this case the multicollinearity was shown to be low. One thing to note is that as the return period used for percent difference increases, the effect of latitude seems to decrease. The correlation is lower and the p value is higher. These 100-year return period values were also those that were extrapolated the most from fitting the data to the Log Pearson III distribution. Table 1


4 Table 5 Table 4 Table 5 holds the lasso and ridge regression coefficients for the same set of centered and scaled data. These methods are used when multicollinearity increases the variance of the estimators to a point in which interpretation of the results is difficult. With addition of a parameter lambda the magnitude of the covariance matrix values are controlled using penalties on the constraints. When two variables are correlated, the lasso method chooses one and maximizes its coefficient while reducing the other coefficient to zero. Ridge regression splits the contribution of two correlated variables and reduces the magnitude of both coefficients. The K-S case reflects the linear regression coefficients. This is likely due to how the statistic measures a broader discrepancy between both distributions of stream flows. The ridge regression coefficients are very low for the percent difference cases and only slightly reduced, compared to the linear and lasso results, in the K-S case. For lasso regression, the 10 and 100-year percent difference cases suggest that none of the variables significantly contribute to the variance. Only latitude has a role in the one year percent difference case. The plots of the scaled variables are not easily interpretable. Figure 1 thus presents all twenty points, of the predictor and dependent variables and their individual relationships, using unscaled values. The regression lines are shown in some of them - these are the cases in which the intercepts were not too large to be out of range of the axes as shown. Their near zero slope nevertheless represents what most of the plots are showing, no relationship between the predictors and their dependent variables. Figure 1


5 The purpose of this study was to help define or eliminate the predictor variables as contributors to the discrepancy between the TR-55 based WRI model and empirical USGS data. However, to better understand the lack of correlation between the variables and their effect on the model differences it is important to analyse their individual relationships with the raw flows. The correlation between the predictor variables is the same as in previous results. However, Table 6 shows the correlation between the variables and the raw flows for the 1, 10 and 100 year return period storms. The top of the chart represents the values calculated between the variables and the stream flows from the TR-55 method. The bottom portion uses the same variable values but the stream flow variable represents the USGS Log Pearson III fitted values. The results show that the TR-55 method reflects the signs found by using the K-S statistic, and the USGS values reflect the percent difference correlation values discussed above. The main source of inconsistency between the two stream flows would be the curve number which was calculated using the shape file. However, the latitude and area are equivalent. This suggests that the curve number may be the worthwhile variable to explore further. The statistical research in this report will hopefully allow for the continuing improvement of the WRI culvert capacity model. Once it has been proven to be the most accurate it can be, it will be able to serve communities by indicating the culverts capable of facilitating flooding. This knowledge may then be used by local governments and organizations to improve the design of, replace, or transfer management of the culverts to the appropriate party. Methods To have consistent locations for comparison between the two methods, twenty stream flow gauge sites were chosen from the USGS online database. These points were chosen based on a significant amount of recording history, at least thirty years, varying drainage area size, and dispersion over the whole state. Table 7 lists the locations and their main attributes, and Figure 2 displays them on a map of the state. Table 6 Policy/Management Implications The preliminary data collection of the culvert characteristics involved field work throughout nearby communities. The recorded information on culvert dimensions, maintenance and current structural state, potential clogging, and other observations were not only inputted into the WRI model discussed above but also shared with the NAACC. Thus, the data helps in both determining the adequacy of culvert capacity and its role in inhibiting or aiding aquatic connectivity for organisms. Table 7 Figure 2
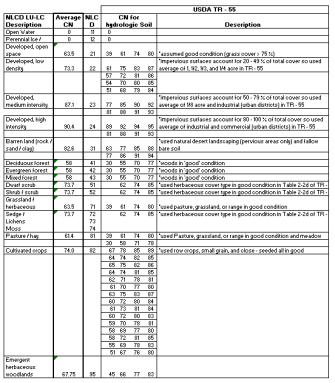
6 Once the locations were finalized, ArcMap Spatial Analyst-Hydrology tools were used to delineate the watershed, find its longest flow path, and calculate the mean slope. A 10 meter DEM from the NYGIS Clearinghouse was used for the base extraction. A land use-land cover layer from the same site was used to calculate the average curve number for the watershed. From the mean slope (degrees) the average velocity was estimated using Figure 3-1 in the TR-55 (1986) documentation. Storage, initial abstraction (assuming it is 0.2*Storage), and time of concentration were subsequently calculated to yield discharge values, Q, for each return period (NOAA Atlas 14 point precipitation). The USGS stream flow values were calculated by return period using frequency analysis. The annual peak flows were ranked, the exceedance probability, P, was calculated using rank / years on record, and the corresponding return period was found using 1/ P. The frequency analysis on the USGS peak flows did not yield precise return period stream flows that could be directly compared to those calculated using the TR-55 method. Therefore, before starting the analysis the USGS data was fit to a Log Pearson III distribution using the method of moments. Regression Analysis The three predictors found from the ArcGIS data and used as independent variables were average curve number, latitude (of the gauge point), and drainage area. There were four dependent variables on which regression was used: a Kolmigorov-Smirnov statistic and percent differences between the flows of 1, 10 and 100 year return periods for both methods. Student Training One Master of Engineering student completed the analysis and write up for this study. Additional final reports related to water resource infrastructure research are available at References Marjerison, R., Meyer, A., DeGaetano, A., and Walter, M. T. (n.d.). Assessing causes of road culvert conveyance suitability in the Lower Hudson Valley. Ithaca, NY. United States Department of Agriculture. (1986). Urban Hydrology for Small Watersheds : TR - 55 (No. Technical Release 55). Appendices The average curve numbers for each watershed were calculated by equating the land use-land cover (2006) shapefile metadata descriptions to those in the USDA TR-55 (1986) documentation. The results are shown in the table below. Note: Only the curve number for the first gauge site (Fall Creek) was found by calibration through SWAT, and not the method described here. Correlation analysis and VIF values were used on all the variables as a preliminary definition of the relationships. Then, linear regression was performed using each dependent variable listed above. Ridge and lasso regressions with the appropriate lambdas (those with the smallest cross validation error) were also preformed. The best regression method was determined by evaluating which yielded the least variance when \textit{predicting} out of sample values (in this case the test data set consisted of half of the actual data collected).
7
Workshop: Build a Basic HEC-HMS Model from Scratch
 Workshop: Build a Basic HEC-HMS Model from Scratch This workshop is designed to help new users of HEC-HMS learn how to apply the software. Not all the capabilities in HEC-HMS are demonstrated in the workshop
Determination of Urban Runoff Using ILLUDAS and GIS
 Texas A&M University Department of Civil Engineering Instructor: Dr. Francisco Olivera CVEN689 Applications of GIS to Civil Engineering Determination of Urban Runoff Using ILLUDAS and GIS Tae Jin Kim 03.
Section 4: Model Development and Application
 Section 4: Model Development and Application The hydrologic model for the Wissahickon Act 167 study was built using GIS layers of land use, hydrologic soil groups, terrain and orthophotography. Within
GIS feature extraction tools in diverse landscapes
 CE 394K.3 GIS in Water Resources GIS feature extraction tools in diverse landscapes Final Project Anna G. Kladzyk M.S. Candidate, Expected 2015 Department of Environmental and Water Resources Engineering
A Cloud-Based Flood Warning System For Forecasting Impacts to Transportation Infrastructure Systems
 A Cloud-Based Flood Warning System For Forecasting Impacts to Transportation Infrastructure Systems Jon Goodall Associate Professor, Civil and Environmental Engineering Associate Director, Link Lab April
ESTIMATING JOINT FLOW PROBABILITIES AT STREAM CONFLUENCES USING COPULAS
 ESTIMATING JOINT FLOW PROBABILITIES AT STREAM CONFLUENCES USING COPULAS Roger T. Kilgore, P.E., D. WRE* Principal Kilgore Consulting and Management 2963 Ash Street Denver, CO 80207 303-333-1408 David B.
Table (6): Annual precipitation amounts as recorded by stations X and Y. No. X Y
: Annual precipitation amounts as recorded by stations X and Y. No. X Y") Example: X and Y are two neighboring rainfall stations. Station X has complete records and station Y has some missing values. Find the linear correlation equation between the two series as mentioned in
Example: X and Y are two neighboring rainfall stations. Station X has complete records and station Y has some missing values. Find the linear correlation equation between the two series as mentioned in
Technical Memorandum No
 Pajaro River Watershed Study in association with Technical Memorandum No. 1.2.10 Task: Evaluation of Four Watershed Conditions - Sediment To: PRWFPA Staff Working Group Prepared by: Gregory Morris and
Near Real-Time Runoff Estimation Using Spatially Distributed Radar Rainfall Data. Jennifer Hadley 22 April 2003
 Near Real-Time Runoff Estimation Using Spatially Distributed Radar Rainfall Data Jennifer Hadley 22 April 2003 Introduction Water availability has become a major issue in Texas in the last several years,
Welcome to NetMap Portal Tutorial
 Welcome to NetMap Portal Tutorial Potential Applications What Can you do with the Portal? At least 25 things! 1) Locate the best potential fish habitats. 2) Identify biological hotspots. 3) Map floodplain
Appendix D. Model Setup, Calibration, and Validation
 . Model Setup, Calibration, and Validation Lower Grand River Watershed TMDL January 1 1. Model Selection and Setup The Loading Simulation Program in C++ (LSPC) was selected to address the modeling needs
ENGINEERING HYDROLOGY
 ENGINEERING HYDROLOGY Prof. Rajesh Bhagat Asst. Professor Civil Engineering Department Yeshwantrao Chavan College Of Engineering Nagpur B. E. (Civil Engg.) M. Tech. (Enviro. Engg.) GCOE, Amravati VNIT,
Updated Precipitation Frequency Estimates for Minnesota
 1 Updated Precipitation Frequency Estimates for Minnesota Presenter: Authors: (alphabetical order) Sanja Perica, Director Hydrometeorological Design Studies Center (HDSC), Office of Hydrology, National
REMOTE SENSING AND GEOSPATIAL APPLICATIONS FOR WATERSHED DELINEATION
 REMOTE SENSING AND GEOSPATIAL APPLICATIONS FOR WATERSHED DELINEATION Gaurav Savant (gaurav@engr.msstate.edu) Research Assistant, Department of Civil Engineering, Lei Wang (lw4@ra.msstate.edu) Research
KINEROS2/AGWA. Fig. 1. Schematic view (Woolhiser et al., 1990).
.") KINEROS2/AGWA Introduction Kineros2 (KINematic runoff and EROSion) (K2) model was originated at the USDA-ARS in late 1960s and released until 1990 (Smith et al., 1995; Woolhiser et al., 1990). The spatial
KINEROS2/AGWA Introduction Kineros2 (KINematic runoff and EROSion) (K2) model was originated at the USDA-ARS in late 1960s and released until 1990 (Smith et al., 1995; Woolhiser et al., 1990). The spatial
Delineation of Watersheds
 Delineation of Watersheds Adirondack Park, New York by Introduction Problem Watershed boundaries are increasingly being used in land and water management, separating the direction of water flow such that
Hydrologic and Hydraulic Analyses Using ArcGIS
 Hydrologic and Hydraulic Analyses Using ArcGIS Two day training class Overview ArcGIS and Arc Hydro provide strong foundation for support of hydrologic and hydraulic (H&H) analyses. This two-day course
StreamStats: Delivering Streamflow Information to the Public. By Kernell Ries
 StreamStats: Delivering Streamflow Information to the Public By Kernell Ries U.S. Department of the Interior U.S. Geological Survey MD-DE-DC District 410-238-4317 kries@usgs.gov StreamStats Web Application
Changes to Extreme Precipitation Events: What the Historical Record Shows and What It Means for Engineers
 Changes to Extreme Precipitation Events: What the Historical Record Shows and What It Means for Engineers Geoffrey M Bonnin National Oceanic and Atmospheric Administration National Weather Service Office
Chapter 6. Fundamentals of GIS-Based Data Analysis for Decision Support. Table 6.1. Spatial Data Transformations by Geospatial Data Types
 Chapter 6 Fundamentals of GIS-Based Data Analysis for Decision Support FROM: Points Lines Polygons Fields Table 6.1. Spatial Data Transformations by Geospatial Data Types TO: Points Lines Polygons Fields
INDIAN INSTITUTE OF SCIENCE STOCHASTIC HYDROLOGY. Lecture -27 Course Instructor : Prof. P. P. MUJUMDAR Department of Civil Engg., IISc.
 INDIAN INSTITUTE OF SCIENCE STOCHASTIC HYDROLOGY Lecture -27 Course Instructor : Prof. P. P. MUJUMDAR Department of Civil Engg., IISc. Summary of the previous lecture Frequency factors Normal distribution
Floodplain modeling. Ovidius University of Constanta (P4) Romania & Technological Educational Institute of Serres, Greece
 Romania & Technological Educational Institute of Serres, Greece") Floodplain modeling Ovidius University of Constanta (P4) Romania & Technological Educational Institute of Serres, Greece Scientific Staff: Dr Carmen Maftei, Professor, Civil Engineering Dept. Dr Konstantinos
Floodplain modeling Ovidius University of Constanta (P4) Romania & Technological Educational Institute of Serres, Greece Scientific Staff: Dr Carmen Maftei, Professor, Civil Engineering Dept. Dr Konstantinos
Flood and runoff estimation on small catchments. Duncan Faulkner
 Flood and runoff estimation on small catchments Duncan Faulkner Flood and runoff estimation on small catchments Duncan Faulkner and Oliver Francis, Rob Lamb (JBA) Thomas Kjeldsen, Lisa Stewart, John Packman
GISHydro2000: A Tool for Automated Hydrologic Analysis in Maryland. G. E. Moglen 1
 GISHydro2000: A Tool for Automated Hydrologic Analysis in Maryland G. E. Moglen 1 1 Department of Civil and Environmental Engineering, University of Maryland, College Park, MD 20742; PH (301) 405-1964;
13 Watershed Delineation & Modeling
 Module 4 (L12 - L18): Watershed Modeling Standard modeling approaches and classifications, system concept for watershed modeling, overall description of different hydrologic processes, modeling of rainfall,
A GIS-based Approach to Watershed Analysis in Texas Author: Allison Guettner
 Texas A&M University Zachry Department of Civil Engineering CVEN 658 Civil Engineering Applications of GIS Instructor: Dr. Francisco Olivera A GIS-based Approach to Watershed Analysis in Texas Author:
Extreme Rain all Frequency Analysis for Louisiana
 78 TRANSPORTATION RESEARCH RECORD 1420 Extreme Rain all Frequency Analysis for Louisiana BABAK NAGHAVI AND FANG XIN Yu A comparative study of five popular frequency distributions and three parameter estimation
Designing a Dam for Blockhouse Ranch. Haley Born
 Designing a Dam for Blockhouse Ranch Haley Born CE 394K GIS in Water Resources Term Paper Fall 2011 Table of Contents Introduction... 1 Data Sources... 2 Precipitation Data... 2 Elevation Data... 3 Geographic
INDIAN INSTITUTE OF SCIENCE STOCHASTIC HYDROLOGY. Lecture -29 Course Instructor : Prof. P. P. MUJUMDAR Department of Civil Engg., IISc.
 INDIAN INSTITUTE OF SCIENCE STOCHASTIC HYDROLOGY Lecture -29 Course Instructor : Prof. P. P. MUJUMDAR Department of Civil Engg., IISc. Summary of the previous lecture Goodness of fit Chi-square test χ
Development and Land Use Change in the Central Potomac River Watershed. Rebecca Posa. GIS for Water Resources, Fall 2014 University of Texas
 Development and Land Use Change in the Central Potomac River Watershed Rebecca Posa GIS for Water Resources, Fall 2014 University of Texas December 5, 2014 Table of Contents I. Introduction and Motivation..4
Storm rainfall. Lecture content. 1 Analysis of storm rainfall 2 Predictive model of storm rainfall for a given
 Storm rainfall Lecture content 1 Analysis of storm rainfall 2 Predictive model of storm rainfall for a given max rainfall depth 1 rainfall duration and return period à Depth-Duration-Frequency curves 2
Building a European-wide hydrological model
 Building a European-wide hydrological model 2010 International SWAT Conference, Seoul - South Korea Christine Kuendig Eawag: Swiss Federal Institute of Aquatic Science and Technology Contribution to GENESIS
Hydrology and Watershed Analysis
 Hydrology and Watershed Analysis Manual By: Elyse Maurer Reference Map Figure 1. This map provides context to the area of Washington State that is being focused on. The red outline indicates the boundary
GRAPEVINE LAKE MODELING & WATERSHED CHARACTERISTICS
 GRAPEVINE LAKE MODELING & WATERSHED CHARACTERISTICS Photo Credit: Lake Grapevine Boat Ramps Nash Mock GIS in Water Resources Fall 2016 Table of Contents Figures and Tables... 2 Introduction... 3 Objectives...
5/4/2017 Fountain Creek. Gage Analysis. Homework 6. Clifton, Cundiff, Pour, Queen, and Zey CIVE 717
 5/4/2017 Fountain Creek Gage Analysis Homework 6 Clifton, Cundiff, Pour, Queen, and Zey CIVE 717 Introduction: The CIVE 717 class members, Nate Clifton, Susan Cundiff, Ali Reza Nowrooz Pour, Robbie Queen
Model Calibration and Forecast Error for NFIE-Hydro
 Corey Van Dyk C E 397 Flood Forecasting 5/8/15 Model Calibration and Forecast Error for NFIE-Hydro Introduction The forecasting component of the National Flood Interoperability Experiment (NFIE), like
Assessment of solid load and siltation potential of dams reservoirs in the High Atlas of Marrakech (Moorcco) using SWAT Model
 using SWAT Model") Assessment of solid load and siltation potential of dams reservoirs in the High Atlas of Marrakech (Moorcco) using SWAT Model Amal Markhi: Phd Student Supervisor: Pr :N.Laftrouhi Contextualization Facing
Assessment of solid load and siltation potential of dams reservoirs in the High Atlas of Marrakech (Moorcco) using SWAT Model Amal Markhi: Phd Student Supervisor: Pr :N.Laftrouhi Contextualization Facing
Dr. S.SURIYA. Assistant professor. Department of Civil Engineering. B. S. Abdur Rahman University. Chennai
 Hydrograph simulation for a rural watershed using SCS curve number and Geographic Information System Dr. S.SURIYA Assistant professor Department of Civil Engineering B. S. Abdur Rahman University Chennai
Analysing River Discharge Data for Flood Analysis
 Analysing River Discharge Data for Flood Analysis This suggested response provides answers to the eleven questions posed on the web-site. Your report should have covered all of this material. (A) Produce
Title: ArcMap: Calculating Soil Areas for Storm Water Pollution Prevention Plans Authors: Brandy Woodcock, Benjamin Byars
 Title: ArcMap: Calculating Soil Areas for Storm Water Pollution Prevention Plans Authors: Brandy Woodcock, Benjamin Byars Introduction Abstract: The use of ArcMap to calculate soil areas for storm water
Lecture 6: Precipitation Averages and Interception
 Lecture 6: Precipitation Averages and Interception Key Questions 1. How much and when does Whatcom County receive rain? 2. Where online can you find rainfall data for the state? 3. How is rainfall averaged
Results of Intensity-Duration- Frequency Analysis for Precipitation and Runoff under Changing Climate
 Results of Intensity-Duration- Frequency Analysis for Precipitation and Runoff under Changing Climate Supporting Casco Bay Region Climate Change Adaptation RRAP Eugene Yan, Alissa Jared, Julia Pierce,
Objectives: After completing this assignment, you should be able to:
 Data Analysis Assignment #1 Evaluating the effects of watershed land use on storm runoff Assignment due: 21 February 2013, 5 pm Objectives: After completing this assignment, you should be able to: 1) Calculate
Bushkill Creek 3 rd Street Dam Removal Analysis
 Bushkill Creek 3 rd Street Dam Removal Analysis HEC HMS Runoff and Routing Model Stephen Beavan, Melanie DeFazio, David Gold, Peter Mara and Dan Moran CE 421: Hydrology Fall 2010 December 15, 2010 Contents
George Mason University Department of Civil, Environmental and Infrastructure Engineering. Dr. Celso Ferreira Prepared by Lora Baumgartner
 George Mason University Department of Civil, Environmental and Infrastructure Engineering Dr. Celso Ferreira Prepared by Lora Baumgartner Exercise Topic: Downloading Spatial Data Objectives: a) Become
Watershed Analysis of the Blue Ridge Mountains in Northwestern Virginia
 Watershed Analysis of the Blue Ridge Mountains in Northwestern Virginia Mason Fredericks December 6, 2018 Purpose The Blue Ridge Mountain range is one of the most popular mountain ranges in the United
Development of GIS Tools to Optimize Identification of Road Segments Prone to Flood Damage
 A Report from the University of Vermont Transportation Research Center Development of GIS Tools to Optimize Identification of Road Segments Prone to Flood Damage Final Report TRC Report 15-005 September
Building a Spatial Framework for the Analysis of Benthic Fauna Along the River Network of Switzerland
 Building a Spatial Framework for the Analysis of Benthic Fauna Along the River Network of Switzerland Lehmann 1 A., S., Stucki 2 P. and Gonseth 3 Y. 1 University of Geneva, 2 private consultancy, 3 CSCF
Workshops funded by the Minnesota Environment and Natural Resources Trust Fund
 Workshops funded by the Minnesota Environment and Natural Resources Trust Fund Conservation Applications of LiDAR Data Workshops funded by: Minnesota Environment and Natural Resources Trust Fund Presented
STREUVER FIDELCO CAPPELLI, LLC YONKERS DOWNTOWN DEVELOPMENT PHASE 1. DRAFT ENVIRONMENTAL IMPACT STATEMENT For: PALISADES POINT
 STREUVER FIDELCO CAPPELLI, LLC YONKERS DOWNTOWN DEVELOPMENT PHASE 1 DRAFT ENVIRONMENTAL IMPACT STATEMENT For: PALISADES POINT Prepared by: PAULUS, SOKOLOWSKI & SARTOR STORMWATER MANAGEMENT 1. Methodology
Sea Level Rise and Hurricane Florence storm surge research methodology
 Sea Level Rise and Hurricane Florence storm surge research methodology Hurricane Florence storm surge analysis was conducted using a variety of input sources. In order to determine the maximum storm surge
Introduction Fluvial Processes in Small Southeastern Watersheds
 Introduction Fluvial Processes in Small Southeastern Watersheds L. Allan James Scott A. Lecce Lisa Davis Southeastern Geographer, Volume 50, Number 4, Winter 2010, pp. 393-396 (Article) Published by The
Flood hydrology of the Mangaroa River MARCH 2005
 Flood hydrology of the Mangaroa River MARCH 2005 MARCH 2005 Flood hydrology of the Mangaroa River Laura Watts Contents Summary 1 1. Introduction 2 2. Catchment description 3 3. Data availability and quality
ISSN Vol.03,Issue.10 May-2014, Pages:
 www.semargroup.org, www.ijsetr.com ISSN 2319-8885 Vol.03,Issue.10 May-2014, Pages:2187-2191 YIN YIN HTWE 1, AYE AYE THANT 2 1 Dept of Civil Engineering, Mandalay Technological University, Mandalay, Myanmar,
Geo-spatial Analysis for Prediction of River Floods
 Geo-spatial Analysis for Prediction of River Floods Abstract. Due to the serious climate change, severe weather conditions constantly change the environment s phenomena. Floods turned out to be one of
Liliana Pagliero June, 15 th 2011
 Liliana Pagliero liliana.pagliero@jrc.ec.europa.eu June, 15 th 2011 2/18 SWAT MODELLING AT PAN EUROPEAN SCALE: THE DANUBE BASIN PILOT STUDY Introduction The Danube Model Available databases Model set up
Introducing Iowa StreamStats Version 4, a Redesign of the USGS Application for Estimating Streamflow Stats
 Introducing Iowa StreamStats Version 4, a Redesign of the USGS Application for Estimating Streamflow Stats Presented at the 2016 Iowa Water Conference Ames, IA March 24, 2016 by David Eash U.S. Geological
Renewal and Update of MTO IDF Curves: Defining the Uncertainty
 Renewal and Update of MTO IDF Curves: Defining the Uncertainty Eric D. Soulis, Daniel Princz and John Wong University of Waterloo, Waterloo, Ontario. Received 204 05 4, accepted 205 0 29, published 205
TABLE OF CONTENTS. 3.1 Synoptic Patterns Precipitation and Topography Precipitation Regionalization... 11
 TABLE OF CONTENTS ABSTRACT... iii 1 INTRODUCTION... 1 2 DATA SOURCES AND METHODS... 2 2.1 Data Sources... 2 2.2 Frequency Analysis... 2 2.2.1 Precipitation... 2 2.2.2 Streamflow... 2 2.3 Calculation of
Boston Coastal Flooding Analysis and Mapping
 Boston Coastal Flooding Analysis and Mapping Philip Orton, Dara Mendeloff, Jane Mills, Malgosia Madajewicz Funding This research was funded by the National Oceanic and Atmospheric Administration (NOAA)
PRELIMINARY DRAFT FOR DISCUSSION PURPOSES
 Memorandum To: David Thompson From: John Haapala CC: Dan McDonald Bob Montgomery Date: February 24, 2003 File #: 1003551 Re: Lake Wenatchee Historic Water Levels, Operation Model, and Flood Operation This
Using Remote Sensing to Analyze River Geomorphology
 Using Remote Sensing to Analyze River Geomorphology Seeing Water from Space Workshop August 11 th, 2015 George Allen geoallen@unc.edu Rivers impact: Geology Ecology Humans The atmosphere River Geomorphology
A Comparison of Rainfall Estimation Techniques
 A Comparison of Rainfall Estimation Techniques Barry F. W. Croke 1,2, Juliet K. Gilmour 2 and Lachlan T. H. Newham 2 SUMMARY: This study compares two techniques that have been developed for rainfall and
Transactions on Information and Communications Technologies vol 18, 1998 WIT Press, ISSN
 STREAM, spatial tools for river basins, environment and analysis of management options Menno Schepel Resource Analysis, Zuiderstraat 110, 2611 SJDelft, the Netherlands; e-mail: menno.schepel@resource.nl
Texas A&M University. Zachary Department of Civil Engineering. Instructor: Dr. Francisco Olivera. CVEN 658 Civil Engineering Applications of GIS
 1 Texas A&M University Zachary Department of Civil Engineering Instructor: Dr. Francisco Olivera CVEN 658 Civil Engineering Applications of GIS The Use of ArcGIS Geostatistical Analyst Exploratory Spatial
Bivariate Rainfall and Runoff Analysis Using Entropy and Copula Theories
 Entropy 2012, 14, 1784-1812; doi:10.3390/e14091784 Article OPEN ACCESS entropy ISSN 1099-4300 www.mdpi.com/journal/entropy Bivariate Rainfall and Runoff Analysis Using Entropy and Copula Theories Lan Zhang
FLOOD RISK MAPPING AND ANALYSIS OF THE M ZAB VALLEY, ALGERIA
 River Basin Management IX 69 FLOOD RISK MAPPING AND ANALYSIS OF THE M ZAB VALLEY, ALGERIA AMEL OUCHERIF & SAADIA BENMAMAR National Polytechnic School of Algiers, Algeria ABSTRACT To contribute to flood
BSEN 6220 GIS LAB #5
 BSEN 6220 GIS LAB #5 Dustin Till 10/29/2014 INTRODUCTION: ArcGIS is a geographic information system for working with maps and geographic information. It is used for creating and using maps, compiling geographic
National Hydrography Dataset (NHD) Update Project for US Forest Service Region 3
 Update Project for US Forest Service Region 3") National Hydrography Dataset (NHD) Update Project for US Forest Service Region 3 Allison Moncada California State University, Northridge February 2017 July 2017 Advisor: Joel Osuna Center for Geographical
National Hydrography Dataset (NHD) Update Project for US Forest Service Region 3 Allison Moncada California State University, Northridge February 2017 July 2017 Advisor: Joel Osuna Center for Geographical
WINFAP 4 QMED Linking equation
 WINFAP 4 QMED Linking equation WINFAP 4 QMED Linking equation Wallingford HydroSolutions Ltd 2016. All rights reserved. This report has been produced in accordance with the WHS Quality & Environmental
Base Level Engineering FEMA Region 6
 Base Level Engineering Over the past five years, has been evaluating its investment approach and data preparation work flow to establish an efficient and effective change in operation, generating an approach
MODULE 8 LECTURE NOTES 2 REMOTE SENSING APPLICATIONS IN RAINFALL-RUNOFF MODELLING
 MODULE 8 LECTURE NOTES 2 REMOTE SENSING APPLICATIONS IN RAINFALL-RUNOFF MODELLING 1. Introduction The most common application of the remote sensing techniques in the rainfall-runoff studies is the estimation
Current and Future Plans. R. Srinivasan
 Current and Future Plans R. Srinivasan Contents 1 The ArcSWAT Interface 2 VizSWAT: Output Visualization 3 User online support 4 MapWindows SWAT interface 5 ArcGIS SWAT/APEX interfaces 6 Radar Rainfall
CSO Post-Construction Monitoring and Performance Assessment
 Massachusetts Water Resources Authority CSO Post-Construction Monitoring and Performance Assessment Jeremy R. Hall, Project Manager Operations/Engineering & Construction Wastewater Advisory Committee December
4. GIS Implementation of the TxDOT Hydrology Extensions
 4. GIS Implementation of the TxDOT Hydrology Extensions A Geographic Information System (GIS) is a computer-assisted system for the capture, storage, retrieval, analysis and display of spatial data. It
In cooperation with the South Carolina, Georgia, and North Carolina Departments of Transportation and the North Carolina Floodplain Mapping Program
 In cooperation with the South Carolina, Georgia, and North Carolina Departments of Transportation and the North Carolina Floodplain Mapping Program (Division of Emergency Management) Magnitude and Frequency
Watershed Analysis Using Remote Sensing and GPS
 25 th Annual Louisiana Remote Sensing and GIS Workshop Baton Rouge, 2009 Watershed Analysis Using Remote Sensing and GPS Warren L. Kron, Jr. Quang Tran Baton Rouge City-Parish Planning Commission José
Engineering Hydrology
 Engineering Hydrology Prof. Rajesh Bhagat Asst. Professor Civil Engineering Department Yeshwantrao Chavan College Of Engineering Nagpur B. E. (Civil Engg.) M. Tech. (Enviro. Engg.) GCOE, Amravati VNIT,
Chapter 6 Mapping and Online Tools
 Chapter 6 Mapping and Online Tools The stream site you monitor is just part of a much larger system. When analyzing stream health, it is important to take a holistic view by considering the entire watershed.
THE DEVELOPMENT OF RAIN-BASED URBAN FLOOD FORECASTING METHOD FOR RIVER MANAGEMENT PRACTICE USING X-MP RADAR OBSERVATION
 Research Paper Advances in River Engineering, JSCE, Vol.19, 2013,June THE DEVELOPMENT OF RAIN-BASED URBAN FLOOD FORECASTING METHOD FOR RIVER MANAGEMENT PRACTICE USING X-MP RADAR OBSERVATION Seongsim YOON
Appendix O. Sediment Transport Modelling Technical Memorandum
 Appendix O Sediment Transport Modelling Technical Memorandum w w w. b a i r d. c o m Baird o c e a n s engineering l a k e s design r i v e r s science w a t e r s h e d s construction Final Report Don
Chapter 10 - Sacramento Method Examples
 Chapter 10 Sacramento Method Examples Introduction Overview This chapter presents two example problems to demonstrate the use of the Sacramento method. These example problems use the SACPRE and HEC-1 computer
Modeling the Effects of Climate and Land Cover Change in the Stoney Brook Subbasin of the St. Louis River Watershed
 Modeling the Effects of Climate and Land Cover Change in the Stoney Brook Subbasin of the St. Louis River Watershed Joe Johnson and Jesse Pruette 214 NASA Research Internship Geospatial Technologies Program
Leon Creek Watershed October 17-18, 1998 Rainfall Analysis Examination of USGS Gauge Helotes Creek at Helotes, Texas
 Leon Creek Watershed October 17-18, 1998 Rainfall Analysis Examination of USGS Gauge 8181400 Helotes Creek at Helotes, Texas Terrance Jackson MSCE Candidate University of Texas San Antonio Abstract The
Application of SWAT Model to Estimate the Runoff and Sediment Load from the Right Bank Valleys of Mosul Dam Reservoir
 Application of SWAT Model to Estimate the Runoff and Sediment Load from the Right Bank Valleys of Mosul Dam Reservoir Dr Mohammad Ezeel Deen Prof. Nadhir Al-Ansari Prof Sven Knutsson Figure 1.Map of Iraq
Catalonia is a small region, managed by an autonomous government (depending from Spain), and placed in NE. Spain, next to Mediterranean sea.
, and placed in NE. Spain, next to Mediterranean sea.") Characterization of the river basin according to the WFD The Catalan Basins, a case of small Mediterranean water district Planning Department c/ Provença, 204-208 08036-Barcelona Introduction to Catalonia
Characterization of the river basin according to the WFD The Catalan Basins, a case of small Mediterranean water district Planning Department c/ Provença, 204-208 08036-Barcelona Introduction to Catalonia
used to transport sediments throughout the lands. In this regard, understanding erosion is
 David Rounce GIS in Water Resources 11/23/2010 Erosion Potential in Travis County INTRODUCTION Erosion has played a vital role in the morphology of the Earth as its processes have been used to transport
Distinct landscape features with important biologic, hydrologic, geomorphic, and biogeochemical functions.
 1 Distinct landscape features with important biologic, hydrologic, geomorphic, and biogeochemical functions. Have distinguishing characteristics that include low slopes, well drained soils, intermittent
An Adaptive Assessment of the Flushing Flow Needs of the Lower Poudre River, Colorado: First Evaluation
 Hydrology Days 29 An Adaptive Assessment of the Flushing Flow Needs of the Lower Poudre River, Colorado: First Evaluation 1 Robert T Milhous Hydrologist. Fort Collins, Colorado 8526 Abstract. Adaptive
Watershed concepts for community environmental planning
 Purpose and Objectives Watershed concepts for community environmental planning Dale Bruns, Wilkes University USDA Rural GIS Consortium May 2007 Provide background on basic concepts in watershed, stream,
Existing NWS Flash Flood Guidance
 Introduction The Flash Flood Potential Index (FFPI) incorporates physiographic characteristics of an individual drainage basin to determine its hydrologic response. In flash flood situations, the hydrologic
IJESRT INTERNATIONAL JOURNAL OF ENGINEERING SCIENCES & RESEARCH TECHNOLOGY
 IJESRT INTERNATIONAL JOURNAL OF ENGINEERING SCIENCES & RESEARCH TECHNOLOGY Use of Digital Elevation Model to compute Storm Water Drainage Network Manisha Desai *1, Dr. J. N. Patel 2 *1 Ph. D. Student of
The 2 nd Annual Gobeshona Conference Future Changes of Flash Flood in the North East Region of Bangladesh using HEC-HMS Modeling
 The 2 nd Annual Gobeshona Conference 2016 Future Changes of Flash Flood in the North East Region of Bangladesh using HEC-HMS ing By- Shammi Haque 1*, Mutasim Billah 1, Afiya Narzis 2, A.K.M. Saiful Islam
Evaluation of gvsig and SEXTANTE Tools for Hydrological Analysis Schröder Dietrich a, Mudogah Hildah b and Franz David b
 Evaluation of gvsig and SEXTANTE Tools for Hydrological Analysis Schröder Dietrich a, Mudogah Hildah b and Franz David b ab Photogrammetry and Geo-informatics Masters Programme, Stuttgart University of
Hydrologic Modelling of the Upper Malaprabha Catchment using ArcView SWAT
 Hydrologic Modelling of the Upper Malaprabha Catchment using ArcView SWAT Technical briefs are short summaries of the models used in the project aimed at nontechnical readers. The aim of the PES India
Creating Watersheds from a DEM
 Creating Watersheds from a DEM These instructions enable you to create watersheds of specified area using a good quality Digital Elevation Model (DEM) in ArcGIS 8.1. The modeling is performed in ArcMap
Flash Flood Guidance System On-going Enhancements
 Flash Flood Guidance System On-going Enhancements Hydrologic Research Center, USA Technical Developer SAOFFG Steering Committee Meeting 1 10-12 July 2017 Jakarta, INDONESIA Theresa M. Modrick Hansen, PhD
Stochastic Hydrology. a) Data Mining for Evolution of Association Rules for Droughts and Floods in India using Climate Inputs
 Data Mining for Evolution of Association Rules for Droughts and Floods in India using Climate Inputs") Stochastic Hydrology a) Data Mining for Evolution of Association Rules for Droughts and Floods in India using Climate Inputs An accurate prediction of extreme rainfall events can significantly aid in policy
Stochastic Hydrology a) Data Mining for Evolution of Association Rules for Droughts and Floods in India using Climate Inputs An accurate prediction of extreme rainfall events can significantly aid in policy
A Near Real-time Flood Prediction using Hourly NEXRAD Rainfall for the State of Texas Bakkiyalakshmi Palanisamy
 A Near Real-time Flood Prediction using Hourly NEXRAD for the State of Texas Bakkiyalakshmi Palanisamy Introduction Radar derived precipitation data is becoming the driving force for hydrological modeling.
Technical Memorandum. City of Salem, Stormwater Management Design Standards. Project No:
 Technical Memorandum 6500 SW Macadam Avenue, Suite 200 Portland, Oregon, 97239 Tel: 503-244-7005 Fax: 503-244-9095 Prepared for: Project Title: City of Salem, Oregon City of Salem, Stormwater Management