Rainfall and Design Storms
|
|
|
- Darlene Britney Shepherd
- 5 years ago
- Views:
Transcription

1 Methods in Stormwater Management Using HydroCAD Rainfall and Design Storms H03 Rainfall and Design Storms.pdf 1
2 Topics Covered 1. Rainfall characteristics 2. Rainfall sources 3. Design Storms 4. Example: Design Storm for Echo Valley WS 2
3 Outcomes 1. Be able to select a design rainfall based upon storm duration and frequency 2. Be able to select an appropriate rainfall data source 3. Be able to create a design storm for a specific location, return period and duration using HydroCAD. 3
4 1. Rainfall Characteristics A. Volume B. Intensity C. Duration D. Frequency E. Spatial/Geographic 4
5 A. Volume Total amount of rainfall falling during an event Expressed as inches Really a volume: rainfall depth x watershed area More correctly expressed as acre-inches B. Intensity Rate of rainfall falling during an event Expressed as inches/hour (depth/time) Really a flow: intensity (ft/s) x watershed area (ft 2 ) More correctly expressed as ft 3 /s 5
6 C. Duration Total time period of rainfall event Expressed as minutes or hours (typically) Defines the critical storm for watershed response 6
7 Volume, Intensity and Duration Largest intensity: 0.57 inches/hour Rainfall (in/hr) Total storm volume: Sum all intensities times the time step gives 5.41 inches Time (hours) Storm duration: 24 one-hour time steps equals 24 hrs 7
8 C. Frequency How often does this rainfall depth/intensity occur? Return period (years) Based upon probability of occurrence (statistics) Requires long-term rainfall records D. Spatial/Geographic Variation Rainfall intensity and volume varies with location Local variation: Watersheds > 1 mi 2 Regional/state: PA, MD, VA, etc. IDF curves National variation: NRCS Type I, IA, II, III National variation: NOAA Type A, B, C, D 8
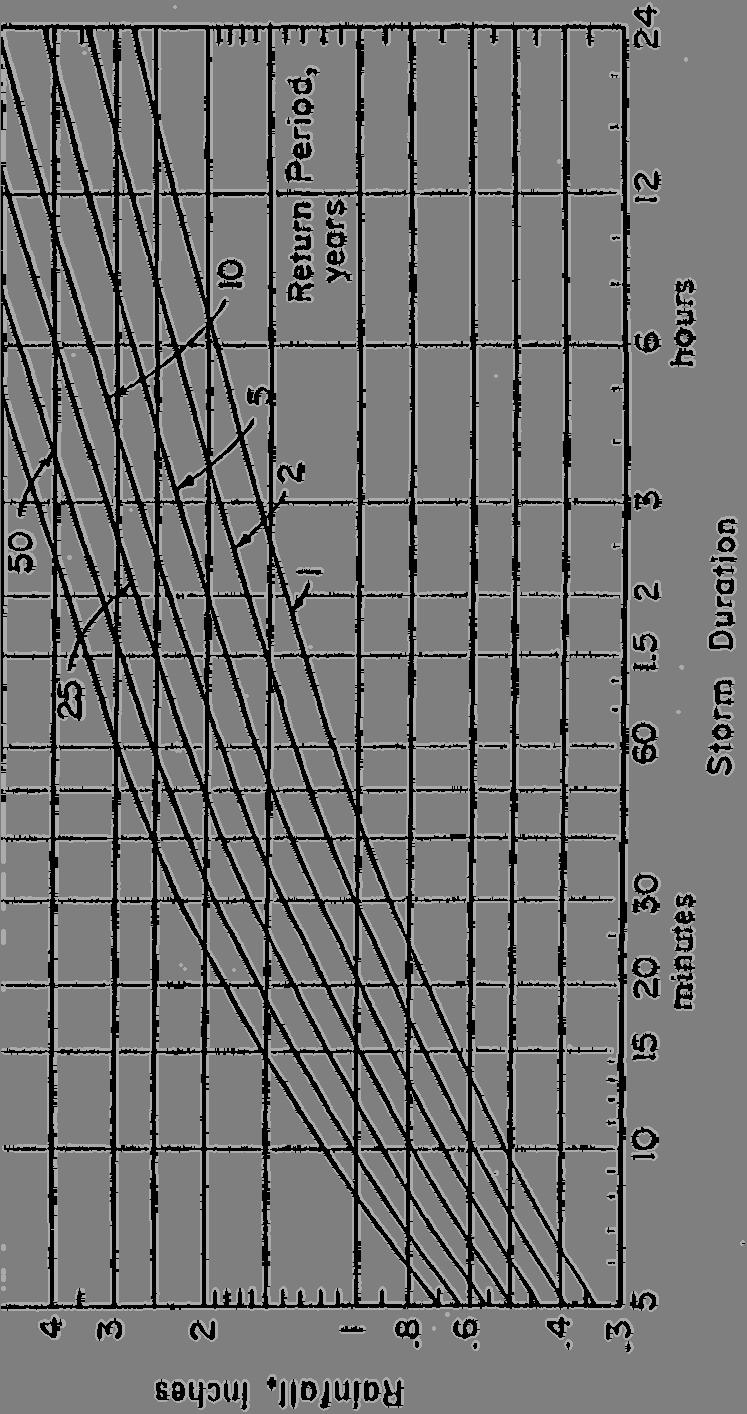
9 Volume Duration Frequency Chart 9
10 Intensity Duration Frequency Chart 10

11 National variation: NRCS Type I, IA, II, III 11
12 National variation: NRCS Type I, IA, II and III 12


13 National variation: NOAA Type A, B, C and D 13
14 2. Rainfall Data Sources A. TP-40 (TR-55, 1986) B. NOAA Atlas 14 C. PennDOT Pub
")
15 A. TP-40 (TR-55, 1986, Appendix B) 15

16 B. NOAA ATLAS

17 ATLAS 14 Data 17

18 ATLAS 14 Data State College, PA
19 C. PennDOT Pub. 584 Pennsylvania Variation of Atlas 14 Step 1: Select appropriate Region Map from Table 7A.1 19
20 Step 2: From regions map, select appropriate region (1-5) 20
21 Step 3: From regions rainfall curves, read rainfall intensities using return period and storm duration OR.. 21
22 Step 3: From region rainfall tables, read rainfall depths using return period and storm duration 22
23 Example 1: Estimate 1-yr, 10-yr and 100-yr 24-hr rainfall depths for State College, PA Use Map F for all three return periods 23
24 Example 1: Estimate 1-yr, 10-yr and 100-yr rainfall depths for State College, PA Use Region 2 Rainfall Data 24

25 Region 2 VDF (volume) Table
26 Example 1: Estimate 1-yr, 10-yr and 100-yr rainfall depths for State College, PA Summary Results Storm duration: 24 hours Return Period... TP Pub Atlas 14 1-yr yr yr
27 3. Design Storms A. Definitions B. Design Storm Graphics C. Design Storm Characteristics D. Limitations of Design Storms E. Constructing a Design Storm 27
28 3. Design Storms A. Definitions Design Rainfall: total rainfall depth over some duration Design Storm: hyetograph, or time distribution, of the design rainfall over a specific duration 28
29 B. Design Storm Graphic Simple alternating-block design storm Rainfall Intensity (in/hr) Area = Design Rainfall Total Time (hours) 29
30 Duration (minutes) Duration (minutes) 30 Rainfall Intensity (in/hr) Runoff Rate (ft 3 /s)
31 C. Design Storm Characteristics Design storms are used in absence of actual rainfall records in the design area A design storm is synthesized from pieces of extreme rainfall taken from many actual storm events in region Sequencing and distribution is arranged somewhat arbitrarily to form a design storm, aka hyetograph 31
32 D. Limitations of Design Storms Runoff peaks are assumed to have same return period as the design storm. Doesn t happen that way! Runoff peaks from design storms may not agree with those from observed rainfalls having the same approximate return period The use of a design storm implies a single-event analysis; it does not account for changes in soil moisture during the inter-event times 32
33 E. Constructing a Design Storm Example: Develop an 80 minute, 10-year design storm for Region 5. Use the following PA Region 5 chart (1986). Steps: 1. From the depth vs. duration chart, obtain 10-year rainfall amounts for durations of 10, 20, 30,, 80 minutes (put in column 2) 2. Compute the incremental rainfall amounts between consecutive durations (put in column 3) 3. Rearrange the rainfall increments from column 3 in a quasisymmetrical pattern (put in column 4) 4. Compute the rain intensities during the time increments, dividing column 4 by the 10 minute time step and multiplying by 60 minutes (put in column 5) 33

34 Region 5 Depth-Duration Chart 34


35 - 10 x 60 From Depth- Duration Chart 35


36 Finished Design Storm Hyetograph 36


37 4. Example: Design Storm for Echo Valley WS 37

38 Atlas 14 Data for Echo Valley WS

39 Design Storms in HydroCAD for Echo Valley 1. Calculation Settings 2. Rainfall tab 3. Storm Type: Type II 24 hr 4. Storm Duration: 24 hr 5. Back-to-Back Storms: 1 6. Depth: AMC: 2 8. Rainfall Event Name: 25-yr 9. Click Apply and OK to save 39
40 Summary Topics 1. Rainfall characteristics 2. Rainfall sources 3. Design Storms 4. Example: Design Storm for Echo Valley WS Outcomes 1. Be able to select a design rainfall based upon storm duration and frequency 2. Be able to select an appropriate rainfall data source 3. Be able to create a design storm for a specific location, return period and duration using HydroCAD. 40
Jones Creek Case Study
 Jones Creek Case Study Introduction In this case study we will examine the fictitious watershed of Jones Creek. This watershed has one confluence and can therefore be divided into three subbasins. The
Design Storms for Hydrologic Analysis
 Design Storms for Hydrologic Analysis Course Description This course is designed to fulfill two hours of continuing education credit for Professional Engineers. Its objective is to provide students with
Precipitation Rabi H. Mohtar
 Precipitation Rabi H. Mohtar The objectives of this module are to present and analyze: 1) Precipitation forms, characteristics, and measurements 2) Intensity, Duration, Frequency (IDF) curves and rainfall
Rainfall Analysis. Prof. M.M.M. Najim
 Rainfall Analysis Prof. M.M.M. Najim Learning Outcome At the end of this section students will be able to Estimate long term mean rainfall for a new station Describe the usage of a hyetograph Define recurrence
INFLOW DESIGN FLOOD CONTROL SYSTEM PLAN 40 C.F.R. PART PLANT YATES ASH POND 2 (AP-2) GEORGIA POWER COMPANY
 GEORGIA POWER COMPANY") INFLOW DESIGN FLOOD CONTROL SYSTEM PLAN 40 C.F.R. PART 257.82 PLANT YATES ASH POND 2 (AP-2) GEORGIA POWER COMPANY EPA s Disposal of Coal Combustion Residuals from Electric Utilities Final Rule (40 C.F.R.
INFLOW DESIGN FLOOD CONTROL SYSTEM PLAN 40 C.F.R. PART 257.82 PLANT YATES ASH POND 2 (AP-2) GEORGIA POWER COMPANY EPA s Disposal of Coal Combustion Residuals from Electric Utilities Final Rule (40 C.F.R.
TXHYETO.XLS: A Tool To Facilitate Use of Texas- Specific Hyetographs for Design Storm Modeling. Caroline M. Neale Texas Tech University
 TXHYETO.XLS: A Tool To Facilitate Use of Texas- Specific Hyetographs for Design Storm Modeling Caroline M. Neale Texas Tech University Acknowledgements Funding and direction provided by the Texas Department
HEC-HMS Lab 4 Using Frequency Storms in HEC-HMS
 HEC-HMS Lab 4 Using Frequency Storms in HEC-HMS Created by Venkatesh Merwade (vmerwade@purdue.edu) Learning outcomes The objective of this lab is to learn how HEC-HMS is used to determine design flow by
New NOAA Precipitation-Frequency Atlas for Wisconsin
 New NOAA Precipitation-Frequency Atlas for Wisconsin #215966 Presentation to the Milwaukee Metropolitan Sewerage District Technical Advisory Team January 16, 2014 Michael G. Hahn, P.E., P.H. SEWRPC Chief
Section 4: Model Development and Application
 Section 4: Model Development and Application The hydrologic model for the Wissahickon Act 167 study was built using GIS layers of land use, hydrologic soil groups, terrain and orthophotography. Within
George Mason University Department of Civil, Environmental and Infrastructure Engineering
 George Mason University Department of Civil, Environmental and Infrastructure Engineering Dr. Celso Ferreira Prepared by Lora Baumgartner December 2015 Revised by Brian Ross July 2016 Exercise Topic: Getting
2012 Rainfall, Runoff, Water Level & Temperature Beebe Lake Wright County, MN (# )
") www.fixmylake.com 18029 83 rd Avenue North Maple Grove, MN 55311 mail@freshwatersci.com (651) 336-8696 2012 Rainfall, Runoff, Water Level & Temperature Beebe Lake Wright County, MN (#86-0023) Prepared
www.fixmylake.com 18029 83 rd Avenue North Maple Grove, MN 55311 mail@freshwatersci.com (651) 336-8696 2012 Rainfall, Runoff, Water Level & Temperature Beebe Lake Wright County, MN (#86-0023) Prepared
An Alternative Temporal Rainfall Distribution for Hydrologic Analysis and Design
 An Alternative Temporal Rainfall Distribution for Hydrologic Analysis and Design Joseph P. Wilson, PE, PH Wilson Hydro, LLC PhD Candidate Missouri University of Science Technology Rolla, Missouri Sorry
WMS 10.1 Tutorial GSSHA Applications Precipitation Methods in GSSHA Learn how to use different precipitation sources in GSSHA models
 v. 10.1 WMS 10.1 Tutorial GSSHA Applications Precipitation Methods in GSSHA Learn how to use different precipitation sources in GSSHA models Objectives Learn how to use several precipitation sources and
INDIAN INSTITUTE OF SCIENCE STOCHASTIC HYDROLOGY. Lecture -30 Course Instructor : Prof. P. P. MUJUMDAR Department of Civil Engg., IISc.
 INDIAN INSTITUTE OF SCIENCE STOCHASTIC HYDROLOGY Lecture -30 Course Instructor : Prof. P. P. MUJUMDAR Department of Civil Engg., IISc. Summary of the previous lecture IDF relationship Procedure for creating
Chapter 5 CALIBRATION AND VERIFICATION
 Chapter 5 CALIBRATION AND VERIFICATION This chapter contains the calibration procedure and data used for the LSC existing conditions model. The goal of the calibration effort was to develop a hydraulic
Homework 10. Logan Dry Canyon Detention Basin Design Case Study Date: 4/14/14 Due: 4/25/14
 Homework 10. Logan Dry Canyon Detention Basin Design Case Study Date: 4/14/14 Due: 4/25/14 Section 1: Case Study Introduction This case study serves as an integrative problem based learning exercise. In
Depth-Duration Frequency (DDF) and Depth-Area- Reduction Factors (DARF)
 and Depth-Area- Reduction Factors (DARF)") Spatial Analysis of Storms Using GIS Brian Hoblit, Steve Zelinka, Cris Castello, and David Curtis Abstract Point data from rain gages have been historically used to develop depth-area relationships, design
Spatial Analysis of Storms Using GIS Brian Hoblit, Steve Zelinka, Cris Castello, and David Curtis Abstract Point data from rain gages have been historically used to develop depth-area relationships, design
Results of Intensity-Duration- Frequency Analysis for Precipitation and Runoff under Changing Climate
 Results of Intensity-Duration- Frequency Analysis for Precipitation and Runoff under Changing Climate Supporting Casco Bay Region Climate Change Adaptation RRAP Eugene Yan, Alissa Jared, Julia Pierce,
Intensity-Duration-Frequency (IDF) Curves Example
 Curves Example") Intensity-Duration-Frequency (IDF) Curves Example Intensity-Duration-Frequency (IDF) curves describe the relationship between rainfall intensity, rainfall duration, and return period (or its inverse, probability
Intensity-Duration-Frequency (IDF) Curves Example Intensity-Duration-Frequency (IDF) curves describe the relationship between rainfall intensity, rainfall duration, and return period (or its inverse, probability
Objectives: After completing this assignment, you should be able to:
 Data Analysis Assignment #1 Evaluating the effects of watershed land use on storm runoff Assignment due: 21 February 2013, 5 pm Objectives: After completing this assignment, you should be able to: 1) Calculate
Kije Sipi. Kije Sipi Ltd. Weather Radar Derived Rainfall Areal Reduction Factors
 Ltd Weather Radar Derived Rainfall Areal Reduction Factors J. P. Jolly 1, D. I. Jobin 1, S. Lodewyk 2 1. Ltd, Ottawa ON, Canada 2. City of Edmonton, Edmonton AB Canada ABSTRACT Rainfall Areal Reduction
Appendix B Equations and Examples
 Equations and Examples Purpose The purpose of this appendix is to provide background equations and example problems for clarity of calculations used throughout the manual. This appendix is divided into
CIVE322 BASIC HYDROLOGY
 CIVE322 BASIC HYDROLOGY Homework No.3 Solution 1. The coordinates of four precipitation gauging stations are A = (3,4), B = (9,4), C = (3,12), and D = (9,12). The observed precipitation amounts at these
INTRODUCTION TO HYDROLOGIC MODELING USING HEC-HMS
 INTRODUCTION TO HYDROLOGIC MODELING USING HEC-HMS By Thomas T. Burke, Jr., PhD, PE Luke J. Sherry, PE, CFM Christopher B. Burke Engineering, Ltd. October 8, 2014 1 SEMINAR OUTLINE Overview of hydrologic
Stormwater Guidelines and Case Studies. CAHILL ASSOCIATES Environmental Consultants West Chester, PA (610)
") Stormwater Guidelines and Case Studies CAHILL ASSOCIATES Environmental Consultants West Chester, PA (610) 696-4150 www.thcahill.com Goals and Challenges for Manual State Stormwater Policy More Widespread
Stormwater Guidelines and Case Studies CAHILL ASSOCIATES Environmental Consultants West Chester, PA (610) 696-4150 www.thcahill.com Goals and Challenges for Manual State Stormwater Policy More Widespread
+ ( f o. (t) = f c. f c. )e kt (1)
 = f c. f c. )e kt (1)") CIVE Basic Hydrology Jorge A. Ramírez Computations Example Assume that the time evolution of the infiltration capacity for a given soil is governed by Horton's equation (Note that this equation assumes
CIVE Basic Hydrology Jorge A. Ramírez Computations Example Assume that the time evolution of the infiltration capacity for a given soil is governed by Horton's equation (Note that this equation assumes
Volume 1, Chapter 4 Rainfall
 Volume 1, Chapter 4 Rainfall Users Guidance: If a UDFCD Section number in this chapter is skipped: It was adopted as is; please refer to that Section in the corresponding UDFCD Manual, Volume, Chapter
Extreme Rain all Frequency Analysis for Louisiana
 78 TRANSPORTATION RESEARCH RECORD 1420 Extreme Rain all Frequency Analysis for Louisiana BABAK NAGHAVI AND FANG XIN Yu A comparative study of five popular frequency distributions and three parameter estimation
The Beleaguered Figure 15
 The Beleaguered Figure 15 TFMA 2015 Fall Technical Summit After the Floods: Texas Rising Craig Loftin, PE, CFM US Weather Bureau Technical Paper No. 40, Figure 15 Village Creek Watershed 1 100-Year 30-Minute
The Beleaguered Figure 15 TFMA 2015 Fall Technical Summit After the Floods: Texas Rising
 The Beleaguered Figure 15 TFMA 2015 Fall Technical Summit After the Floods: Texas Rising Craig Loftin, PE, CFM US Weather Bureau Technical Paper No. 40, Figure 15 Village Creek Watershed 100-Year 30-Minute
Technical Memorandum
 Tucson Office 3031 West Ina Road Tucson, AZ 85741 Tel 520.297.7723 Fax 520.297.7724 www.tetratech.com Technical Memorandum To: Kathy Arnold From: Ronson Chee/Greg Hemmen Company: Rosemont Copper Company
STREUVER FIDELCO CAPPELLI, LLC YONKERS DOWNTOWN DEVELOPMENT PHASE 1. DRAFT ENVIRONMENTAL IMPACT STATEMENT For: PALISADES POINT
 STREUVER FIDELCO CAPPELLI, LLC YONKERS DOWNTOWN DEVELOPMENT PHASE 1 DRAFT ENVIRONMENTAL IMPACT STATEMENT For: PALISADES POINT Prepared by: PAULUS, SOKOLOWSKI & SARTOR STORMWATER MANAGEMENT 1. Methodology
Storm rainfall. Lecture content. 1 Analysis of storm rainfall 2 Predictive model of storm rainfall for a given
 Storm rainfall Lecture content 1 Analysis of storm rainfall 2 Predictive model of storm rainfall for a given max rainfall depth 1 rainfall duration and return period à Depth-Duration-Frequency curves 2
INDIAN INSTITUTE OF SCIENCE STOCHASTIC HYDROLOGY. Lecture -29 Course Instructor : Prof. P. P. MUJUMDAR Department of Civil Engg., IISc.
 INDIAN INSTITUTE OF SCIENCE STOCHASTIC HYDROLOGY Lecture -29 Course Instructor : Prof. P. P. MUJUMDAR Department of Civil Engg., IISc. Summary of the previous lecture Goodness of fit Chi-square test χ
Drainage Analysis. Appendix F
 Drainage Analysis Appendix F Golden View Drive Elizabeth Street LMORE CREEK Ricky Road Rabbit Creek Road LITTLE RABBIT CREEK East 156th Avenue MOA Project #10-026 Golden View Drive Intersection
Impacts of Updated Design Rainfall Values on Louisiana Infrastructure
 Louisiana State University LSU Digital Commons LSU Master's Theses Graduate School 9-1-2018 Impacts of Updated Design Rainfall Values on Louisiana Infrastructure Mario Durbic mdurbi3@lsu.edu Follow this
HYDROLOGY REPORT Tentative Tract No. 5978
 ATTACHMENT 5 October 2016 HYDROLOGY REPORT Tentative Tract No. 5978 City of Simi Valley County of Ventura Prepared For: Landsea Holdings Corporation 7525 Irvine Center Drive Suite 200 Irvine, CA 92618
Monte Carlo Simulations for Probabilistic Flood Hazard Assessment
 Monte Carlo Simulations for Probabilistic Flood Hazard Assessment Jemie Dababneh, Ph.D., P.E., 1 and Mark Schwartz, P.E. 1 1 RIZZO Associates, Monroeville, Pennsylvania Presentation to PSA 2017 International
David R. Vallee Hydrologist-in-Charge NOAA/NWS Northeast River Forecast Center
 David R. Vallee Hydrologist-in-Charge NOAA/NWS Northeast River Forecast Center Record flooding along the Shawsheen River during the 2006 Mother s Day Floods Calibrate and implement a variety of hydrologic
Statistical Analysis of Climatological Data to Characterize Erosion Potential: 2. Precipitation Events in Eastern Oregon/Washington
 E jiyu), Statistical Analysis of Climatological Data to Characterize Erosion Potential:. Precipitation Events in Eastern Oregon/Washington Special Report September Agricultural Experiment Station Oregon
USDA NRCS Implementation of NOAA Atlas 14. NRCS Work to Implement NOAA Atlas 14
 USDA NRCS Implementation of NOAA Atlas 1 An Equal Opportunity Provider and Employer Annette Humpal, P.E. USDA NRCS Hydraulic Engineer Background: NRCS Work to Implement NOAA Atlas 1 NRCS Priority to work
Module 1. Lecture 2: Weather and hydrologic cycle (contd.)
") Lecture 2: Weather and hydrologic cycle (contd.) Hydrology Hydor + logos (Both are Greek words) Hydor means water and logos means study. Hydrology is a science which deals with the occurrence, circulation
Lecture 2: Weather and hydrologic cycle (contd.) Hydrology Hydor + logos (Both are Greek words) Hydor means water and logos means study. Hydrology is a science which deals with the occurrence, circulation
Alex s Guide to Word Problems and Linear Equations Following Glencoe Algebra 1
 Alex s Guide to Word Problems and Linear Equations Following Glencoe Algebra 1 What is a linear equation? It sounds fancy, but linear equation means the same thing as a line. In other words, it s an equation
Notes: Space for as many as two segments per flow type can be used for each worksheet. Include a map, schematic, or description of flow segments.
 Worksheet 3: Time of Concentration (Tc) or travel time (Tt) Project By Date Location Checked Date Check one: Present Developed Check one: Tc Tt through subarea Notes: Space for as many as two segments
Updated Precipitation Frequency Estimates for Minnesota
 1 Updated Precipitation Frequency Estimates for Minnesota Presenter: Authors: (alphabetical order) Sanja Perica, Director Hydrometeorological Design Studies Center (HDSC), Office of Hydrology, National
Workshop: Build a Basic HEC-HMS Model from Scratch
 Workshop: Build a Basic HEC-HMS Model from Scratch This workshop is designed to help new users of HEC-HMS learn how to apply the software. Not all the capabilities in HEC-HMS are demonstrated in the workshop
ARTICLE 5 (PART 2) DETENTION VOLUME EXAMPLE PROBLEMS
 DETENTION VOLUME EXAMPLE PROBLEMS") ARTICLE 5 (PART 2) DETENTION VOLUME EXAMPLE PROBLEMS Example 5.7 Simple (Detention Nomograph) Example 5.8 Offsite and Unrestricted Areas (HEC-HMS) Example 5.9 Ponds in Series w/ Tailwater (HEC-HMS) Example
ARTICLE 5 (PART 2) DETENTION VOLUME EXAMPLE PROBLEMS Example 5.7 Simple (Detention Nomograph) Example 5.8 Offsite and Unrestricted Areas (HEC-HMS) Example 5.9 Ponds in Series w/ Tailwater (HEC-HMS) Example
Weighting of Field Monitoring Data With Probability Distributions of Daily Rainfall
 Weighting of Field Monitoring Data With Probability Distributions of Daily Rainfall Abstract James H. Lenhart, PE, D.WRE and Scott A. de Ridder CONTECH Stormwater Solutions, 11835 NE Glenn Widing Drive,
RAINFALL FREQUENCY ANALYSIS FOR NEW BRAUNFELS, TX (or Seems like we ve been having lots of 100-yr storms)
") RAINFALL FREQUENCY ANALYSIS FOR NEW BRAUNFELS, TX (or Seems like we ve been having lots of 100-yr storms) Presented By: SAUL NUCCITELLI, PE, CFM (LAN) BLAKE KRONKOSKY, EIT (LAN) JIM KLEIN, PE (CITY OF
RAINFALL FREQUENCY ANALYSIS FOR NEW BRAUNFELS, TX (or Seems like we ve been having lots of 100-yr storms) Presented By: SAUL NUCCITELLI, PE, CFM (LAN) BLAKE KRONKOSKY, EIT (LAN) JIM KLEIN, PE (CITY OF
Unit 7 Probability M2 13.1,2,4, 5,6
 + Unit 7 Probability M2 13.1,2,4, 5,6 7.1 Probability n Obj.: I will be able to determine the experimental and theoretical probabilities of an event, or its complement, occurring. n Vocabulary o Outcome
Technical Memorandum. City of Salem, Stormwater Management Design Standards. Project No:
 Technical Memorandum 6500 SW Macadam Avenue, Suite 200 Portland, Oregon, 97239 Tel: 503-244-7005 Fax: 503-244-9095 Prepared for: Project Title: City of Salem, Oregon City of Salem, Stormwater Management
The effectiveness of the Natural Resource Conservation Service (NRCS) and Huff rainfall distribution methods for use in detention basin design
 and Huff rainfall distribution methods for use in detention basin design") Scholars' Mine Masters Theses Student Theses and Dissertations Spring 2010 The effectiveness of the Natural Resource Conservation Service (NRCS) and Huff rainfall distribution methods for use in detention
Scholars' Mine Masters Theses Student Theses and Dissertations Spring 2010 The effectiveness of the Natural Resource Conservation Service (NRCS) and Huff rainfall distribution methods for use in detention
Updating Probable Maximum Precipitation for the Tennessee Valley Authority
 Updating Probable Maximum Precipitation for the Tennessee Valley Authority Bill Kappel, President/Senior Meteorologist Applied Weather Associates, Monument, CO www.appliedweatherassociates.com Mike Eiffe,
******************* Project Description ******************* File Name... NAAF Stormwater Improvement Project 11_21_2014.SPF
 Autodesk Storm and Sanitary Analysis 2014 - Version 8.1.62 (Build 1) ----------------- *** Project Description *** File Name... NAAF Stormwater Improvement Project 11_21_2014.SPF Analysis Options Flow
Probable Maximum Precipitation Study
 Probable Maximum Precipitation Study Virginia Floodplain Management Association Workshop Thursday, October 29, 2015 Robert T. Bennett, PE, RA, CFM DCR Dam Safety & Floodplain Management Definition (4VAC50-20-50.H)
Hydrology and Hydraulics Design Report. Background Summary
 To: National Park Services Montezuma Castle National Monument Richard Goepfrich, Facility Manager From: Multicultural Technical Engineers Date: Tuesday - February 13, 2018 Subject: 30% Hydrology and Hydraulics
Typical Hydrologic Period Report (Final)
") (DELCORA) (Final) November 2015 (Updated April 2016) CSO Long-Term Control Plant Update REVISION CONTROL REV. NO. DATE ISSUED PREPARED BY DESCRIPTION OF CHANGES 1 4/26/16 Greeley and Hansen Pg. 1-3,
(DELCORA) (Final) November 2015 (Updated April 2016) CSO Long-Term Control Plant Update REVISION CONTROL REV. NO. DATE ISSUED PREPARED BY DESCRIPTION OF CHANGES 1 4/26/16 Greeley and Hansen Pg. 1-3,
Lecture 2: Precipitation
 2-1 GEOG415 Lecture 2: Precipitation Why do we study precipitation? Precipitation measurement -- depends on the study purpose. Non-recording (cumulative) Recording (tipping bucket) Important parameters
Detailed Storm Rainfall Analysis for Hurricane Ivan Flooding in Georgia Using the Storm Precipitation Analysis System (SPAS) and NEXRAD Weather Radar
 and NEXRAD Weather Radar") Detailed Storm Rainfall Analysis for Hurricane Ivan Flooding in Georgia Using the Storm Precipitation Analysis System (SPAS) and NEXRAD Weather Radar Ed Tomlinson, PhD and Bill Kappel Applied Weather Associates
Detailed Storm Rainfall Analysis for Hurricane Ivan Flooding in Georgia Using the Storm Precipitation Analysis System (SPAS) and NEXRAD Weather Radar Ed Tomlinson, PhD and Bill Kappel Applied Weather Associates
City of Columbia BMP Manual. Detailed Unified Sizing Criteria Example Wet Pond Design
 City of Columbia BMP Manual Detailed Unified Sizing Criteria Example Wet Pond Design April 17, 2013 Wet Pond Example: Unified Sizing Criteria Methodology Base Data Location: Rome, GA Site Drainage Area
Basic Hydraulics June 2007
 Basic Hydraulics www.concrete-pipe.org June 2007 2007 Overview Open Channel Flow Manning Equation Basic Culvert Design Sanitary Sewer Design Flow, Velocity Stormwater Sewer Design Flow, Velocity 2 Open
CSO Data Approaches and Options
 CSO Data Approaches and Options Background: During the phase V model calibration in 2010, Tetra Tech developed the CSO data for all 64 CSOs in the bay watershed for 1985-2009. With the available monitoring
FHWA - HIGHWAY HYDROLOGY
 The unit peak discharge is computed with Equation 5.6 by interpolating c 0, c, and c Table 5.5 using a type II distribution. The peak discharge is also calculated as follows. from Variable SI Unit U Unit.5444
Extreme Events: What Do the Data Say?
 Extreme Events: What Do the Data Say? Objectives: Students will be able to: compare a typical and extreme weather event using precipitation and streamflow data use descriptive statistics (measures of central
Terrestrial Flood Risk and Climate Change in the Yallahs River, Jamaica. An assessment of future flood risk. projections of future climate
 Terrestrial Flood Risk and Climate Change in the Yallahs River, Jamaica An assessment of future flood risk using hydrodynamic models driven by projections of future climate Matthew Wilson1, Arpita Mandal2,
APPENDIX B Hydrologic Model Spring Event
 Jock River Flood Risk Mapping (within the City of Ottawa) Hydrology Report July 2004 PageB1 APPENDIX B Hydrologic Model Spring Event Snowmelt+Rainfall Calibration and Validation Results Design Events Explanation
LESSON HEC-HMS
 LESSON 2.2 - HEC-HMS Introduction: TEAM 8 SCS method: The input data: Thiessen Polygons: Concentration Lag Time: SCS Method: Calculation of CN: Result figures: CONSTRUCTING HYDROGRAPH WITH HEC-HMS: Rainfall
This site will utilize an infiltration berm to manage the two-year/24-hour volume increase.
 Gates TETRA TECH, INC. By: RH Date: 1/30/2017 Subject: Gates Road Checked By: JB Date: 2/1/2017 PCSM Design and Evaluation PURPOSE: The purpose of these calculations is to design a Post-Construction Stormwater
Lessons Learned and Shared
 Lessons Learned and Shared Plan for the worst. Hope for the best. Remember that hope is not a strategy. Agnes 8 Lessons 1. Identify Susceptible Communities 2. Develop a Plan 3. Threat Recognition 4. Review
This site will utilize an infiltration berm to manage the two-year/24-hour volume increase.
 High Street TETRA TECH, INC. By: RH Date: 1/30/2017 Subject: High Street Checked By: JB Date: 2/1/2017 PCSM Design and Evaluation PURPOSE: The purpose of these calculations is to design a Post-Construction
Storm Report : September 27, 2014
 True-color Visible Satellite, Sep. 27, 2014 2:00 PM MST Flood Control District of Maricopa County Engineering Division, Flood Warning Branch Storm Report : September 27, 2014 Initial Release: 10/10/2014
LITERATURE REVIEW. History. In 1888, the U.S. Signal Service installed the first automatic rain gage used to
 LITERATURE REVIEW History In 1888, the U.S. Signal Service installed the first automatic rain gage used to record intensive precipitation for short periods (Yarnell, 1935). Using the records from this
Statistical Analysis of Climatological Data to Characterize Erosion Potential: 6. Joint Precipitation and Freezing Events in Eastern Oregon/Washington
 5 Statistical Analysis of Climatological Data to Characterize Erosion Potential: 6. Joint Precipitation and Freezing Events in Eastern Oregon/Washington ecial Report 69 April 98 Agricultural Experiment
Rainfall-Flood Hazard along the Cagayan River in Carmen
 -Flood Hazard along the Cagayan River in Carmen Things to watch out for when rain falls intensity 12 December 2013, Cagayan de Oro City Hall 3 +1 main questions I What do we need to understand about rainfall
Technical Notes: Magnitude and Return Period of 2004 Hurricane Rainfall in Florida
 Journal of Floodplain Management Floodplain Management Association NOV. 2005 Vol. 5, No. 1 Glenn Tootle 1 Thomas Mirti 2 Thomas Piechota 3 Technical Notes: Magnitude and Return Period of 2004 Hurricane
USGS ATLAS. BACKGROUND
 USGS ATLAS. BACKGROUND 1998. Asquith. DEPTH-DURATION FREQUENCY OF PRECIPITATION FOR TEXAS. USGS Water-Resources Investigations Report 98 4044. Defines the depth-duration frequency (DDF) of rainfall annual
EROSION CONTROL NARRATIVE
 EROSION CONTROL NARRATIVE Erosion and sediment control has been designed for the Willow Bend Phase I Subdivision according to UDFCD and the City of Thornton criteria, in order to minimize erosion and sediment
Joint Occurrence and Probabilities of Tides and Rainfall
 Joint Occurrence and Probabilities of Tides and Rainfall City of Virginia Beach, Virginia CIP 7-030, PWCN-15-0014, Work Orders 2 and 5A Final Report Date: October 9, 2017 Submitted to: City of Virginia
This site will utilize an infiltration berm to manage the two-year/24-hour volume increase.
 Gates TETRA TECH, INC. By: RH Date: 11/11/2016 Subject: Gates Road Checked By: JB Date: 11/13/2016 PCSM Design and Evaluation PURPOSE: The purpose of these calculations is to design a Post-Construction
Sediment Capture in Pervious Concrete Pavement tsystems: Effects on Hydrological Performance and Suspended Solids
 Concrete Sustainability Conference April 14 th 2010, Tempe, AZ Sediment Capture in Pervious Concrete Pavement tsystems: Effects on Hydrological l Performance and Suspended Solids Discharge Luis A. Mata,
APPENDIX B HYDROLOGY
 APPENDIX B HYDROLOGY TABLE OF CONTENTS 1.0 INTRODUCTION... 1 2.0 PROBABLE MAXIMUM PRECIPITATION (PMP)... 1 3.0 DESIGN FLOW CALCULATION... 1 4.0 DIVERSION CHANNEL SIZING... 2 5.0 REFERENCES... 4 LIST OF
Indiana County Flash Flood of 22 June 2017
 Indiana County Flash Flood of 22 June 2017 By Richard H. Grumm National Weather Service State College, PA 1. Overview Slow moving thunderstorms brought 3 to 4 inches of rainfall to Indiana County, PA during
Format of CLIGEN weather station statistics input files. for CLIGEN versions as of 6/2001 (D.C. Flanagan).
.") Format of CLIGEN weather station statistics input files for CLIGEN versions 4.1-5.1 as of 6/2001 (D.C. Flanagan). updated 12/11/2008 - Jim Frankenberger These files are also known as CLIGEN state files
Format of CLIGEN weather station statistics input files for CLIGEN versions 4.1-5.1 as of 6/2001 (D.C. Flanagan). updated 12/11/2008 - Jim Frankenberger These files are also known as CLIGEN state files
A Study on Storm Water Drainage System of Annanagara and Ashokanagara of Shimoga City Karnataka India
 A Study on Storm Water Drainage System of Annanagara and Ashokanagara of Shimoga City Karnataka India Veena D Savanth Lecturer, Department of Civil Engineering Jain Institute of Technology, Davanagere,
WMS 9.0 Tutorial GSSHA Modeling Basics Infiltration Learn how to add infiltration to your GSSHA model
 v. 9.0 WMS 9.0 Tutorial GSSHA Modeling Basics Infiltration Learn how to add infiltration to your GSSHA model Objectives This workshop builds on the model developed in the previous workshop and shows you
ACTIVITY. Weather Radar Investigation. Additional Activities
 ACTIVITY Introduction Approach Activity Weather Radar Investigation Radar is an important weather observing tool 1. Construct a Radar Screen slide chart by used to locate areas of precipitation and to
Changes to Extreme Precipitation Events: What the Historical Record Shows and What It Means for Engineers
 Changes to Extreme Precipitation Events: What the Historical Record Shows and What It Means for Engineers Geoffrey M Bonnin National Oceanic and Atmospheric Administration National Weather Service Office
Rainfall Lab. Forest Water Resources Spring 20XX
 Rainfall Lab Forest Water Resources Spring 20XX Introduction The most simplistic way to understand rainfall in a particular area is to look at the area s average annual rainfall. That simple statistic
Hydrologic Modeling System HEC-HMS
 Hydrologic Engineering Center Hydrologic Modeling System HEC-HMS Quick Start Guide Version 3.3 September 2008 Approved for Public Release Distribution Unlimited CPD-74D REPORT DOCUMENTATION PAGE Form Approved
Alex J. Cannon Climate Research Division Environment and Climate Change Canada GEWEX Open Science Conference Canmore, AB May 9, 2018
 Projected intensification of sub-daily rainfall extremes in convection-permitting climate model simulations over North America: Implications for future Intensity-Duration-Frequency curves Alex J. Cannon
RAINFALL CHARACTERIZATION IN AN ARID AREA
 Engineering Journal of Qatar University, Vol. 4, 1991, p. 35-50. RAINFALL CHARACTERIZATION IN AN ARID AREA Abdallah S. Bazaraa and Shamim Ahmed Department of Civil Engineering Qatar University, Doha, Qatar.
Urban Hydrology for Small Watersheds
 United States Department of Agriculture Natural Resources Conservation Service Conservation Engineering Division Urban Hydrology for Small Watersheds TR-55 Technical Release 55 June 1986 To show bookmarks
Time distribution of rainfall, December 1977 (M.S. thesis)
") Lehigh University Lehigh Preserve Fritz Laboratory Reports Civil and Environmental Engineering 1977 Time distribution of rainfall, December 1977 (M.S. thesis) Robert A. Putt Follow this and additional
Lehigh University Lehigh Preserve Fritz Laboratory Reports Civil and Environmental Engineering 1977 Time distribution of rainfall, December 1977 (M.S. thesis) Robert A. Putt Follow this and additional
Three main areas of work:
 Task 2: Climate Information 1 Task 2: Climate Information Three main areas of work: Collect historical and projected weather and climate data Conduct storm surge and wave modeling, sea-level rise (SLR)
NRC Workshop Probabilistic Flood Hazard Assessment (PFHA) Jan 29-31, Mel Schaefer Ph.D. P.E. MGS Engineering Consultants, Inc.
 Jan 29-31, Mel Schaefer Ph.D. P.E. MGS Engineering Consultants, Inc.") Stochastic Event Flood Model (SEFM) Stochastic Modeling of Extreme Floods A Hydrological Tool for Analysis of Extreme Floods Mel Schaefer Ph.D. P.E. MGS Engineering Consultants, Inc. Olympia, WA NRC Workshop
Stochastic Event Flood Model (SEFM) Stochastic Modeling of Extreme Floods A Hydrological Tool for Analysis of Extreme Floods Mel Schaefer Ph.D. P.E. MGS Engineering Consultants, Inc. Olympia, WA NRC Workshop
SOUTH MOUNTAIN WEATHER STATION: REPORT FOR QUARTER 2 (APRIL JUNE) 2011
 2011") SOUTH MOUNTAIN WEATHER STATION: REPORT FOR QUARTER 2 (APRIL JUNE) 2011 Prepared for ESTANCIA BASIN WATERSHED HEALTH, RESTORATION AND MONITORING STEERING COMMITTEE c/o CLAUNCH-PINTO SOIL AND WATER CONSERVATION
SOUTH MOUNTAIN WEATHER STATION: REPORT FOR QUARTER 2 (APRIL JUNE) 2011 Prepared for ESTANCIA BASIN WATERSHED HEALTH, RESTORATION AND MONITORING STEERING COMMITTEE c/o CLAUNCH-PINTO SOIL AND WATER CONSERVATION
Advanced Hydrology Prof. Dr. Ashu Jain Department of Civil Engineering Indian Institute of Technology, Kanpur. Lecture - 13
 Advanced Hydrology Prof. Dr. Ashu Jain Department of Civil Engineering Indian Institute of Technology, Kanpur Lecture - 13 Good morning friends and welcome to the video course on Advanced Hydrology. In
DRAINAGE REPORT FOR THORNTON SELF STORAGE THORNTON, COLORADO
 DRAINAGE REPORT FOR THORNTON SELF STORAGE THORNTON, COLORADO Prepared by: Bowman Consulting 603 Park Point Dr. Suite 100 Golden, CO 80401 (303)-801-2900 June 29, 2015 Revised August 14, 2015 CERTIFICATE
Stormwater Capacity Analysis for Westover Branch Watershed
 Stormwater Capacity Analysis for Westover Branch Watershed Pimmit Run Little Pimmit Run, Mainstem Stohman's Run Gulf Branch Pimmit Run Tributary Little Pimmit Run, W. Branch Little Pimmit Run, E. Branch
Investigation IV: Seasonal Precipitation and Seasonal Surface Runoff in the US
 Investigation IV: Seasonal Precipitation and Seasonal Surface Runoff in the US Purpose Students will consider the seasonality of precipitation and surface runoff and think about how the time of year can