CHAPTER 3: COAL-BEARING INTERVALS OF THE BOURBON ARCH
|
|
|
- Rodger Holmes
- 5 years ago
- Views:
Transcription
1 68 CHAPTER 3: COAL-BEARING INTERVALS OF THE BOURBON ARCH
2 Introduction The examination of Desmoinesian coal-bearing intervals includes: 1) facies successions and their associated well-log characteristics; 2) coal isopach geometries, distributions, extents, and thicknesses; 3); the relation of coal to adjacent sediments; and 4) coal quality data specifically ash and sulfur content. The results were used for depositional interpretation of coal-bearing intervals and the classification of Desmoinesian strata into a sequence-stratigraphic framework. Previous investigations described and mapped Cherokee strata by placing defined facies into stratigraphic intervals (Harris, 1984; Staton, 1987; Huffman, 1991; and Lange, 2003). These studies relied on marker horizons consisting of underclay, coal, and overlying shale for correlation purposes. The Cherokee and Marmaton groups can be divided into stratigraphic packages bound by surfaces separating coals or underclay from overlying shales (Fig. 3.01). In order to include two potentially economic coals, the study was extended to two additional stratigraphic intervals in the Marmaton Stage (Mulberry and Lexington coals; Figs and 3.03) Coal Proximate Analysis Following the decanistering of coal desorption samples, coals were slabbed with half being sent to a commercial lab for proximate and sulfur analysis; or kept in house for determining ash and moisture content only both options in accordance with ASTM standards. The ASTM Annual Book of Standards (2002) provides detailed description of coal analysis techniques and procedures. Range and average values for ash and sulfur contents of select coals within the Bourbon arch study limits
3 70

4 71
5 72
6 73 were compared to values from the Cherokee basin (Figs and 3.05; Lange, 2003). Ash and sulfur contents are expressed as weight percents on a moisture-free basis. Ash is attributed to the proximity of a peat-forming environment to active siliciclastic sedimentation (McCabe, 1991). Lower ash coals (<25 %) developed as peats removed from siliciclastic influx, whereas higher ash coals developed as peats in close proximity to active sedimentation or rapid marine transgression (McCabe and Shanley, 1992). Coal ash content is highly variable in eastern Kansas (4.9 to 80.7 %; Fig. 3.04). In general, Bourbon arch coals have lower and less variable ash content than Cherokee basin coals in the lower Desmoinesian, and higher and more variable ash content than Cherokee basin coals in the upper Desmoinesian (Fig. 3.04). Sulfur is normally thought to be a direct reflection of peat-forming environment. High-sulfur (>2.0 %) coals formed proximal to marine environments while low-sulfur coals formed in more landward, freshwater environments (McCabe, 1991; Brady and Hatch, 1997). Sulfur, however, may reflect marine influence from transgression rather than depositional setting (McCabe, 1991). Sulfur content is inversely related to the thickness of overlying non-marine shale. Coals underlying thinner non-marine shale typically show higher sulfur contents (McCabe, 1991). Coal beds within the study area directly underlie brackish to marine shale (Appendix A; Johnson, 2004), and have sulfur contents ranging from 1.4 to 11.9 % (Fig. 3.05). Coal sulfur content in the Bourbon arch study area is considered to reflect depositional setting and proximity to marine processes. Bourbon arch coals have comparable sulfur content to Cherokee basin coals (Fig. 3.05).

7 74

8 75
9 Subsurface Mapping Digital subsurface maps of coal isopachs and various sub-sea structure contours were constructed by stratigraphic interpretation and correlation of well logs using a digital subsurface mapping program. Isopach and structure maps were inspected for data quality (outlying data busts or gridding glitches). Control points were used to smooth data in problematic areas. Coal isopach and structure contour maps of adjacent surfaces were superimposed and exported. All coal isopach maps used an arbitrarily lower thickness cut-off of 0.5 feet (0.15 m). The maximum thickness of any coal with the study limits is 3.8 feet (1.1 m). The lower cutoff was used to eliminate gridding noise in surface-to-surface correlation of digitally scanned well logs and remove unreasonable extrapolations beyond logging tool resolution. Average coal thickness values were statistically calculated from all data points. Range and average values for coal thickness of select coals within the Bourbon arch study limits are illustrated in Figure For comparison, coal thickness values from in the Cherokee basin are presented (Lange, 2003; Fig. 3.06). Bourbon arch coal thickness is comparable to coals in the Cherokee basin except for the Weir-Pittsburg and Riverton coals, which have greater average and maximum thickness in the Cherokee basin (Fig. 3.06). Table 3.1 summarizes the seam characteristics (seam orientation, relation to depositional orientation, geometry, average thickness, lateral extent, continuity, and coal distribution) determined from each coal isopach. Extent was determined by calculating the area of a polygon drawn around each coal seam isopach. Continuity

10 77
11 78 Table 3.1 Summary of coal seam characteristics. COAL Seam Orientation Depositional Orientation (parallel to) Geometry Mulberry NW-SE ND Lenticular; Pod-like Lexington NW-SE ND Lenticular; Pod-like Summit NW-SE ND Circular and pod-like Mulky NW-SE ND Circular and pod-like Bevier NE-SW Dip Lenticular; Elongate Croweburg NE-SW Dip Elongate; Lenticular Mineral NW-SE Strike Lenticular Scammon NE-SW Dip Elongate Tebo NW-SE Strike Lenticular Weir-Pittsburg NE-SW Dip Lenticular Dry Wood NE-SW Strike Lenticular Rowe NW-SE Strike Lenticular Neutral NW-SE Strike Lenticular Riverton NW-SE ND Lenticular; Elongate ND=Not Discernible Table 3.1 (continued) COAL Avg. thick. (ft.) Extent (mi 2 ) Continuity (mi 2 ) % of extent Area > than avg. thick. (mi 2 ) % of extent # data pts. Mulberry Lexington Summit Mulky Bevier Croweburg Mineral Scammon Tebo Weir-Pittsburg Dry Wood Rowe Neutral Riverton
12 79 was determined by subtracting the area of coal isopach greater than 1 foot (0.3 m) from the extent. Although the area of the Bourbon arch study area was calculated as 4040 square miles (10,463 sq. km), the isopach mapping area was calculated to be 4314 square miles (11,173 sq. km) due to overlap into adjacent counties. 3.2 Stratigraphy of Coal-bearing Intervals Riverton Interval Across eastern Kansas, Atokan (?) and Desmoinesian strata unconformably overlie Mississippian Limestone (Osagian and Meramecian stages). The karsted Mississippian surface has a structural dip trending to the west-northwest, has weak east-west trending anticlinal structures, and is characterized by a cherty carbonate residuum observed in core (Fig. 3.07; Appendix A; Merriam, 1963; Johnson, 2004). The Riverton interval extends from the top of the karsted Mississippian Limestone to the top of the Riverton coal (Fig. 3.08). The base of the overlying Riverton shale is considered the upper limit when the coal is absent, as is the base of the Warner sandstone when incised through the Riverton shale and coal. These boundaries are similar to Huffman s (1991), with the exception that both the McLouth and X-marker intervals are included within the Riverton interval. From the top of the Mississippian, the interval includes the McLouth Sandstone and the X- marker limestone (both observed only in well logs north of the Bourbon arch), and the Riverton coal (Fig. 3.02). Interpreted regional unconformities within the interval include the top of the Mississippian Limestone and the base of the McLouth

13 80

14 81
15 82 Sandstone. North of the study area, several additional coals have been observed stratigraphically below the Riverton coal and above the Mississippian Limestone (Tedesco, 1992; Bostic et al., 1993). The Riverton interval ranges between 4 and 80 feet (1.2 to 24.4 m) thick, averaging 25 feet (7.6 m). Thin areas are located along the Bourbon arch, including Bourbon, southern Linn, northern Allen, southern Anderson, and eastern Woodson counties (Appendix B). Thinness may be due to non-deposition or channel incision from the overlying Warner Sandstone. Thickest areas occur north of the Bourbon arch into the Forest City basin in Franklin and northern Anderson counties. Regional depositional orientation of the Riverton interval is inconclusive. Differences exist in interval boundaries; however, Lange (2003) reported thicknesses ranging from 4 to 40 feet (1.2 to 12.2 m), averaging 15 feet (4.6 m) in the Cherokee basin. In ascending order, observed lithofacies from the Franklin County core include two underclays separated by a conglomerate bed at the base. This basal succession, in turn, underlies a complex of two fining-upward successions: the first consisting of heterolithic sandstone and underclay, the other of bioturbated sandstone, heterolithic sandstone, and underclay (McLouth Sandstone). The Riverton interval of the Franklin County core is capped by pyritic black shale with interbedded bioturbated sandstone, grading into underclay and thin coal (interpreted as the Riverton coal; Fig. 3.08; Appendix A). The Warner Sandstone sharply overlies the thin Riverton coal at this location. Observed lithofacies of the Riverton interval in the Rose Hill #1-6 core (Miami County) are in ascending order: the underclay facies and
16 83 Pennsylvanian basal conglomerate; cross-bedded sandstone fining upward into heterolithic sandstone (McLouth Sandstone); heterolithic siltstone (with minor heterolithic sandstone); and gray shale facies in sharp contact with overlying Warner Sandstone. The Riverton coal was not observed in the Rose Hill #1-6 core (Johnson, 2004). The Riverton interval of this study differs from southeastern Kansas (Lange, 2003). In the Cherokee basin, the Riverton interval lithofacies succession is Mississippian Limestone, pyritic black shale, followed by underclay. The Riverton coal caps the succession. The Riverton shale of the overlying interval is phosphatic in nature (Lange, 2003). Phosphatic black shale was not recognized in core from the Bourbon arch study area (Appendix A; Johnson, 2004). Riverton Coal Digital subsurface mapping of the Riverton coal reveals two thin, lenticular to elongate coal seam geometries trending NW-SE (Fig. 3.09). The Riverton coal extends an estimated 3578 square miles (9267 sq. km) across the Bourbon arch. The Riverton is estimated to be continuous over 2461 square miles (6374 sq. km) across the study area, or 68.8% of the extent (Table 3.1). Based on interpretation and correlation of well-log data points, thickness of the Riverton coal in the Bourbon arch ranges from 0 to 3.7 feet (0 to 1.1 m), averaging 1.2 feet (0.4 m; Fig. 3.06). The distribution of the Riverton coal is relatively symmetric; 58.6 % of the coal isopach is greater than the average thickness (Table 3.1). Thick coal trends occur in Bourbon, Anderson, and Woodson counties. The Riverton coal pinches out northeastward into

17 84
18 85 Miami County onto a regional Mississippian paleotopographic high (Fig. 3.09). In general, the Riverton coal thickens on regional structural highs and thins into the regional lows. However, localized structural lows of the underlying Mississippian karst surface may show anomalously thick Riverton coal (Fig. 3.09). Lange (2003) described the Riverton coal in the Cherokee basin as having a thin, lenticular geometry, which locally trends parallel to both depositional strike and dip. This description is similar to that of the Bourbon arch, except that the regional depositional orientation of the Riverton coal is inconclusive. Reported thickness of the Riverton in the Cherokee basin ranges from 0 to 4.5 feet (0 to 1.4 m) averaging 1.8 feet (0.5 m; Fig. 3.06). Lange (2003) concluded that the Riverton coal thickens in local Mississippian lows and thins on the highs of the Mississippian erosional surface consistent with local observations in the Bourbon arch. Ash content of the Riverton coal in the Bourbon arch ranges from 11.7 to 19.7 %, averaging 15.2 % (Fig. 3.04). Sulfur content for the Riverton in the subsurface is not available in the study area. In the Cherokee basin, ash content ranges from 10.5 to 34.4 %, averaging 19.3 % (Fig. 3.04), while sulfur values range from 2.8 to 10.7 %, averaging 6.5 % (Fig. 3.05; updated and modified from Lange, 2003) Warner Interval The Warner interval extends from the base of the Warner Sandstone to the base of the A-B shale. When the A-B shale is absent, the Warner interval extends only to the top of the Warner Sandstone (Fig. 3.08). This interval includes the
19 86 Warner Sandstone and overlying Dw, Cw, and Bw coal beds. These informally named coals are either discontinuous or nonexistent within the study area, and were not mapped (Fig. 3.02; Harris, 1984). The Warner interval is analogous to the A-B interval of Huffman (1991), and similar to the A-B interval of Lange (2003). The base of the Warner Sandstone, or its interfluve expression, is interpreted as a regional unconformity. Thickness ranges from 4 to 94 feet (1.2 to 28.7 m), averaging 22 feet (6.7 m). Thicker areas occur in southwestern Allen and southeastern Woodson counties, as well as a NE-SW-trend from southern Johnson County, through northwestern Miami County, Franklin County, and northwestern Anderson County (Appendix B). Thick Warner interval isopach values coincide with thick Warner Sandstone incision and deposition and with zero-isopach thickness in the underlying Riverton coal. The Warner interval is 5 feet (1.5 m) thick in the Franklin County core (Fig. 3.08). Lithofacies include sand- and mud-clast conglomerate capped by a sandy underclay facies. A coal facies of the overlying interval sharply overlies the sandy underclay facies (Fig. 3.08; Appendix A). The Warner interval is 55 feet (16.8 m) thick in the Rose Hill #1-6 core (Johnson, 2004). Lithofacies in ascending order are: coarsening upwards heterolithic siltstone to heterolithic sandstone; interbedded heterolithic siltstone and heterolithic sandstone (thinning-upward beds); and gray shale facies with intermittent heterolithic siltstone coarsening upward into heterolithic siltstone, heterolithic sandstone, and underclay facies. A black shale facies (A-B shale) of the overlying Bluejacket interval overlies the underclay facies (Johnson,
20 ). Facies patterns of the Warner interval in the Cherokee basin are very similar and include in ascending order, phosphatic and non-phosphatic black shales, heterolithic siltstone and heterolithic sandstone, and gray shale facies (Lange, 2003) Bluejacket Interval The Bluejacket interval extends from the base of the A-B shale or top of the Warner Sandstone, to the top of the upper Bluejacket Sandstone, top of the overlying coal (Bjb; Harris, 1984), or base of the overlying black shale marker whichever is present. The Bluejacket interval includes in ascending order, the A-B shale; Aw, Neutral, Rowe, and Dry Wood coals; the lower Bluejacket Sandstone; Dbj and Cbj coals; the upper Bluejacket Sandstone; and the Bbj and Abj coals (Fig. 3.02; Harris, 1984; Huffman, 1991). Regional unconformities within the interval include the basal contacts of both Bluejacket (lower and upper) sandstones and their interfluve expressions. Depositional strike is interpreted to trend NW-SE dipping towards the southwest in the Bourbon arch. This is evident by sinuous zero isopach trends oriented towards the southwest recognizable in all of the Bluejacket coals. Sinuous trends are likely due to channel incision with fluvial transport direction towards the southwest, but may also be the result of nondeposition. Many other authors have indicated northeasterly to southwesterly current directions and sandstone isopach trends for several Cherokee Group sandstones in this interval (e.g. Bass, 1936; Ebanks et al., 1977; Harris, 1984; Staton, 1987; and Huffman, 1991).
21 88 Due to the discontinuous nature and difficulty in correlation of many Bluejacket interval coals, only the Neutral, Rowe, and Dry Wood coals are mapped. The Aw coal, which was correlated and mapped by Lange (2003), is not correlated in this study due to its highly discontinuous nature in the Bourbon arch study area. Only a portion of the Bluejacket interval is included in the interval diagram (Fig. 3.10). Thickness of the Bluejacket interval ranges from 80 to 220 feet (24.4 to 67.0 m) and averages 123 feet (37.5 m). Thinner areas occur in Miami, central Bourbon, western Allen, and central Woodson counties. Thicker areas occur in western Johnson, north and western Franklin, Anderson, central Linn, and eastern Allen counties (Appendix B). Thicker areas are due to incision of either the upper or lower Bluejacket Sandstone into the underlying Warner interval. Because of difficulties in correlating the upper and lower boundaries of the Bluejacket interval both within the study area and between the Bourbon arch and Cherokee basin, the interval does not correspond exactly to the Bluejacket intervals of Huffman (1991) and Lange (2003). Lithofacies observed from 117 feet (35.7 m) within the Rose Hill #1-6 core generally include several coarsening-upward successions of gray shale, heterolithic siltstone, heterolithic sandstone, underclay, and coal (Johnson, 2004). The successions culminating below and between the Neutral and Rowe coals illustrate the typical coarsening-upward successions observed in the Bluejacket interval (Fig. 3.10). Lithofacies observed from 104 feet (31.7 m) of Bluejacket interval found in the Franklin County core are similar to the Rose Hill #1-6 core, with three exceptions: 1) coarsening-upward facies successions underlying the Neutral, Rowe, and Dry Wood

22 89
23 90 coals of the Franklin County core tend to be muddier with more developed underclay facies; 2) the lower Bluejacket Sandstone of the Franklin County core ( ) consists of (in ascending order) heterolithic sandstone, sand- and mud-clast conglomerate, cross-bedded sandstone, heterolithic sandstone, followed by underclay; and 3) black shale and bioturbated sandstone facies typically overlie coals in the Franklin County well (Appendix A). Similar facies successions to those in the Rose Hill #1-6 and Franklin County cores were reported in the corresponding Bluejacket interval of the Cherokee basin (Lange, 2003). Neutral Coal The Neutral coal exhibits a lenticular coal seam geometry oriented parallel to depositional strike (NW-SE; Fig. 3.11). Coal extent is estimated to be 3429 square miles (8881 sq. km). Continuity is estimated to be 1236 square miles (3201 sq. km), or 36.0 % of the seam extent (Table 3.1). Coal thickness ranges from 0 to 2.6 feet (0 to 0.8 m), averaging 0.7 feet (0.2 m) in the Bourbon arch (Fig. 3.06). Thicker Neutral coal is concentrated in small areas as evident from the positively skewed distribution; 64.8 % of the coal isopach is greater than the average thickness (Table 3.1). Thick Neutral coal trends occur in Anderson, eastern Allen, Bourbon, and southern Miami counties. In contrast to the Riverton coal, the Neutral coal is present in Miami County. The Neutral coal tends to thicken on regional structural highs and thin into structural lows of the Mississippian surface (Fig. 3.11). Absence of the Neutral coal may be due to nondeposition, erosion, or from overlying channel incision. A

24 91
25 92 comparable map of the Neutral coal in the Cherokee basin is not available (Lange, 2003). Neutral coal ash content for the Bourbon arch ranges from 10.6 to 22.1 %, averaging 15.6 % (Fig. 3.04). Sulfur is consistently 2.0 % based on four core samples (Fig. 3.05). Ash content in the Cherokee basin ranges from 17.3 to 38.3 %, with a mean of 27.5 % (Fig. 3.04; updated and modified from Lange, 2003). Sulfur content for the Neutral coal in the subsurface of the Cherokee basin is not available. Rowe Coal Similar to the Neutral, the Rowe coal exhibits a lenticular coal geometry oriented parallel to depositional strike (NW-SE; Fig. 3.12). Coal extent is estimated to be 3128 square miles (8102 sq. km). Coal continuity is estimated to be 747 square miles (340 sq. km), or 23.9 % of the extent (Table 3.1). Thickness of the Rowe coal in the Bourbon arch ranges from 0 to 2.7 feet (0 to 0.8 m), averaging 0.6 feet (0.2 m; Fig. 3.06). The Rowe has a positively skewed distribution; 79.3 % of the coal isopach is greater than the average thickness (Table 3.1). The Rowe coal appears to be more developed westward of the underlying Neutral coal. Consistently thicker coal trends occur in central Anderson, western Bourbon, western Miami, and northeastern Franklin counties. As with the Neutral coal, the Rowe coal tends to thicken on highs and thin into lows of Mississippian structure (Fig. 3.12). The Rowe coal in the Cherokee basin was not mapped in previous studies (Lange, 2003). Rowe coal ash content in the Bourbon arch ranges from 9.6 to 20.2 %, averaging 15.3 % (Fig. 3.04). Sulfur content data for the Rowe in the subsurface is

26 93
27 94 not available for the study area. Ash content in the Cherokee basin ranges from 10.0 to 80.7 %, with a mean of 35.4 % (Fig. 3.04; updated and modified from Lange, 2003). Sulfur content for the Cherokee basin ranges from 2.3 to 9.8 %, averaging 5.2 % (Fig. 3.05; updated and modified from Lange, 2003). Dry Wood Coal The Dry Wood coal exhibits a lenticular geometry oriented perpendicular (NE-SW) to depositional strike (NW-SE), but is more discontinuous (310 square miles [803 sq. km]) relative to underlying Bluejacket interval coals (Fig. 3.13; Table 3.1). The discontinuity (16.1 %) and extent (1925 square miles [4986 sq. km]) of the coal is the result of channel incision by the overlying upper or lower Bluejacket sandstones (Table 3.1). Coal thickness in the study area ranges from 0 to 2.4 feet (0 to 0.7 m); averaging 0.4 feet (0.1 m; Fig. 3.06). The Dry Wood has a positively skewed distribution; 79.3 % of the coal isopach is greater than the average thickness (Table 3.1). Where present, and as with the preceding Bluejacket interval coals, the Dry Wood tends to thicken on highs and thin into lows of Mississippian structure (Fig. 3.13). Thicker coal trends occur in western Bourbon, Miami, and central Franklin counties. The Dry Wood coal in the Cherokee basin was not mapped in previous studies (Lange, 2003). The Dry Wood coal has 16.2% ash, based on one coal cuttings sample from the Bourbon arch (Fig. 3.04). Sulfur data for the Rowe in the subsurface is unavailable for the study area. Ash content for the Dry Wood in the Cherokee basin

28 95
29 96 is 32.6 % and sulfur is 6.3 %, based on one core sample (Figs and 3.05, respectively; updated and modified from Lange, 2003) Weir-Pittsburg Interval The Weir-Pittsburg interval extends from the top of the underlying Bluejacket interval boundary to the top of the Weir-Pittsburg coal. When the Weir-Pittsburg coal is absent, the base of the overlying shale becomes the upper interval limit (Fig. 3.14). These boundaries are similar to Huffman s (1991) and Lange s (2003) Weir-Pittsburg interval boundaries. The Bluejacket interval includes, in ascending order, the Bjb shale, Abj coal, and the Weir-Pittsburg coal (Harris, 1984; Fig. 3.02). Interval thickness ranges from 8 to 60 feet (2.4 to 18.3 m), averaging 28 feet (8.5 m). Thin areas occur in Johnson, Miami, eastern Franklin, central Linn and Anderson counties, as well as southern Allen and southeastern Woodson counties. Thick areas occur in western Franklin, northern Anderson, western Linn, and Bourbon counties (Appendix B). Thin areas could be the result of incision into the Weir-Pittsburg interval from the overlying Tebo or Scammon intervals, or nondeposition. The Weir-Pittsburg coal pinches out in the eastern portion of the study area, making correlation of the interval difficult. Lange (2003) reported interval thicknesses in southeastern Kansas as ranging from 5 to 60 feet (1.5 to 18.2 m), averaging 20 feet (6.1 m). The Weir-Pittsburg interval encompasses 28 feet (8.5 m) of the Franklin County core (Appendix A). However, the Weir-Pittsburg coal is absent at this location. Lithofacies observed in the Franklin County core in ascending order are: bioturbated sandstone, pyritic black shale with minor interbedded heterolithic

30 97
31 98 sandstone, grading upwards into underclay facies (Fig. 3.14; Appendix A). The Weir-Pittsburg interval is 25 feet (7.6 m) in the Rose Hill #1-6 core (Miami County; Johnson, 2004). Lithofacies assigned to the interval in the Rose Hill #1-6 core in ascending order include: black shale sharply overlying the uppermost coal facies from the Bluejacket interval, heterolithic siltstone, underclay, heterolithic sandstone, black shale, and underclay facies. The Weir-Pittsburg coal is also missing in the Rose Hill #1-6 core, but the upper surface of the coal is interpreted to correlate within the underclay facies of the underlying the Tebo coal, based on a high gamma ray response ( API units; Johnson, 2004). Lithofacies from the Weir-Pittsburg interval in the Cherokee basin are, in ascending order: gray shale, heterolithic siltstone and heterolithic sandstone, underclay, and coal (Lange, 2003). Weir-Pittsburg Coal The Weir-Pittsburg coal exhibits a lenticular coal seam geometry. Orientation of the coal seam is interpreted to parallel depositional dip (southwest; Fig. 3.15; Table 3.1). Regional depositional orientation is based on the NE-SW-trending sandstone channels of the Bronson-Xenia field in Allen County (Walton, 1996). The SWtrending fluvial channel closely underlies the Weir-Pittsburg coal and is inferred to trend perpendicular to regional depositional strike. The Weir-Pittsburg coal is extensive over an estimated 3327 square miles and continuous over 1201 square miles (8617 and 3111 sq. km [36.1 %], respectively; Table 3.1). Coal thickness in the Bourbon arch ranges from 0 to 3.5 feet (0 to 1.1 m), averaging 0.8 feet (0.2 m; Fig. 3.06). The Weir-Pittsburg has a symmetric distribution, with 51.7 % of the coal

32 99
33 100 isopach greater than the average thickness (Table 3.1). Trends of thick Weir- Pittsburg coal occur in the western portion of the study area (Woodson, western Franklin, and Anderson counties). The coal pinches out eastward into Johnson, Miami, Linn, and Bourbon counties. No distinct relationship is exists when the Weir- Pittsburg coal isopach is superimposed on the coal s basal structural contours; thicker coal isopach values are associated with localized structural highs and lows throughout the area. On a regional scale, the Weir-Pittsburg coal is thicker in the western portion of the study area and pinches out to the east and northeast (Miami, Linn, and Bourbon counties). The coal isopach generally parallels underlying structure contours across the Bourbon arch (Fig. 3.15). In addition to non-deposition, the absence of coal may also be due to channel incision from the overlying Chelsea sandstone of the Scammon interval. Lange (2003) described the Weir-Pittsburg coal as having a northwesttrending, lenticular geometry paralleling the strike of Mississippian structure in the Cherokee basin. However, coal thickness is much greater in the Cherokee basin, ranging from 0 to 6 feet (0 to 1.8 m), and averaging 1.5 feet (0.5 m; Fig. 3.06; Lange, 2003). Ash content in the Bourbon arch is calculated to be 18.2 % (Fig. 3.04) based on one coal cuttings sample. Sulfur content for the Weir-Pittsburg in the subsurface is not available within the study area. Ash content in the Cherokee basin ranges from 4.9 to 49.5, averaging 15.4 % (Fig. 3.04; updated and modified from Lange, 2003). Sulfur content in the Cherokee basin is 4.6 %, based on one core sample (Fig. 3.05; updated and modified from Lange, 2003).
34 Tebo Interval The Tebo interval extends from the top of the Weir-Pittsburg coal or base of the overlying black shale, to the top of the Tebo coal or base of the overlying black shale (Fig. 3.14). These boundaries correspond to those of Huffman (1991) and are similar to those of Lange (2003). The Tebo interval includes the black shale above the Weir-Pittsburg coal and Tebo coal (Fig. 3.02). Thickness ranges from 0 to 40 feet (0 to 12.2 m), averaging 10 feet (3.0 m). Thin areas occur in Bourbon County, whereas thicker areas are found in southern Woodson and Allen counties. Overall, there is a marked trend of thickening from the northeast to the southwest, suggesting a regional NW-SE-oriented paleoshoreline (Appendix B). Thin areas are due to incision of the overlying Chelsea sandstone of the Scammon interval, or from subaerial exposure and erosion within the Tebo interval itself. Lange (2003) reported a similar, but thicker, Tebo interval in the Cherokee basin, ranging from 6 to 50 feet (1.8 to 15.6 m) and averaging 25 feet (7.7 m). In the Franklin County core, the Tebo interval is 6 feet (1.8 m) thick. Lithofacies assigned to the Tebo interval in the Franklin County core in ascending order include: pedogenically-altered black shale, underclay, and coal facies (Fig. 3.14; Appendix A). The 5 feet (1.5 m) of Tebo interval in the Rose Hill #1-6 core includes underclay facies followed by a coal facies. The underclay facies at this location is interpreted as a composite soil horizon compounded with the underclay associated with the underlying (and absent) Weir-Pittsburg coal (Johnson, 2004). Lithofacies reported by Lange (2003) south of the study area include black shale
35 102 passing directly into gray shale, heterolithic siltstones and heterolithic sandstone, followed by an poorly developed underclay facies, and capped by the coal facies. Tebo Coal The Tebo coal exhibits lenticular coal seam geometry oriented roughly parallel to regional depositional strike (NW-SE; Fig. 3.16). Coal extent is estimated to be 3841 square miles (9948 sq. km) while continuity is 1526 square miles (3952 sq. km [39.7 %]; Table 3.1). The Tebo coal is more continuous and better developed over and eastward of the underlying Weir-Pittsburg coal. The Tebo pinches out in the far eastward portion of the study area (southeastern Linn and Bourbon counties). Coal thickness across the Bourbon arch ranges from 0 to 2.8 feet (0 to 0.9 m), averaging 0.8 feet (0.3 m; Fig. 3.06). The Tebo coal has a symmetric distribution; 62.7 % of the coal isopach is greater than the average thickness (Table 3.1). Consistently thicker coal trends occur in Anderson, Franklin, northern Miami, and southern Johnson counties. As with the Weir-Pittsburg coal, absence of the Tebo is due to either non-deposition or overlying channel incision. No correlation is evident when the Tebo coal isopach map is superimposed with the structure contour map of the base of the coal (Fig. 3.16). The Tebo coal in the Cherokee basin has an elongate geometry oriented oblique to depositional strike and dip, and thickens on basal Tebo structural highs and thins into structural lows (Lange, 2003). Lange (2003) reported the thickness of the Tebo coal in the Cherokee basin ranging from 0 to 3 feet (0 to 0.9 m) and averaging 0.9 feet (0.3 m Fig. 3.06).

36 103
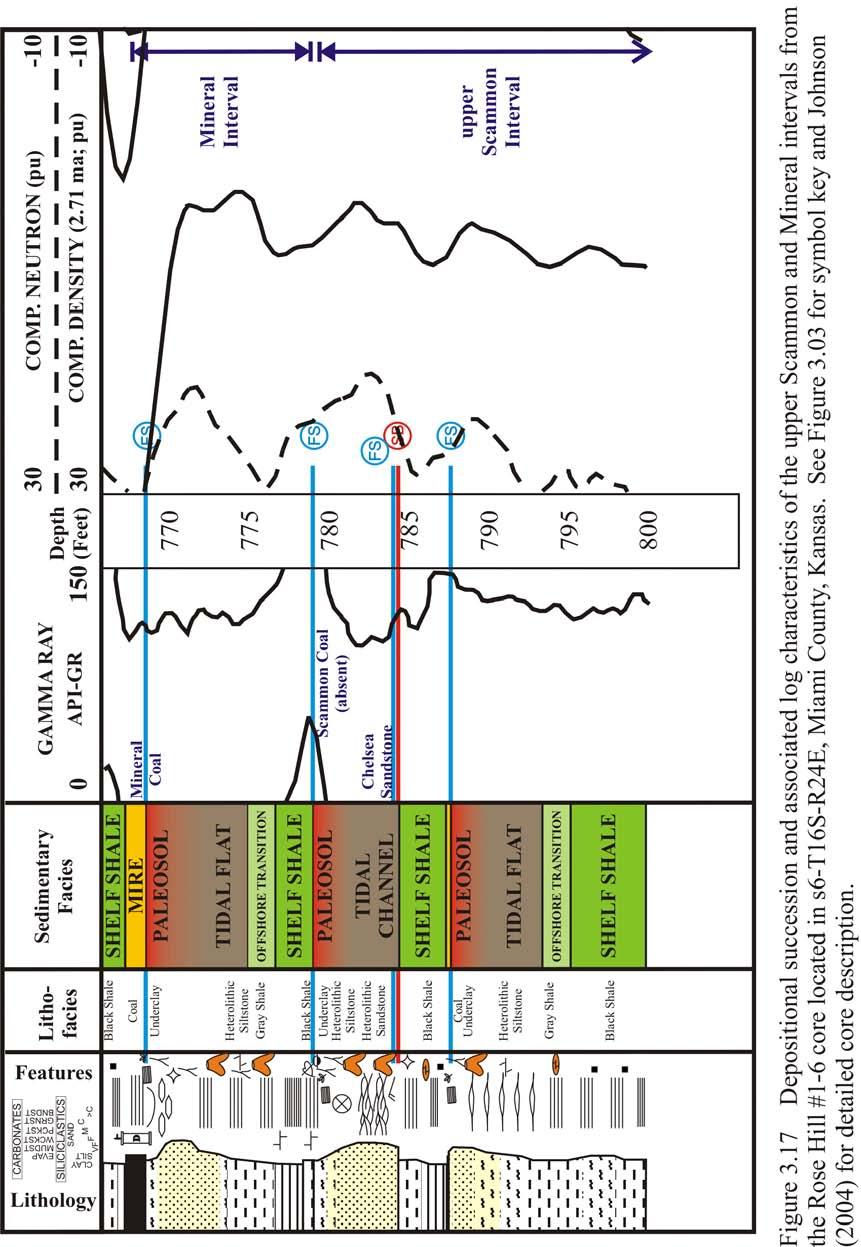
37 104 Ash content in the Bourbon arch ranges from 11.6 to 23.1 %, averaging 15.7 % (Fig. 3.04). Sulfur content in the study area ranges from 3.2 to 8.7 %, averaging 5.9 % (Fig. 3.05). Ash and sulfur contents were calculated at 64.7 % and 1.4 %, respectively from one core sample in the Cherokee basin (Figs and 3.05, respectively; updated and modified from Lange, 2003) Scammon Interval The Scammon interval extends from the top of the Tebo coal or base of the overlying Tebo shale, to the top of the Scammon coal, or base of the overlying shale (Fig. 3.17). These interval boundaries are consistent with those of the Scammon interval of Huffman (1991) and similar to those of Lange (2003). The Scammon interval includes the black shale overlying the Tebo coal, the overlying Chelsea Sandstone, and Scammon B and Scammon coal beds (Harris, 1984; Fig. 3.02). The base of the Chelsea Sandstone, or its interfluve-equivalent, is considered a regional unconformity. In the Savonburg NE field of Allen County, the tide-influenced estuarine valley fill of the Chelsea Sandstone trends NE-SW (Walton, 1996). Orientation of the Chelsea Sandstone (NE-SW) is interpreted to be perpendicular to regional depositional strike (NW-SE). Thickness of the Scammon interval ranges from 9 to 80 feet (2.7 to 24.4 m) and averages 32 feet (9.8 m). Thicker areas are sporadic, and occur in northern Woodson and Allen, southeastern Anderson, and southern Bourbon counties (Appendix B). Thicker intervals are due to incision into underlying intervals and thick deposits of the Chelsea Sandstone. Lange (2003)
38 105
39 106 reported similar thickness of 8 to 80 feet (2.4 to 24.4 m), averaging 38 feet (11.6 m) in southeastern Kansas. Lithofacies observed in 32 feet (9.8 m) of the Rose Hill #1-6 core in ascending order are: pyritic black shale, gray shale, heterolithic siltstone, heterolithic sandstone, underclay, and unidentified and uncorrelated thin coal. Black shale overlies these facies, and becomes increasingly pedogenically altered upwards into underclay. The black shale and underclay facies are, in turn, capped by a fining upwards succession of heterolithic sandstone, heterolithic siltstone, and another underclay (Fig. 3.17). The Scammon coal is absent in the Rose Hill #1-6 core (Johnson, 2004). The Scammon interval encompasses 22 feet (6.7 m) of the Franklin County core. Lithofacies at this location in ascending order are: black shale (Tebo shale), gray shale, heterolithic siltstone, heterolithic sandstone, and underclay (Appendix A). Facies observed in the Cherokee basin are similar to those observed in the Franklin County core (Lange, 2003). Scammon Coal The Scammon coal exhibits an elongate seam geometry that is generally oriented parallel to depositional dip (southwest; Fig. 3.18). Coal extent is estimated to be 3780 square miles (9790 square km). Coal continuity is estimated to be 1307 square miles (3385 sq. km), or 34.6 % of the extent (Table 3.1). Coal thickness in the Bourbon arch ranges from 0 to 3.3 feet (0 to 1.0 m); averaging 0.8 feet (0.3 m; Fig. 3.06). The Scammon exhibits a symmetric distribution, with 54.5 % of the coal isopach greater than the average thickness (Table 3.1). The low continuity of the

40 107
41 108 Scammon is attributed to proximity to active sedimentation of the Chelsea Sandstone. The depositional orientation of the Scammon coal is similar to the Warner and Bluejacket intervals. Consistently thicker coal trends occur in northern Allen, central Anderson, northern Miami, and southern Johnson counties. Comparison to the structure of the underlying Chelsea Sandstone shows little relation; the Scammon coal thickens over both structural highs and lows (Fig. 3.18). Lange (2003) described the Scammon coal in the Cherokee basin as having an irregular geometry oriented oblique to depositional strike and dip. Thickness in the Cherokee basin ranges from 0 to 3 feet (0 to 0.9 m) and averages 1.0 foot (0.3 m; Fig. 3.06; Lange, 2003). The Scammon coal thickened on Chelsea Sandstone structural highs and thinned in structural lows (Lange, 2003). Ash content for the Scammon coal in the Bourbon arch is calculated at 13.6 % based on analysis of one core (Fig. 3.04). Sulfur content for the Scammon in the subsurface is not available within the study limits. Ash and sulfur contents for the Cherokee basin are 32.7 % and 5.9 %, respectively (Figs and 3.05; updated and modified from Lange, 2003) Mineral Interval The Mineral interval extends from the top of the Scammon coal or base of the overlying black shale, to the top of the Mineral coal or overlying black shale (Fig. 3.17; 3.02). These boundaries are consistent to those in Huffman (1991) and similar to those of Lange (2003). Thickness throughout the Bourbon arch study area ranges from 6 to 42 feet (1.8 to 12.8 m), averaging 15 feet (4.6 m). Thickness is relatively
42 109 consistent, with sporadic thicker intervals occurring in southern and western Franklin County as well as in southern Woodson County (Appendix B). Lange (2003) reported thickness in the Cherokee basin ranging from 10 to 40 feet (3.0 to 12.2 m) with 19 (5.8 m) feet being most common. The Mineral interval encompasses 11 feet (3.4 m) of the Rose Hill #1-6 core in Miami County. Lithofacies assigned to this interval in ascending order are: black shale, heterolithic siltstone, underclay, and coal (Fig. 3.17; Johnson, 2004). In the Franklin County core, the Mineral interval is 16 feet (4.9 m) thick. Lithofacies include two shoaling upward successions. The first succession consists of black shale overlying the Scammon coal, grading up into dark mudstone-limestone facies, and then into underclay. A second black shale, followed by gray shale, underclay, and coal facies subsequently overlie the underclay facies (Appendix A). Lithofacies in the Mineral interval of the Cherokee basin in ascending order include: black shale, gray shale, heterolithic siltstone, heterolithic sandstone, underclay, and coal (Lange, 2003). Mineral Coal The Mineral coal exhibits a slightly lenticular geometry oriented parallel to depositional strike (NW-SE; Fig. 3.19; Table 3.1). Regional depositional orientation is approximated from the orientation of the underlying Scammon interval (depositional dip to the SW), and the southwest-trending upper Skinner sandstone of the McCune West Field, just south of the study area (Walton, 1996). The upper
43 110
44 111 Skinner sandstone is stratigraphically positioned between the Mineral and Croweburg coals (Walton, 1996). The Mineral coal is more continuous (2166 square miles [5610 sq. km; 53.5 % of extent]) and better developed than the underlying Scammon coal, extending 4064 square miles (10,526 sq. km) across the study area (Table 3.1). Coal thickness in the Bourbon arch ranges from 0 to 3.7 feet (0 to 1.1 m); averaging 1.0 feet (0.3 m; Fig. 3.06). The Mineral has a symmetric distribution; 53.5 % of the coal isopach is greater than the average coal thickness (Table 3.1). Consistently thicker coal trends occur in Allen, Anderson, northwestern Linn, southern Franklin, northern Miami, and Johnson counties. The Mineral coal isopach was superimposed on the structure contour map of the base of the coal. The Mineral coal shows localized thickening on the basal structural highs and thinning into structural lows (Fig. 3.19). Absence of the Mineral is most likely due to non-deposition, but overlying channel incision and erosion associated with an overlying unconformity could be a factor. The Mineral coal in the Cherokee basin was described as having a lenticular geometry oriented parallel to depositional strike (Lange, 2003). In the Cherokee basin, the Mineral coal ranges in thickness from 0 to 4 feet (0 to 1.2 m), averaging 1.4 feet (0.4 m; Fig. 3.06). Mapping showed that the coal thickens on basal Mineral structural highs and thins into structural lows in the Cherokee basin (Lange, 2003). Ash content of the Mineral coal across the Bourbon arch ranges from 12.2 to 54.9 %, averaging 31.3 % (Fig. 3.04). Sulfur content ranges from 2.0 to 4.8 %, averaging 2.4 % (Fig. 3.05) within the study area. Ash content in the Cherokee basin
45 112 ranges from 10.4 to 36.8 %, averaging 20.1 (Figs. 3.04; updated and modified from Lange, 2003). Sulfur content data for the subsurface is not available from the Cherokee basin Croweburg Interval The Croweburg interval extends from the top of the Mineral coal or base of the overlying shale, to the top of the Croweburg coal. The base of the overlying black V Shale becomes the upper boundary when the Croweburg is absent (Fig. 3.20; Angino, et al., 1981). Boundaries are consistent with Huffman (1991) and similar to the V Shale interval of Lange (2003). The Croweburg interval includes, in ascending order, the black shale overlying the Mineral coal, the discontinuous Fleming coal, and the Croweburg coal (Fig. 3.02). Although the Fleming is regionally mappable in southeastern Kansas (Lange, 2003), it occurs only locally in eastern counties of the Bourbon arch study area. The Fleming coal was not mapped across the Bourbon arch. A regional unconformity is interpreted to occur between the Fleming and Croweburg coals. This unconformity is recognizable in core as either a well-developed underclay facies or as the base of a thick sandstone underlying the Croweburg coal (section 3.2.7; Walton, 1996). Regional depositional dip for the Croweburg interval is interpreted to trend toward the southwest based on the trend of the thick underlying sandstone. Thickness of the Croweburg interval in the study area ranges from 10 to 45 feet (3.0 to 13.7 m), and averages 26 feet (7.9 m). Thin areas occur in Bourbon, northern Allen, and southern Linn counties. Thicker areas occur in Woodson,

46 113
47 114 southeastern Allen, northern Franklin, northern Linn, and Miami counties (Appendix B). Observed interval thicknesses in southeastern Kansas range from 20 to 70 feet (6.1 to 21.9 m), with 40 feet (12.2 m) being most common (Lange, 2003). The Croweburg interval encompasses 32 feet (9.8 m) of the Rose Hill #1-6 core. Lithofacies of the Croweburg interval at this location in ascending order include: black shale grading into a sandy underclay, coal (Fleming?), black shale, thick underclay, another black shale, heterolithic siltstone, heterolithic sandstone, underclay, and coal (Croweburg). This succession is partially illustrated in Figure 3.20 (Johnson, 2004). Lithofacies observed in 24 feet (7.3 m) of the Franklin County core in ascending order include: black shale, heterolithic siltstone, sandy underclay, and coal facies (Croweburg; Appendix A). Lithofacies observed by Lange (2003) in the Cherokee basin in ascending order include: phosphatic black shale overlain by gray shale, heterolithic siltstone, heterolithic sandstone, underclay, coal (Fleming coal), black shale, gray shale, underclay, and another coal (Croweburg). Croweburg Coal The Croweburg coal exhibits an elongate to slightly lenticular coal seam geometry oriented parallel to depositional dip (southwest; Fig. 3.21). Coal extent is estimated to be 4067 square miles (10,534 sq. km). Coal continuity is estimated to be 52.8 % of extent, or 2146 square miles (5558 sq. km; Table 3.1). Thickness of the Croweburg in the Bourbon arch ranges from 0 to 3.8 feet (0 to 1.2 m), averaging 1.0 foot (0.3 m; Fig. 3.06). The Croweburg has a symmetric distribution, with 52.8 % of the coal isopach being greater than the average thickness (Table 3.1). Trends of
48 115
49 116 consistently thick coal occur throughout the study area, specifically in Bourbon, western Linn, eastern Miami, Woodson, and southern Franklin, counties. A general correlation between thick Croweburg coal and high Croweburg basal structure contours and thin Croweburg coal and low structure contours is discernible (Fig. 3.21). The absence of coal is due to channel incision from overlying Squirrel sandstones of the Bevier and Mulky intervals (Fig. 3.02). Lange (2003) described the Croweburg coal in the Cherokee basin as having a similar lenticular geometry. Thickness was reported to range from 0 to 3 feet (0 to 0.9 m), averaging 1.0 foot (0.3 m; Fig. 3.06) in the Cherokee basin (Lange, 2003). Mapping revealed that the coal thickens on structural highs and thins into structural lows in southeastern Kansas (Lange, 2003). Ash content in the study area ranges from 6.6 to 73.0 %, averaging 32.7 % (Fig. 3.04). Sulfur content in the study area is 2.9 %, based on one core sample (Fig. 3.05). Ash content in the Cherokee basin ranges from 11.1 to 27.7 %, with a mean of 18.6 % (Fig. 3.04; updated and modified from Lange, 2003). Sulfur content in the Cherokee basin is 3.1 % based on one core sample (Fig. 3.05; updated and modified from Lange, 2003) Bevier Interval The Bevier interval extends from the top of the Croweburg coal or base of the V Shale, to the top of the Bevier coal or base of the overlying shale (Fig. 3.20). The Bevier interval corresponds to that of Huffman (1991) and is similar to that of Lange (2003). The Bevier interval includes the laterally continuous V Shale, Verdigris
50 117 Limestone, and Bevier coal (Fig. 3.02). Bevier interval thickness ranges from 6 to 38 feet (1.8 to 11.6 m) with 20 feet (6.1 m) being most common. Thickest areas are located in Bourbon, southeastern Linn, and southeastern Allen counties (Appendix B). In the Cherokee basin, Bevier interval thickness ranged from 5 to 24 feet (1.5 to 7.3 m), and averaged 14 feet (4.3 m). Lange (2003) interpreted a regional unconformity within the Bevier interval. However, across the Bourbon arch, a regional unconformity was not observed in the Bevier interval. The Bevier interval encompasses 16 feet (4.9 m) of the Rose Hill #1-6 core and 13 feet (4.0 m) of the Franklin County core (Appendix A; Johnson, 2004). Lithofacies successions in the Bevier interval from both cores are similar. In ascending order lithofacies include: phosphatic black shale, mudstone-wackestone, gray shale, underclay, and coal (Fig. 3.20; Appendix A; Johnson, 2004). Lithofacies in the Cherokee basin are similar to those described in cores from the Bourbon arch with the addition of a heterolithic sandstone succession in the Cherokee basin. Lithofacies reported from southeastern Kansas include: phosphatic black shale, mudstone-wackestone, gray shale, heterolithic siltstone, heterolithic sandstone, underclay, and coal (Lange, 2003). Bevier Coal The Bevier coal has a NE-SW-trending, lenticular to slightly elongate coal seam geometry that extends over nearly all of the study area (4246 square miles [10,997 sq. km]; Fig. 3.22). The Bevier is one of the more continuous coals across the Bourbon arch, with an estimated continuity of 3987 square miles (10,326 sq. km),

51 118
52 119 or 93.9 % of the extent. Seam orientation of the Bevier trends NE-SW, however, relation to depositional orientation is indeterminate (Table 3.1). Coal thickness in the Bourbon arch ranges from 0 to 3.7 feet (0 to 1.1 m); averaging 1.5 feet (0.5 m; Fig. 3.06). The Bevier has a symmetric coal distribution; 57.0 % of the coal isopach is greater than the average thickness (Table 3.1). Thicker trends of the Bevier coal occur in Franklin, Allen, Anderson, and Linn counties. When superimposed on the basal Bevier coal structure contours, the coal exhibits thickening on regional structural highs and thinning on regional structural lows. Patterns of isopach thins and absences are due to minor incision from channels of the overlying Squirrel Sandstone (Fig. 3.22). Lange (2003) described the Bevier coal in southeastern Kansas as having a lenticular geometry similarly trending parallel to depositional dip. Thickness was reported to range from 0 to 4.5 feet (0 to 1.4 m), averaging 1.5 feet (0.5 m; Fig. 3.06) in the Cherokee basin. Lange (2003) concluded that the coal tended to thin into its own basal structural lows and thicken on structural highs. Ash content in the Bourbon arch ranges from 21.2 to 33.2 %, averaging 26.9 % (Fig. 3.04), and sulfur values range from 1.9 to 5.6 %, averaging 3.8 % (Fig. 3.05). Ash content in the Cherokee basin ranges from 20.9 to 31.7 %, averaging 25.3 % (Fig. 3.04; updated and modified from Lange, 2003). Sulfur content values are not available for the subsurface Bevier coal in the Cherokee basin study area.
53 Mulky Interval The Mulky interval extends from the top of the Bevier interval to the top of the Mulky coal, or base of the overlying Excello Shale (Figs. 3.23; 3.02). In southeastern Kansas, the Iron Post coal is in the Mulky interval (Lange, 2003), but is absent in the Bourbon arch study area. The upper boundary of the Mulky interval is interpreted as a regional depositional uncomformity. The Mulky interval boundaries are equivalent to Huffman (1991) and to Lange s Excello interval (Lange, 2003). Within the Bourbon arch study area, thickness of the Mulky interval ranges from 48 to 109 feet (14.6 to 33.2 m), averaging 81 feet (24.7 m). Thicker areas include most of Woodson, Bourbon, Franklin, and Johnson counties, as well as eastern Linn and northwestern Miami counties (Appendix B). Thickness of the Mulky interval in the Cherokee basin is slightly less, ranging from 25 to 130 feet (7.6 to 39.6 m) and averaging 63 feet (19.2 m; Lange, 2003). The Mulky interval encompasses 85 feet (25.9 m) of the Rose Hill #1-6 core. Lithofacies include four coarsening-upward successions. The first succession in ascending order consists of: pyritic black shale, gray shale, heterolithic siltstone, and heterolithic sandstone facies. The second consists of gray shale, interbedded heterolithic siltstone and heterolithic sandstone, and bioturbated sandstone facies. The third consists of pyritic and fossiliferous black shale. The fourth consists of pyritic black shale, gray shale, pedogenically altered heterolithic siltstone, underclay, and coal facies (Fig. 3.23; Johnson, 2004). Lithofacies in the 102 feet (31.1 m) of the Franklin County core form three coarsening-upward successions. The first

54 121
55 122 succession in ascending order includes pyritic and fossiliferous black shale, gray shale, fossiliferous black shale, and bioturbated sandstone facies. The second consists of gray shale, heterolithic siltstone, and bioturbated sandstone facies. The third coarsening-upward succession includes fossiliferous black shale, grading up into interbedded sandstone and siltstone, and underclay facies (Appendix A). The Mulky coal is in the Franklin County core. The Mulky interval in the Cherokee basin consists of only two successions: gray shale, underclay, and coal (Iron Post); and gray shale, black shale, wackestone and packstone, and coal facies (Mulky; Lange, 2003). The Mulky of the Cherokee basin overlies a limestone (Breezy Hill Limestone), which is not present in the Bourbon arch. Mulky Coal The Mulky coal exhibits a discontinuous, circular and pod-like seam geometry trending NW-SE (Fig. 3.24). The coal extends an estimated 4133 square miles (10,704 sq. km). Estimated continuity is than 2334 square miles (6045 sq. km), or 56.5 % of extent. The relation of coal seam orientation to depositional orientation is inconclusive (Table 3.1). Coal thickness in the Bourbon arch ranges from 0 to 2.8 feet (0 to 0.9 m); averaging 1.0 feet (0.3 m; Fig. 3.06). The Mulky exhibits a symmetric coal distribution, with 56.5 % of the coal isopach greater than the average thickness (Table 3.1). Relatively thicker Mulky coal areas occur in nearly every county except Bourbon. Superimposing the Mulky coal isopach contours with Mulky coal basal structural contours illustrates two key relationships: 1) the Mulky appears to be more developed on localized structural highs and thinner in structural lows, and
56 123
57 124 2) NW-SE linear trends of thicker coal occur over and follow regional structural highs. The Mulky pinches out to the southeast in Bourbon County. Southeastward pinchout coincides with thicker underlying deposits of the Mulky interval (Fig. 3.24; Appendix B). Development of the Mulky coal may be partly influenced by tectonic adjustments across the Bourbon arch and Forest City basin. Thick NW-SE isopach trends of the Mulky coal correlate to steep gravity and magnetic gradients oriented NW-SE and SW-NE across the study area (Fig. 3.24; Kansas Geological Survey, 2004). Mulky interval isopach thins (i.e. central Miami County) also correlate to gravity and magnetic gradient trends (Appendix B). Changes in gravity and magnetism are attributed to basement fault displacement. This displacement decreases up section from the Precambrian basement through the Pennsylvanian, suggesting syndepositional tectonic activity. Localized fault movement was in response to episodic activity in the Ouachita orogenic belt to the south. Minor fault movements affected Desmoinesian clastic sedimentation patterns in eastern Kansas (Merriam and Forster, 2002; Merriam, in press 2004), potentially including development of the Mulky coal. The Mulky coal in the Cherokee basin was described as having an irregular to circular geometry oriented both parallel to depositional strike and dip (Lange, 2003). Coal thickness in the Cherokee basin ranges from 0 to 2.5 feet (0 to 0.8 m); averaging 0.8 feet (0.2 m; Fig. 3.06), and the coal was found to thicken on basal Mulky structural highs and thin into structural lows (Lange, 2003).
58 125 Ash content in the Bourbon arch ranges from 15.4 to 34.8 %, averaging 22.2 % (Fig. 3.04). Sulfur values are 4.5 %, based on one core sample from the study area (Fig. 3.05). Ash content in the Cherokee basin ranges from 22.5 to 45.2 %, averaging 30.7 % (Fig. 3.04; updated and modified from Lange, 2003). Sulfur of the Mulky coal in the Cherokee basin is 11.9 %, based on one core sample (Fig. 3.05; updated and modified from Lange, 2003) Summit Interval The Summit interval extends from the top of the Mulky coal or base of the Excello Shale, to the top of the Summit coal or base of the Little Osage Shale (Fig. 3.23). These boundaries correspond to the Summit interval of Huffman (1991) and Lange s (2003) Little Osage interval. In localized areas where the lower portions of the Summit interval are absent, the base of the Blackjack Creek Limestone is the lower boundary. The Summit interval consists of, in ascending order: the Excello Shale, the Blackjack Creek Limestone, and the Summit coal (Fig. 3.02). Interval thickness ranges from 0 to 29 feet (0 to 8.8 m), with 12 feet (3.7 m) being most common. Thicker areas occur in a crescent-shaped swath from eastern Miami and northwestern Linn, to northern Anderson and southern Franklin counties, and is attributed to carbonate buildup or infilling by the Blackjack Creek Limestone (Appendix B). The Summit interval in the Cherokee basin is thicker, ranging from 10 to 45 feet (3.0 to 13.7 m), averaging 20 feet (6.1 m; Lange, 2003). The Summit coal was not encountered in either the Rose Hill #1-6 or Franklin County cores. Lithofacies observed in the Summit interval (16 feet; 4.9 m) of the
59 126 Rose Hill #1-6 core in ascending order include: phosphatic black shale, mudstonewackestone, gray shale, mudstone-wackestone, and underclay (Fig. 3.23; Johnson, 2004). In the Franklin County core, black shale and coal lithofacies are absent and only carbonate facies are present. Limestone lithofacies in the Franklin County core in ascending order include: wackestone, Chaetetid boundstone, and coarse-grained packstone-grainstone. The total thickness of the Summit interval in the Franklin County core is 4 feet (1.2 m; Appendix A). In the Franklin County core, the upper limit of the Summit interval is defined based on a radioactive (~170 API units) response directly above the packstone-grainstone facies. Lithofacies observed in the Cherokee basin in ascending order include: phosphatic black shale, wackestone, packstone-grainstone, and carbonaceous shale (coal; Lange, 2003). Summit Coal The Summit coal exhibits a circular, pod-like coal seam geometry oriented NW-SE (Fig. 3.25). The relation of seam orientation to depositional orientation is inconclusive. Estimated seam extent of 4071 square miles (10,543 sq. km) is less than that of the Mulky coal. Coal seam continuity is also less than that of the Mulky coal (1511 sq. miles [3913sq. km]), and approximately 37.1 % of seam extent (Table 3.1). Thickness in the Bourbon arch ranges from 0 to 3.2 feet (0 to 1.0 m), with a mean of 0.8 feet (0.2 m; Fig. 3.06). The Summit has a symmetric coal distribution; 57.3 % of the coal isopach is greater than the average coal thickness (Table 3.1). Thicker areas of the Summit occur in localized parts of Allen, Anderson, northern Linn, Miami, and Franklin counties (Fig. 3.25).

60 127
61 128 Relationships to underlying strata vary across the study area. The coal isopach exhibits thinning into structural lows and thickening over structural highs in the southern portion of the area when superimposed on the structure contours of the underlying Blackjack Creek Limestone (Fig. 3.25). In contrast, thicker coal is associated with underlying structural lows, while structural highs exhibit thinning of the Summit coal in the northern portion of the study area (Fig. 3.25). When the Summit coal isopach is compared to the Summit interval isopach, a distinct trend of thick coal coincides with thicker areas of the Summit interval (Fig. 3.25; Appendix B). This thick Summit interval trend, in turn coincides with Blackjack Creek Limestone structural lows, suggesting that both the Blackjack Creek and Summit coal were better developed in underlying paleotopographic lows in the northern part of the study area. Similar to the Mulky coal, development of the Summit coal may have been partly controlled by minor syndepositional fault block movements. NW-SEtrending Summit coal isopach distributions are comparable to the Mulky coal (Figs and 3.25). Distribution patterns of the Summit coal and Summit interval correlate to trends in gravity and magnetic gradients (Fig. 3.25; Appendix B; Kansas Geological Survey, 2004). Lange (2003) described the Summit coal in the Cherokee basin as having an irregular, circular geometry trending parallel to both depositional strike and dip. Coal thickness in the Cherokee basin was reported to range from 0 to 2.8 feet (0 to 0.9 m) averaging 1.0 foot (0.3 m; Fig. 3.06; Lange, 2003). Lange (2003) concluded
62 129 that the coal tended to thin in the underlying limestone structure lows and thicken on the highs. Ash content is 74.1 %, based on one coal cuttings sample from the study area (Fig. 3.04), whereas sulfur content data is not available. Ash content in the Cherokee basin ranges from 80.7 to 88.8 %, averaging 83.7 % (Fig. 3.04; updated and modified from Lange, 2003). Sulfur content analysis is also not available for the Cherokee basin Lexington Interval The Lexington interval extends from the upper limit of the Summit interval to the top of the Lexington coal or base of the overlying Anna Shale (Fig. 3.26). The Lexington interval includes the Little Osage Shale, Higginsville Limestone, and Englevale ( Peru ) Sandstone and Lexington coal of the Labette Shale (Fig. 3.02). A regional discomformity is interpreted to exist at the base of the sandstone. Interval thickness ranges from 11 to 84 feet (3.4 to 25.6 m), averaging 47 feet (14.3 m). Thickest areas occur in southeastern Bourbon County, thinning to the west and north (Appendix B). Thick areas of the Lexington interval are attributed to development of thick Ft. Scott Limestone, which trends southwestward through Miami, northwestern Linn, Anderson, and northern Allen and Woodson counties; or deposition of thicker overlying sandstone. The Englevale ( Peru ) Sandstone is thickest in Bourbon County and thins northwestward where it onlaps thicker portions of the Ft. Scott Limestone (Appendix B).

63 130
64 131 In Miami County, the Lexington interval encompasses 43 feet (13.1 m) of the Rose Hill #1-6 core. Lithofacies observed in this interval in ascending order are: fossiliferous and pyritic black shale, gray shale, mudstone-wackestone interbedded with minor packstone and grainstone, underclay, fossiliferous black shale, heterolithic siltstone, heterolithic sandstone, underclay, and coal (Fig. 3.26; Johnson, 2004). Lithofacies of the 13 feet (4.0 m) of the Franklin County core in ascending order include: wackestone-packstone, pyritic black shale, heterolithic siltstone, and fossiliferous black shale (Appendix A). Lexington Coal The Lexington coal pinches out towards the southwest and is absent across most of the study area. The Lexington exhibits a lenticular to pod-like coal geometry oriented NW-SE (Fig. 3.27). The relation of seam orientation to depositional orientation is indeterminate. Estimated extent of the Lexington is 1151 square miles (2981 sq. km), mainly due to the isolation of the coal to the northernmost portions of the study area. Coal continuity is estimated to be 232 square miles (601 sq. km), or 20.1 % of coal extent (Table 3.1). The thickness of the Lexington coal in the Bourbon arch ranges from 0 to 2.5 feet (0 to 0.8 m), averaging 0.4 feet (0.1 m; Fig. 3.06). The Lexington exhibits a positively skewed distribution, with 84.2 % of the isopach greater than the average coal thickness (Table 3.1). Thicker areas of the Lexington coal occur in the northern portion of the study area (Franklin, Miami, and southern Johnson counties). The coal exhibits thickening on structural highs and

65 132
66 133 thinning into structural lows when superimposed on the structure contours of the underlying Ft. Scott Formation (Fig. 3.27). The Lexington coal isopach trends and distributions are similar to the Mulky and Summit coals, which correspond well to gravity and magnetic gradient trends in the study area. Coal isopach trends and distributions suggest possible tectonic influence of coal development (Figs. 3.23, 3.25, and 3.27; Kansas Geological Survey, 2004). The Lexington coal was not described in the Cherokee basin study of Lange (2003), but the coal has been encountered during gas desorption sample collection in southeastern Kansas (K.D. Newell, personal communication, 2004). Ash content of the Lexington coal in the Bourbon arch ranges from 9.6 to 65.7 %, with a mean of 35.9 % (Fig. 3.04). Sulfur content is consistently 3.4 %, based on analysis from two cores within the study area (Fig. 3.05). Ash content in the Cherokee basin, as calculated from one core in the region, is 18.9 % (Fig. 3.04; updated from Lange, 2003). Sulfur data is not available for the Cherokee basin Mulberry Interval The Mulberry interval extends from the upper boundary of the Lexington interval to the top of the Mulberry coal, or base of the overlying shale or limestone (Fig. 3.28). The interval includes, in ascending order: the Anna Shale; Myrick Station Limestone, Mine Creek Shale, and Laberdie Limestone of the Pawnee Limestone; and Mulberry coal of the Bandera Shale (Fig. 3.02). The interval ranges from 21 to 57 feet (6.4 to 17.4 m) thick, and averages 35 feet (10.7 m). Thick areas

67 134
68 135 occur in southern Bourbon and Linn counties and are attributed to development of thick Laberdie Limestone (Appendix B). In ascending order, lithofacies interpreted from the Mulberry interval (29 feet; 8.8 m) in the Franklin County core include: phosphatic black shale, mudstonewackestone, pyritic black shale, gray shale, underclay, heterolithic sandstone, packstone, mudstone-wackestone, packstone, underclay, and coal (Fig. 3.28). In the Franklin County core, facies overlying the Mulberry interval include gray shale, heterolithic siltstone and sandstone grading upward into underclay within a 40-foot (12.2 m) interval beneath the Amoret Limestone Member of the Altamont Limestone (Appendix A). Lithofacies in 36 feet (11.0 m) of the Rose Hill #1-6 core in ascending order include: phosphatic black shale, mudstone-packstone, black shale, gray shale, heterolithic sandstone, mudstone-wackestone, and underclay. The Mulberry coal is absent. The Amoret Limestone directly overlies the Mulberry interval in the Rose Hill #1-6 core (Johnson, 2004). The expanded interval overlying the Mulberry interval in the Franklin County core and absence of coal in the Rose Hill #1-6 core suggests greater accommodation in the area surrounding the Franklin County core and less accommodation in the Miami County core. Mulberry Coal The Mulberry coal exhibits a lenticular to pod-like, extensive (3617 square miles [9368 sq. km]) and laterally continuous (2046 square miles [5299 sq. km; 56.6 %]) coal seam geometry oriented NW-SE (Fig. 3.29; Table 3.1). Relation of the Mulberry coal to depositional orientation is indeterminate. The thickness of the

69 136
Chapter 4: Sequence Stratigraphy of the Cherokee Group
 Chapter 4: Sequence Stratigraphy of the Cherokee Group 4.1 Sequence Stratigraphic Nomenclature Sequence stratigraphic concepts provide a framework to better explain and predict the lateral distribution,
Chapter 2: Coal Deposits of the Cherokee Basin
 Chapter 2: Coal Deposits of the Cherokee Basin Previous work by Harris (1984) and Stanton (1987) divided the Cherokee Group into ten stratigraphic intervals using laterally persistent dark-gray to black
Chapter Three: Coalbed Gas in the Cherokee Basin
 Chapter Three: Coalbed Gas in the Cherokee Basin The first test in Kansas to assess coalbed gas potential in southeastern Kansas was from several wells drilled during the late 1980 s in Wilson and Montgomery
CHAPTER 4: COALBED GAS IN THE BOURBON ARCH
 138 CHAPTER 4: COALBED GAS IN THE BOURBON ARCH 139 4.1 Introduction The Bourbon arch of eastern Kansas is a mature petroleum province with conventional hydrocarbon production in the declining stages over
CHAPTER 1: INTRODUCTION
 CHAPTER 1: INTRODUCTION 2 1.1 Introduction The Middle Pennsylvanian Series in east-central Kansas includes numerous coal seams within both siliciclastic and mixed carbonate-siliciclastic sedimentary successions,
Lower Skinner Valley Fill Sandstones: Attractive Exploration Targets on the Northeast Oklahoma Platform*
 Lower Skinner Valley Fill Sandstones: Attractive Exploration Targets on the Northeast Oklahoma Platform* By Jim Puckette 1 Search and Discovery Article #10050 (2003) *Adapted from presentation to Tulsa
Issues Related to Oklahoma Coalbed- Methane Activity,
 Figure 1. Map of the eastern Oklahoma coalfield (modified from Friedman, 1974). Issues Related to Oklahoma Coalbed- Methane Activity, 1988 2008 Brian J. Cardott Oklahoma Geological Survey INTRODUCTION
Data Repository item
 Data Repository (B25407): Localities and descriptions of measured sections of study areas Table 1. Localities of the measured sedimentary sections in the NW Sichuan Basin Section Number Stratigraphy Locality
Dakota Sandstone. of the Moxa Arch and Surrounding Green River Basin
 Dakota Sandstone of the Moxa Arch and Surrounding Green River Basin Dakota Sandstones of the Green River Basin Overview The Dakota sandstones of the Moxa Arch and surrounding Green River Basin remain attractive
Regional Trends in Coalbed Gas Composition and Thermal Maturation in Eastern Kansas: Implications for Predicting Quality and Location of Coalbed Gas
 Regional Trends in Coalbed Gas Composition and Thermal Maturation in Eastern Kansas: Implications for Predicting Quality and Location of Coalbed Gas K. David Newell and L. Michael Magnuson Kansas Geological
Sedimentary and Stratigraphic Analysis of the Viking Sand in the Edgerton/Wainwright Area, Central Alberta* By Russell Walz 1
 Sedimentary and Stratigraphic Analysis of the Viking Sand in the Edgerton/Wainwright Area, Central Alberta* By Russell Walz 1 Search and Discovery Article #50030 (2006) Posted June 25, 2006 *Extended abstract
Viking Lowstand Deposits in West Central Saskatchewan: Depositional Model for the Reservoir Units in Dodsland-Hoosier Area, Saskatchewan, Canada
 Viking Lowstand Deposits in West Central Saskatchewan: Depositional Model for the Reservoir Units in Dodsland-Hoosier Area, Saskatchewan, Canada Hasan Ferdous* PetroSed Geoconsulting Resources, Calgary,
Outcrops from Every Continent and 20 Countries in 140 Contributions. Tor H. Nilsen, Roger D. Shew, Gary S. Steffens, and Joseph R.J. Studlick.
 Paper VIII Tor H. Nilsen, Roger D. Shew, Gary S. Steffens, and Joseph R.J. Studlick Editors Outcrops from Every Continent and 20 Countries in 140 Contributions http://bookstore.aapg.org Length ~ 23 m (75.5
High-resolution Sequence Stratigraphy of the Glauconitic Sandstone, Upper Mannville C Pool, Cessford Field: a Record of Evolving Accommodation
 Page No. 069-1 High-resolution Sequence Stratigraphy of the Glauconitic Sandstone, Upper Mannville C Pool, Cessford Field: a Record of Evolving Accommodation Thérèse Lynch* and John Hopkins, Department
Accommodation. Tectonics (local to regional) Subsidence Uplift
 Subsidence Uplift") Accommodation Accommodation varies over time; it is the distance between a reference horizon and the sea surface (i.e. relative sea level). The space to be filled in with sediments or water What are the
Accommodation Accommodation varies over time; it is the distance between a reference horizon and the sea surface (i.e. relative sea level). The space to be filled in with sediments or water What are the
DATA REPOSITORY MATERIAL: PALEOCHANNEL GROUP MAPPING DESCRIPTIONS
 Data Repository item 2695 DATA REPOSITORY MATERIAL: PALEOCHANNEL GROUP MAPPING DESCRIPTIONS Groups 1 (North Myrtle Beach) and 2 (Atlantic Beach) Channel Groups 1 (North Myrtle Beach) and 2 (Atlantic Beach)
Evan K. Franseen, Dustin Stolz, Robert H. Goldstein, KICC, Department of Geology, University of Kansas
 Reservoir Character of the Avalon Shale (Bone Spring Formation) of the Delaware Basin, West Texas and Southeast New Mexico: Effect of Carbonate-rich Sediment Gravity Flows Evan K. Franseen, Dustin Stolz,
LOWER GRAND RAPIDS BITUMEN POOLS AT COLD LAKE, ALBERTA VARIATIONS IN STRATIGRAPHIC SETTING AND DEPOSITIONAL ENVIRONMENTS
 RAPIDS BITUMEN POOLS AT COLD LAKE, ALBERTA VARIATIONS IN STRATIGRAPHIC SETTING AND DEPOSITIONAL ENVIRONMENTS Brad J. Hayes, Petrel Robertson Consulting Ltd. Garrett M. Quinn, OSUM Oil Sands Corp. Summary
=%REPORT RECONNAISSANCE OF CHISHOLM LAKE PROSPECT. October 25, 1977
 =%REPORT ON FIELD RECONNAISSANCE OF CHISHOLM LAKE PROSPECT October 25, 1977 Bruce D. Vincent Imperial Oil Limited, Minerals - Coal, CALGARY, ALBERTA CHISHOLM LAKE PROSPECT Introduction The Chisholm Lake
Bulletin of Earth Sciences of Thailand
 Depositional Environments and Stratigraphic Development of the Grand Taman Sari Circuit Outcrop: an Analogue for Transgressive Mahakam Delta Successions Ridha Santika Riadi Petroleum Geoscience Program,
3rd-order sequence stratigraphy and lithostratigraphy of the Bearpaw Horseshoe Canyon transition, Alberta plains
 3rd-order sequence stratigraphy and lithostratigraphy of the Bearpaw Horseshoe Canyon transition, Alberta plains Ben Hathway, Alberta Geological Survey, Alberta Energy Regulator, Edmonton, Alberta, ben.hathway@aer.ca
1. Summary of Observations from a 40-Meter Cored Interval of the New Albany Shale in Well 1-3 Kavanaugh, Daviess County, Indiana
 2004 Annual Field Conference of the Great Lakes Section of SEPM 1 1. Summary of Observations from a 40-Meter Cored Interval of the New Albany Shale in Well 1-3 Kavanaugh, Daviess County, Indiana by Remus
Structural Geology Lab. The Objectives are to gain experience
 Geology 2 Structural Geology Lab The Objectives are to gain experience 1. Drawing cross sections from information given on geologic maps. 2. Recognizing folds and naming their parts on stereoscopic air
Lab 8: Facies Analysis and Correlations: Sequence Stratigraphy in the Book Cliffs, Utah
 Geology 109L Lab 8: Facies Analysis and Correlations: Sequence Stratigraphy in the Book Cliffs, Utah Goal: In this lab, you will put together your knowledge of near-shore facies and sequence stratigraphy
Hydrocarbon Distribution in the Mannville Waseca Member, Edam Oil Field, West-central Saskatchewan
 Hydrocarbon Distribution in the Mannville Waseca Member, Edam Oil Field, West-central Saskatchewan Peter Hill 1 Information from this publication may be used if credit is given. It is recommended that
LITHOLOGIC FACIES OF A PORTION OF THE STILLWATER FORMATION DON B. GOULD
 118 PROCEEDINGS OF THE OKLAHOMA a LITHOLOGIC FACIES OF A PORTION OF THE STILLWATER FORMATION DON B. GOULD University of Iowa, Iowa City, Iowa The Permian rocks of the world are noted for their unusual
29 th Forum of the Coal Geologists of the Western Interior Coal Region. Field Trip May 25, 2005
 29 th Forum of the Coal Geologists of the Western Interior Coal Region Field Trip May 25, 2005 Phoenix Coal Co. Garland Mine, Bourbon Co., KS and Coalbed Methane Operations of Dart Cherokee Basin Operating
The unknown giants - low-permeability shallow gas reservoirs of southern Alberta and Saskatchewan, Canada.
 The unknown giants - low-permeability shallow gas reservoirs of southern Alberta and Saskatchewan, Canada. Shaun O'Connell* Belfield Resources Inc., Calgary belfield@shaw.ca ABSTRACT The gas reserves contained
LINGUAU DEPOSITION IN THE WOODBINE SANDS ALONG COPPERAS BRANCH, DENTON COUNTY. TEXAS: A STUDY IN MARINE SEDIMENTATION
 LINGUAU DEPOSITION IN THE WOODBINE SANDS ALONG COPPERAS BRANCH, DENTON COUNTY. TEXAS: A STUDY IN MARINE SEDIMENTATION Ellis W. Shuler and Olin M. Millican The lack of outcrops in three dimensions often
THE STRUCTURE AND THICKNESS OF THE CLINTON AND BEREA FORMATIONS IN THE VICINITY OF WOOSTER, OHIO
 THE STRUCTURE AND THICKNESS OF THE CLINTON AND BEREA FORMATIONS IN THE VICINITY OF WOOSTER, OHIO KARL VER STEEG College of Wooster INTRODUCTION AND ACKNOWLEDGMENTS The data used in the construction of
A surficial. P^HiHI waste disposal site, Bureau County, Illinois. east of the Sheffield low-level radioactive. electrical resistivity survey
 ISGS CONTRACT/GRANT REPORT 1981-6 WATER RESOURCES DIVISION/USGS P^HiHI 100240 557.09773 IL6cr 1981-6 A surficial electrical resistivity survey east of the Sheffield low-level radioactive waste disposal
Morrow Series Study. of the Las Animas Arch Region
 Morrow Series Study of the Las Animas Arch Region Morrow Series of the Las Animas Arch Region Overview GeoDigital Information's Morrow Series study is designed to enhance both exploration and development
Transgressive Shoreline Deposits of the Lower Cretaceous (Albian) Bluesky Formation in the Boyer and Steen Field Areas of Northwestern Alberta*
 Bluesky Formation in the Boyer and Steen Field Areas of Northwestern Alberta*") Transgressive Shoreline Deposits of the Lower Cretaceous (Albian) Bluesky Formation in the Boyer and Steen Field Areas of Northwestern Alberta* Shaun O Connell 1 Search and Discovery Article #2298 (215)
Transgressive Shoreline Deposits of the Lower Cretaceous (Albian) Bluesky Formation in the Boyer and Steen Field Areas of Northwestern Alberta* Shaun O Connell 1 Search and Discovery Article #2298 (215)
GEOLOGY OF TODMORDEN MOOR 2 BACKGROUND
 GEOLOGY OF TODMORDEN MOOR 2 BACKGROUND 1) THE CARBONIFEROUS SERIES OF ROCKS The rocks of the Todmorden district are of the Carboniferous Series and were first laid down in an ancient sea, which covered
Page 1. Name:
 Name: Questions 1 through 3 refer to the following: The diagrams below represent two rock outcrops found several miles apart in New York State. Individual rock layers are lettered, and fossils and rock
Glauconitic Oil Reservoirs in Southern Alberta Creating the Correct Geological Model to Guide Development Drilling
 Glauconitic Oil Reservoirs in Southern Alberta Creating the Correct Geological Model to Guide Development Drilling Brad Hayes* Petrel Robertson Consulting Ltd, Calgary, AB bhayes@petrelrob.com Lisa Griffith
Bulletin of Earth Sciences of Thailand
 Quantitative Seismic Geomorphology of Early Miocene to Pleistocene Fluvial System of Northern Songkhla Basin, Gulf of Thailand Oanh Thi Tran Petroleum Geoscience Program, Department of Geology, Faculty
Stratigraphy and Hydrocarbon Production from Pennsylvanian Age Granite Wash Reservoirs in the Western Anadarko Basin, Oklahoma and Texas
 Stratigraphy and Hydrocarbon Production from Pennsylvanian Age Granite Wash Reservoirs in the Western Anadarko Basin, Oklahoma and Texas John Mitchell, Managing Partner/Consulting Geologist Fall River
Reservoir Characterization for the Application of ASP Flood Technology in the Bridgeport Sandstone in Lawrence Field, Illinois*
 Reservoir Characterization for the Application of ASP Flood Technology in the Bridgeport Sandstone in Lawrence Field, Illinois* Nathan D. Webb 1, Vineeth Madhavan 1, John P. Grube 1, Curt S. Blakley 1,
1 Hfli. ^^Hi. 11 mw\i. mmsisi i lull I. IMMRrtHttiifHmiititlK. RibWh. llml ''.' 1 ffililsiillsll8 ill. iiiinitsim IK«
 l i. :,, v. i :! 1.» r =,
IP 121 ILLINOIS PETROLEUJM Illinois Institute of Natdral Resources STATE GEOWGICA SURVEY DIVISION' Jack A. Simon. Chief
 IP 121 ILLINOIS PETROLEUJM 121 1981 Illinois Institute of Natdral Resources STATE GEOWGICA SURVEY DIVISION' Jack A. Simon. Chief Stevenson, D. L. (David L.) Geologic structure of the base of the New Albany
PREDICTION OF ACID MINE DRAINAGE POTENTIAL FROM COAL MINES
 PREDICTION OF ACID MINE DRAINAGE POTENTIAL FROM COAL MINES Arthur W. Rose, Professor of Geochemistry Eugene G. Williams, Professor of Geology Richard R. Parizek, Professor of Hydrogeology Acid mine drainage
Seismic Stratigraphy of the Fang Basin, Chiang Mai, Thailand Rungsun Nuntajun
 Chiang Mai J. Sci. 2009; 36(1) 77 Chiang Mai J. Sci. 2009; 36(1) : 77-82 www.science.cmu.ac.th/journal-science/josci.html Contributed Paper Seismic Stratigraphy of the Fang Basin, Chiang Mai, Thailand
Paleo Lab #4 - Sedimentary Environments
 Paleo Lab #4 - Sedimentary Environments page - 1. CHARACTERISTICS OF SEDIMENT Grain size and grain shape: The sizes and shapes of sedimentary particles (grains) are modified considerably during their transportation
THE NEW HARMONY GROUP (LOWER DEVONIAN)
") 2001. Proceedings of the Indiana Academy of Science 1 10:23-27 THE NEW HARMONY GROUP (LOWER DEVONIAN) REVISITED 1 John B. Droste and Alan S. Horowitz Department of Geological Sciences, Indiana : University,
2001. Proceedings of the Indiana Academy of Science 1 10:23-27 THE NEW HARMONY GROUP (LOWER DEVONIAN) REVISITED 1 John B. Droste and Alan S. Horowitz Department of Geological Sciences, Indiana : University,
The Booch Sandstones (McAlester Formation, Krebs Group), Arkoma Basin, Oklahoma Outcrops to Well Logs: An Introduction to Oklahoma Fluvial Reservoirs*
, Arkoma Basin, Oklahoma Outcrops to Well Logs: An Introduction to Oklahoma Fluvial Reservoirs*") The Booch Sandstones (McAlester Formation, Krebs Group), Arkoma Basin, Oklahoma Outcrops to Well Logs: An Introduction to Oklahoma Fluvial Reservoirs* Neil H. Suneson 1 Search and Discovery Article #10210
The Booch Sandstones (McAlester Formation, Krebs Group), Arkoma Basin, Oklahoma Outcrops to Well Logs: An Introduction to Oklahoma Fluvial Reservoirs* Neil H. Suneson 1 Search and Discovery Article #10210
Follow this and additional works at: Part of the Geology Commons
 Western Michigan University ScholarWorks at WMU Michigan Geological Repository for Research and Education Geosciences 2016 Geology of Michigan William B. Harrison III Michigan Geological Repository for
Update on Trenton Black River Playbook Study-New York State Museum
 Update on Trenton Black River Playbook Study-New York State Museum Taury Smith, Rich Nyahay, Rick Bray, Courtney Lugert, Rose Schulze and Brian Slater New York State Museum Task 4: Geochemistry Task 1
Depositional Model and Distribution of Marginal Marine Sands in the Chase Group, Hugoton Gas Field, Southwest Kansas and Oklahoma Panhandle
 Depositional Model and Distribution of Marginal Marine Sands in the Chase Group, Hugoton Gas Field, Southwest Kansas and Oklahoma Panhandle Nathan D. Winters, Martin K. Dubois, and Timothy R. Carr Kansas
Summary. Introduction
 Orthogonal geometrics of lower McMurray Formation sand complexes: effects of salt dissolution collapse-subsidence across the northern Athabasca oil sands deposit Paul L. Broughton, Chevron Canada Resources,
THE BLACK HAND FORMATION IN NORTH CENTRAL OHIO
 THE BLACK HAND FORMATION IN NORTH CENTRAL OHIO RICHARD C. LORD, Gambier, Ohio The Mississippian series in central Ohio consists of a series of alternating sandstones and shales, the thin vein of the Maxville
6. Cretaceous Zone Play Results
 C H A P T E R S I X 6. Cretaceous Zone Play Results 6. Geological Overview The Mannville Group was deposited as a clastic wedge east of the mountain ranges. This wedge varies in thickness from 7 metres
EUSTATIC AND TECTONIC CONTROL OF SEDIMENTATION IN THE PENNSYLVANIAN STRATA OF THE CENTRAL APPALACHIAN BASIN, USA
 Comptes Rendus XII ICC-P Volume 2:421-430 Buenos Aires, 1993 EUSTATIC AND TECTONIC CONTROL OF SEDIMENTATION IN THE PENNSYLVANIAN STRATA OF THE CENTRAL APPALACHIAN BASIN, USA Donald R. CHESNUT Jr. Kentucky
SAND DISTRIBUTION AND RESERVOIR CHARACTERISTICS NORTH JAMJUREE FIELD, PATTANI BASIN, GULF OF THAILAND
 SAND DISTRIBUTION AND RESERVOIR CHARACTERISTICS NORTH JAMJUREE FIELD, PATTANI BASIN, GULF OF THAILAND Benjawan KIinkaew Petroleum Geoscience Program, Department of Geology, Faculty of Science, Chulalongkorn
Bulletin of Earth Sciences of Thailand. Evaluation of the Petroleum Systems in the Lanta-Similan Area, Northern Pattani Basin, Gulf of Thailand
 Evaluation of the Petroleum Systems in the Lanta-Similan Area, Northern Pattani Basin, Gulf of Thailand Sirajum Munira Petroleum Geoscience Program, Department of Geology, Faculty of Science, Chulalongkorn
SL GEOLOGY AND MINING. Coal bearing strata in the project area are referable primarily to the Allegheny Group of
 SL-145-1 GEOLOGY AND MINING Coal bearing strata in the project area are referable primarily to the Allegheny Group of Pennsylvania age. These rocks occur as dissected remnants overlying the ridge-forming
Cretaceous, Dakota Formation, Terra Cotta Member South Side of I-70, Salina County, Kansas
 Cretaceous, Dakota Formation, Terra Cotta Member South Side of I-70, Salina County, Kansas Written By: Steven D.J. Baumann G-102010-1A Outcrop looking southeast Photo taken by: Steven Baumann on 10-20-2010
The Sequence Stratigraphic and Paleogeograhic Distribution of Reservoir-Quality Dolomite, Madison Formation, Wyoming and Montana
 The Sequence Stratigraphic and Paleogeograhic Distribution of Reservoir-Quality Dolomite, Madison Formation, Wyoming and Montana TAURY SMITH AND GREGOR EBERLI The primary aim of this study is to show the
0708 Carbon Sequestration and Enhanced Coalbed Methane Recovery Potential of the Cahaba and Coosa Coalfields in the Southern Appalachian Thrust Belt
 0708 Carbon Sequestration and Enhanced Coalbed Methane Recovery Potential of the Cahaba and Coosa Coalfields in the Southern Appalachian Thrust Belt M. R. McIntyre and J. C. Pashin Geological Survey of
ENGLE COAL FIELD. David E. Tabet
 OPEN FILE REPORT 115 SUMMARY OF THE GEOLOGY OF THE ENGLE COAL FIELD by David E. Tabet THE ENGLE COAL FIELD Introduction The Engle coal field (Lee, 1905), named for the small town of Engle along the Santa
Fluid-Mud Deposits of the Lower Jurassic Tilje Formation, Offshore Mid-Norway By Aitor A. Ichaso and Robert W. Dalrymple 1
 Fluid-Mud Deposits of the Lower Jurassic Tilje Formation, Offshore Mid-Norway By Aitor A. Ichaso and Robert W. Dalrymple 1 Search and Discovery Article #50107 (2008) Posted August 10, 2008 *Adapted from
Geology Stratigraphic Correlations (Lab #4, Winter 2010)
") Name: Answers Reg. lab day: Tu W Th Geology 1023 Stratigraphic Correlations (Lab #4, Winter 2010) Introduction Stratigraphic correlation is the process of comparing rocks at one locality with related rocks
Name: Answers Reg. lab day: Tu W Th Geology 1023 Stratigraphic Correlations (Lab #4, Winter 2010) Introduction Stratigraphic correlation is the process of comparing rocks at one locality with related rocks
Robert S. Sawin Stratigraphic Research Section Kansas Geological Survey. Open-File Report
 Copies of Archived Correspondence Pertinent to the Decision to Classify the Exposure at Point of Rocks, Morton County, Kansas, as Jurassic by the Kansas Geological Survey in 1967 Robert S. Sawin Stratigraphic
Stratigraphic Cross-Section
 Stratigraphic cross-sections are used to show stratigraphic relationships of strata along some path. They differ from structural cross-sections in three ways. First, their goals differ. Stratigraphic cross-sections
Beneath the Oil Sands: Stratigraphy and Structural Features of the Devonian of Northeast Alberta, Canada*
 Beneath the Oil Sands: Stratigraphy and Structural Features of the Devonian of Northeast Alberta, Canada* Chris L. Schneider 1, Shilong Mei 1, Matthias Grobe 1, and Kristine Haug 1 Search and Discovery
Abstract. Introduction. Regional Setting. GCSSEPM to be published December 2003
 Shelf Margin Deltas and Associated Deepwater Deposits: Implications on Reservoir Distribution and Hydrocarbon Entrapment, Block VI-1, Ulleung Basin, East Sea, South Korea Sneider, John S. Sneider Exploration,
AAPG Search and Discovery Article #90173 CSPG/CSEG/CWLS GeoConvention 2011, Calgary, Alberta, Canada, May 9-11, 2011
 Use of Image Logs in Differentiating Point Bar and Tidal Bar Deposits in the Leismer Area: Implications for SAGD Reservoir Definition in the Athabasca Oilsands Howard Brekke and Andrew Couch Introduction
Modeling Lateral Accretion in McMurray Formation Fluvial- Estuarine Channel Systems: Grizzly Oil Sands May River SAGD Project, Athabasca
 Modeling Lateral Accretion in McMurray Formation Fluvial- Estuarine Channel Systems: Grizzly Oil Sands May River SAGD Project, Athabasca Duncan Findlay, Thomas Nardin, Alex Wright, Raheleh Salehi Mojarad
LAS ANIMAS ARCH PROVINCE (040)
") LAS ANIMAS ARCH PROVINCE (040) By C. William Keighin INTRODUCTION The Las Animas Arch of southeastern Colorado is a north-northeast striking structural high, bounded on the south by the Apishipa Uplift.
LAS ANIMAS ARCH PROVINCE (040) By C. William Keighin INTRODUCTION The Las Animas Arch of southeastern Colorado is a north-northeast striking structural high, bounded on the south by the Apishipa Uplift.
Geologic Map of the Hatch Quadrangle, Doña County, New Mexico
 Geologic Map of the Hatch Quadrangle, Doña County, New Mexico By William R. Seager May 1995 New Mexico Bureau of Geology and Mineral Resources Open-file Digital Geologic Map OF-GM 213 Scale 1:24,000 This
Stephanie B. Gaswirth and Kristen R. Mara
 U.S. Geological Survey Assessment of Undiscovered Resources in the Bakken and Three Forks Formations, Williston Basin, North Dakota, Montana, and South Dakota, 2013 Stephanie B. Gaswirth and Kristen R.
GeoCanada 2010 Working with the Earth
 Lithofacies Identification and the Implications for SAGD Well Planning in the McMurray Formation, Christina Lake Area, Alberta Travis Shackleton*, Robert Gardner, Sung Youn, Grace Eng and Lori Barth Cenovus
Characterization of Seismically-Imaged Pennsylvanian Ooid Shoal Geometries and Comparison with Modern
 Characterization of Seismically-Imaged Pennsylvanian Ooid Shoal Geometries and Comparison with Modern W. Lynn Watney, Evan K. Franseen, Alan P. Byrnes, Rick Miller, and Abdelmoneam E. Raef Kansas Geological
Sequence Stratigraphy of the Upper Cretaceous Niobrara Formation, A Bench, Wattenberg Field, Denver Julesburg Basin, Colorado*
 Sequence Stratigraphy of the Upper Cretaceous Niobrara Formation, A Bench, Wattenberg Field, Denver Julesburg Basin, Colorado* Lisa E. Remington LaChance 1 and Mark C. Robinson 1 Search and Discovery Article
Summary. Introduction. Observations and Interpretations
 Lower McMurray Formation sinkholes and their fill fabrics: effects of salt dissolution collapse-subsidence across the northern Athabasca oil sands deposit Paul L. Broughton, Chevron Canada Resources, Calgary,
Structure contours on Abo Formation (Lower Permian) Northwest Shelf of Permian Basin
 Northwest Shelf of Permian Basin") Structure contours on Abo Formation (Lower Permian) Northwest Shelf of Permian Basin By Ronald F. Broadhead 1, Lewis Gillard 1, and Nilay Engin 2 1 New Mexico Bureau of Geology and Mineral Resources, a
Structure contours on Abo Formation (Lower Permian) Northwest Shelf of Permian Basin By Ronald F. Broadhead 1, Lewis Gillard 1, and Nilay Engin 2 1 New Mexico Bureau of Geology and Mineral Resources, a
GEOLOGICAL LOG INTERPRETATION TUTORIAL
 GEOLOGICAL LOG INTERPRETATION TUTORIAL Text and Figures by Geoff Bohling and John Doveton The following pages will familiarize you with the basics of the geological interpretation of common logs as they
Structure contours on Bone Spring Formation (Lower Permian), Delaware Basin
, Delaware Basin") Structure contours on Bone Spring Formation (Lower Permian), Delaware Basin By Ronald F. Broadhead and Lewis Gillard New Mexico Bureau of Geology and Mineral Resources, a division of New Mexico Tech, Socorro
Structure contours on Bone Spring Formation (Lower Permian), Delaware Basin By Ronald F. Broadhead and Lewis Gillard New Mexico Bureau of Geology and Mineral Resources, a division of New Mexico Tech, Socorro
Igneous and Metamorphic Rock Forming Minerals. Department of Geology Mr. Victor Tibane SGM 210_2013
 Igneous and Metamorphic Rock Forming Minerals Department of Geology Mr. Victor Tibane 1 SGM 210_2013 Classification of sedimentary rocks Sedimentary rocks are products of weathered, fragmented or dissolved,
Modeling Lateral Accretion in McMurray Formation Fluvial-Estuarine Channel Systems: Grizzly Oil Sands May River SAGD Project, Athabasca*
 Modeling Lateral Accretion in McMurray Formation Fluvial-Estuarine Channel Systems: Grizzly Oil Sands May River SAGD Project, Athabasca* Duncan Findlay 1, Thomas Nardin 1, Alex Wright 1, and Raheleh Salehi
THE QUATERNARY GEOLOGY OF NEWARK BAY AND KILL VAN KULL CHANNEL, NEW YORK AND NEW JERSEY. and
 THE QUATERNARY GEOLOGY OF NEWARK BAY AND KILL VAN KULL CHANNEL, NEW YORK AND NEW JERSEY Stephanie Beda, W. Bruce Ward, William Murphy, Robert Fleming, Gary Fleming, Beckett Boyd Earthworks LLC 27 Glen
OIL INDIA LIMITED, GEOPHYSICS DEPARTMENT, DULIAJAN, ASSAM.
 J. P. Singh, M. K. Gupta & Akshaya Kumar, Oil India Limited, Duliajan. jpsingh@oilindia.in Summary Oil exploration in Upper Assam commenced with the discovery of the Digboi oilfield more than 100 years
Rio Tinto Coal Mozambique. Refining the sedimentological model of the Moatize Basin Sediments, Stratigraphy & Coal
 Rio Tinto Coal Mozambique Refining the sedimentological model of the Moatize Basin Sediments, Stratigraphy & Coal Cautionary Statement This presentation has been prepared by Rio Tinto plc and Rio Tinto
4. Carboniferous Zone Play Results
 C H A P T E R F O U R 4. Carboniferous Zone Play Results 4. Geological Overview In the WCSB, there were two main depositional areas during Carboniferous time the Peace River Embayment in northwestern Alberta,
Tectonic Implications of Lower Mississippian Fort Payne Carbonate Mounds. Paul L. Scruggs, Bob Hatcher, Gene Lockyear, and Francis Fitzerald
 Tectonic Implications of Lower Mississippian Fort Payne Carbonate Mounds Paul L. Scruggs, Bob Hatcher, Gene Lockyear, and Francis Fitzerald Acknowledgements Gary Bible David Wright Miller Energy Resources
Mississippian Strata in Southeastern New Mexico, Including the Barnett Shale: Thickness, Structure and Hydrocarbon Plays
 Mississippian Strata in Southeastern New Mexico, Including the Barnett Shale: Thickness, Structure and Hydrocarbon Plays by Ronald F. Broadhead New Mexico Bureau of Geology and Mineral Resources A Division
Art Saller 1. Search and Discovery Article #10606 (2014) Posted June 30, 2014
 Posted June 30, 2014") Late Pennsylvanian and Early Permian Sedimentation on the Central Basin Platform and Implications to the Wolfberry Deposition in the Western Midland Basin* Art Saller 1 Search and Discovery Article #10606
Late Pennsylvanian and Early Permian Sedimentation on the Central Basin Platform and Implications to the Wolfberry Deposition in the Western Midland Basin* Art Saller 1 Search and Discovery Article #10606
Jesse D. Thompson. Dr. Diane Kamola Chairperson. Dr. Anthony W. Walton. Dr. Ross A. Black. Date defended:
 SEQUENCE STRATIGRAPHY AND FACIES ANALYSIS OF THE ROLLINS SANDSTONE MEMBER (MOUNT GARFIELD FORMATION) AND RE- EXAMINATION OF THE CONTACT BETWEEN THE MOUNT GARFIELD AND WILLIAMS FORK FORMATIONS (LATE CRETACEOUS)
Detailed Sedimentology and Inorganic Geochemistry of the Dolgeville Formation and Utica Group of the Central Mohawk Valley, NY
 Detailed Sedimentology and Inorganic Geochemistry of the Dolgeville Formation and Utica Group of the Central Mohawk Valley, NY Daniel Miserendino Jeffrey T. Pietras Introduction and Purpose Drill cores
Shallow P and S velocity structure, Red Deer, Alberta
 Shallow P and S velocity structure, Red Deer, Alberta P & S velocity structure Don C. Lawton, Meredith A. McArthur, Rachel T. Newrick and Sarah E. Trend ABSTRACT A multioffset vertical seismic profile
SECTION 4 TABLES. 1 Summary of Hydrogeologic Parameters for Various Stratigraphic Units FIGURES
 SECTION 4 4.0 OVERVIEW OF GEOLOGY AND HYDROGEOLOGY... 13 4.1 Comparison of East and West Sides of Study Area... 15 4.2 Bedrock Sequence... 17 4.3 Mancos Shale (Upper Cretaceous)... 18 4.4 Mesaverde Formation
AAPG HEDBERG RESEARCH CONFERENCE
 AAPG HEDBERG RESEARCH CONFERENCE Reservoir Scale Deformation - Characterization and Prediction June 22-28, 1997, Bryce, Utah Stratigraphic Controls on Fracture Distribution in the Austin Chalk: An Example
Nathan D. Webb and James L. Best
 Nathan D. Webb and James L. Best Background Pennsylvanian oil production Stratigraphy & geologic setting Study area Methods Using geophysical logs & core Results Comparing three channel deposits Implications
Petroleum Potential of the Application Area L12-4
 Petroleum Potential of the Application Area L12-4 The Application Area (L12-4) is underlain by the western Officer Basin, beneath the Gunbarrel Basin. The general basin architecture is outlined in Figure
Sedimentary Structures in Metamorphic Rocks
 Maine Geologic Facts and Localities November, 2006 Primary Sedimentary Structures in Some Metamorphic Rocks Text by Thomas K. Weddle, Department of Agriculture, Conservation & Forestry 1 Photo by Thomas
Sediment and sedimentary rocks Sediment
 Sediment and sedimentary rocks Sediment From sediments to sedimentary rocks (transportation, deposition, preservation and lithification) Types of sedimentary rocks (clastic, chemical and organic) Sedimentary
DELINEATION OF SUBTLE GEOLOGIC FEATURES BY MULTI-ATTRIBUTE SEISMIC ANALYSIS IN DICKMAN FIELD, KANSAS, A POTENTIAL SITE FOR CO2 SEQUESTRATION
 DELINEATION OF SUBTLE GEOLOGIC FEATURES BY MULTI-ATTRIBUTE SEISMIC ANALYSIS IN DICKMAN FIELD, KANSAS, A POTENTIAL SITE FOR CO2 SEQUESTRATION Presented to The Faculty of the Department of Earth and Atmospheric
Lower Mississippian Sequence Stratigraphy and Depositional Dynamics: Insights from the Outcrops, Northwestern Arkansas and Southwestern Missouri
 Lower Mississippian Sequence Stratigraphy and Depositional Dynamics: Insights from the Outcrops, Northwestern Arkansas and Southwestern Missouri Walter L. Manger Professor of Geology, Emeritus University
Unconformities are depositional contacts that overlie rocks distinctly older than they are. They are often called gaps in the sedimentary record.
 UNCONFORMITIES Unconformities are depositional contacts that overlie rocks distinctly older than they are. They are often called gaps in the sedimentary record. The contact represents time when no sediment
Sedimentary rocks. Mechanical Weathering. Weathering. Chemical weathering. Rates of weathering. Fossil Fuel Resources. Two kinds of weathering
 Sedimentary rocks Fossil Fuel Resources Exam next Tuesday February 14 Bring Scantron and Review Questions About 75% of all rock outcrops on the continents Important to reconstruct much of Earth's history