Labs. Exposure modeling. Dr. Keiko Saito GFDRRLabs, The World Bank
|
|
|
- Dinah Bates
- 5 years ago
- Views:
Transcription


1 Labs Exposure modeling Dr. Keiko Saito GFDRRLabs, The World Bank
")
 Vulnerability (e.g.")
 From")

2 Labs Risk Modeling Hazard (e.g. hurricane wind) Exposure (e.g. houses) Vulnerability (e.g. of house to wind) Risk (e.g. probable loss) From CAPRA definition of Risk Disaster Impact Analysis - Scenario or Stochastic -

3 Labs Risk Analysis Components By Dr. Bijan Karzai CEDIM, Germany Fragility/Susceptibility Analysis Analysis of fragilities in infrastructure and built environment Analysis of susceptibility in non-physical systems (e.g. populations, ecosystem, etc.) Hazard Analysis Geological Hydrometeorological Biological Technological Environmental Risk Analysis Vulnerability Analysis Social Economic Physical Environmental Cultural Capacity/Resilience Analysis Analysis of weaknesses and gaps in existing protective and adaptive strategies. Legal/institutional frameworks and policies Social and economic development practices
4 Labs Uncertainty Estimating risk is fraught with lots of uncertainty. Dealing with uncertainty is the essence of risk analysis.. Uncertainty is the state of having limited knowledge. In probabilistic risk analysis, we can account for uncertainty. Uncertainties are inherent (for example) in: Hazard (spatial, temporal, dimensional) Susceptibility (physical, social, economic, etc.) Exposure Database (acquisition, transformation representation, change) Benefits of risk reduction measures 4


5 Labs What elements are at risk? All forms of man-made structures are at risk. Building Infrastructure - Any man-made construction, either urban or rural. Crops Population Residential Commercial Industrial Different forms of man-made structures 5
6 What elements are at risk? Transportation Road, rail, air and other transport-related networks Large Loss Facilities Sports stadiums, marketplaces, churches/temples/mosques, schools and other high population density infrastructure Critical/High-Risk Loss Facilities Hospital and health care facilities, public buildings, telecommunications, airports, energy systems, bridges and other facilities critical to the recovery of a region post-earthquake Other Lifelines Utilities, Pipelines Oil, gas and water supply pipelines/distribution systems, wastewater and electricity systems 6


7 What type of data is needed for exposure Elements at risk characterization Number, type, location, size, height, age, construction cost, land value, irregularities, material and mechanical properties Government/Regional data Building code knowledge, previous earthquake damage reports, social and economic datasets Population details Day/night occupancy of people 7

8 What do we collect for exposure data? Is the data there? It depends on scale and country type Local Council data, local government agencies, aerial photos, individual architectural, structural drawings Provincial State-based agencies, statistical offices, census data, investment and business listings, employment figures, existing GIS data. National National statistical agencies, census data, global databases, remote sensing Exposure scale, Local, Regional, National 8


9 Data resolution: the question of scale Risk modeling by natural disaster type Earthquakes Tsunami Floods Hurricanes Volcanic Windstorm 100 km Earthquake 400 km 1 km Flood Level of analysis needs to be close to size of highest risk zone
 Number of collapsed")


10 exposure Resolution of the hazard and exposure data Eruption scenario (deterministic) Number of collapsed buildings, zone 2 Number of deaths, zone 2 Number of serious injuries, zone 2 When using zones When using 250 m grid cells Resolution of the input hazard model should also be taken into account Out of 8206 buildings: 1%
11 Exposure data guidelines (Buildings) The data collection method depends on the purpose of the study, as well as data availability. The building types defined should correspond to those for which vulnerability data already exists. For exposure data, the necessary information is usually reduced to the following parameters : Building type (location, material, regularity, and building shape in general, number of storeys/ building height, year of construction, use type, replacement cost, square footage, roof type, base elevation) Context information e.g. the spatial position of a house in relation to other buildings (Grunthal, 1998; HAZUS, 1999; Lang, 2002; Muller et at, 2006)


12 Copyright ImageCat 2009 Unit of aggregation, geographical scale and data collection methodologies 1. Spatial Tiers 2. Top Down - Bottom up Tier 3 Tier 2 Tier 1 Tier 0 Building Neighborhood City Province Country Region Global ImageCat Inc. A tiered concept depending on participants variable budgets, resources, and existing data availability. Integrating a range of data sources for inventory development, which might combine top down remote sensing and government records, with bottom-up expert opinion.


13 Exposure Assessment Top Down Bottom Up
14 Scale Per-structure Neighbourhood/City Region/country Global Structures possible attributes Building count Occupancy (detailed e.g. sfd, mfd, factory, retail) Height/stories Sq ft Structural type Building density Occupancy (general e.g. res, com, ind, slum, service) Probable height Probable structural type Building density Occupancy (broad e.g. res, com, ind) Urban/non-urban Population possible attributes Population count per building Population density per general occupancy class Population density per broad occupancy class Population density in populated areas Datasets Local expert knowledge used for calibration and validation or Tier 1 and Tier 2 Moderate resolution satellite imagery High resolution satellite and aerial imagery Government statistics Tier 3 expert knowledge Moderate resolution satellite High-resolution satellite/aerial imagery Census and other public statistics e.g. High-resolution satellite/aerial & in-field observations Cost Cost likely preclusive due to due to high-res imagery and time required Cost viable if access to Bing/Google imagery for calibration/validation Cost viable Cost viable
15 Per-Building data For small areas, building by building surveys can be carried out on the ground. E.g. Pylos, Greece, approximately 1400 buildings surveyed in 2 weeks by 2 people. Countries like Japan have a long history of collecting per building data MasterMap in the UK now contains attributes and footprints at the per-building level. However, lacks information about the structure type. Padang data was collected with a view to use the data for DRM. Used combination of remotely sensed data (object oriented classification) and field survey.
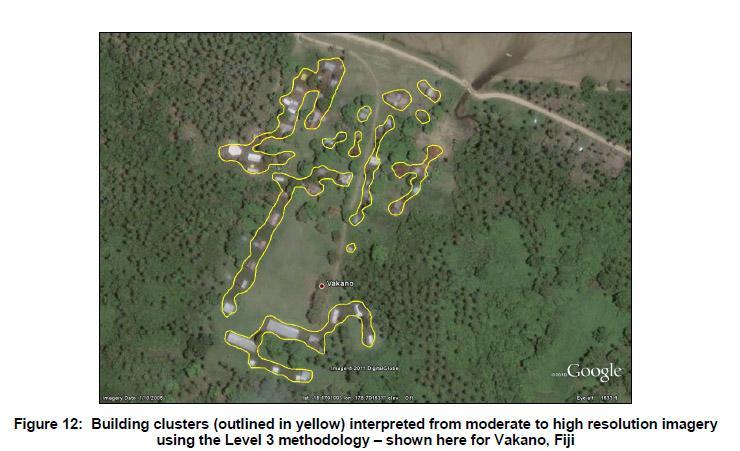
16 Example 1: The Pacific Catastrophe Risk Assessment and Financing Initiative (PCRAFI) (combination of bottom up and top down) 1. Individual buildings manually digitized from high-resolution satellite imagery and field verified via in-situ inspections Coverage: PG, TO, VU, TV, SB, WS, CK, FJ, KI, PW, and FM. 2. Individual buildings manually digitized from high-resolution satellite imagery but not field verified Coverage: All 15 countries 3. Clusters of buildings delineated by polygons and manually enumerated, extracted from moderate to high-resolution imagery Coverage: PG, FJ, KI and, to a lesser extent, SB, CK, and MH. 4. Buildings in mostly rural areas, inferred using image processing techniques and/or census data, and aggregated to uniform gridded polygons ( cells ) with associated building counts Coverage: PG, TL, SB, VU, FJ, FM, MH, KI and, to a lesser extent, CK, TO, and TV.

17 Building database with all categories

18
19

20

21

22

23 Advantage of having exhaustive footprints: Tohoku earthquake insurance claim handling using geospatial data Pre-event footprint and post-event aerial photographs used for claim handling by the Marine and Fire Insurance Association of Japan as well as local governments. Highlights the importance of data preparedness 23

24 Crowd sourced post-event building damage assessment Led by ImageCat, TomNod, EERI, EEFIT, CAR Ltd, Christchurch City Council, funded by Global Earthquake Model 24
25 Example 2: Indonesia exposure data Another example of creating exposure model utilising satellite data. Assume homogeneous building type distribution for a particular land cover class. Building inventory Extrapolate based on land cover type across a wide region. Validation of the assumption is needed. Area of research.


26 Pilot Exposure Development

27 Methodology 1. Delineating areas of urban development using remotely sensed data 2. Categorizing land cover into homogenous areas of development 3. Characterizing development within each use category using the results of ground surveys and the best available information on Indonesian construction practices 4. Estimating number of buildings, square footage and distribution of building types for all delineated areas
")
 Commercial Industrial Port Resort Sample use classes for")
28 Classification of uses Typical land cover classes developed for study Residential Sparse residential (Residential located on Agricultural land) Moderate Density Residential High density residential (in dense urban settings) Commercial Industrial Port Resort Sample use classes for Mataram, Lombok
29 Classification of structure types Typical building classes developed for study Masonry Rubble stone, field stone Adobe (earth brick) Simple stone Massive stone Unreinforced, with manufactured stone units Unreinforced, with reinforced concrete floors Reinforced masonry Confined masonry (within a reinforced concrete frame) Steel Structures Moment frame Braced frame Light frame (transverse-frame; longitudinal-steel rod tension-only bracing) Timber Structures Open frame at grade Shear wall at grade Dwelling anchored at grade Dwelling elevated on piers or stilts Reinforced Concrete Frame Shear wall Precast frames


30 Mataram, Lombok Field Surveys: To characterize development in different use or occupancy classes To validate classification 2

31 LOMBOK SURVEY EXAMPLE GROUND PHOTOGRAPHS VIEWED IN GOOGLE EARTH


32 LOMBOK SURVEY BUILDING ATTRIBUTES SUMMARY AND SAMPLE PHOTOS Location Occupancy Percentage Lombok Commercial 12% Lombok Education 3% Lombok Government 9% Lombok Industrial <1% Lombok Religious 2% Lombok Residential 74% 100% Location Stories Percentage Lombok 1 72% Lombok 2 25% Lombok 3 2% Lombok 4 1% Total 100% Location Roof types Percentage Lombok Clay tile 70% Lombok Concrete slab 4% Lombok Corrugated Metal 25% Lombok Plywood <1% Lombok Unknown <1% Total 100%
33 Critical infrastructure mapping It may be possible to re-use information on the location of critical infrastructure from previous mapping projects. If data does not exist, one avenue to investigate would be to use crowd sourcing. (e.g. Open Street Map or Google Map Maker etc).
34 Critical infrastructure mapping Infrastructure Covered for the Pacific islands: Airports Bridges Road Networks Water Systems (pipe networks, pump stations, holding tanks, etc.) Power Systems (poles, substations, power boxes, etc.) Port Infrastructure

35

36


37 Collected Infrastructure Data Papua New Guinea
38 Summary Statistics for All 15 Countries: Infrastructure Assets (Preliminary)


39 Labs Visualization of hazard and risk Hazards + Exposure + Vulnerability + Risk Territorial planning Infrastructure design Cost Benefit analysis for mitigation and prevention investments Scenario analysis for emergency preparedness Immediate damage assessment Applications Analysis of financial exposure Climate Change
40 Thank you! Questions?
HAZUS-MH: Earthquake Event Report
 HAZUS-MH: Earthquake Event Report Region Name: El Paso County Earthquake Scenario: El Paso County Random EQ Print Date: February 08, 2006 Disclaimer: The estimates of social and economic impacts contained
Initiative. Country Risk Profile: papua new guinea. Better Risk Information for Smarter Investments PAPUA NEW GUINEA.
 Pacific Catastrophe Risk Assessment And Financing Initiative PAPUA NEW GUINEA September 211 Country Risk Profile: papua new is expected to incur, on average, 85 million USD per year in losses due to earthquakes
Pacific Catastrophe Risk Assessment And Financing Initiative
 Pacific Catastrophe Risk Assessment And Financing Initiative TUVALU is expected to incur, on average,. million USD per year in losses due to earthquakes and tropical cyclones. In the next 5 years, has
PACIFIC CATASTROPHE RISK ASSESSMENT AND FINANCING INITIATIVE
 PACIFIC CATASTROPHE RISK ASSESSMENT AND FINANCING INITIATIVE PW FM MH NR KI TL PG SB VU TV WS FJ CK NU TO SEPTEMBER 11 The Pacific Region is prone to many natural hazards that threaten populations and
Pacific Catastrophe Risk Assessment And Financing Initiative
 Pacific Catastrophe Risk Assessment And Financing Initiative PALAU September is expected to incur, on average,.7 million USD per year in losses due to earthquakes and tropical cyclones. In the next 5 years,
Pacific Catastrophe Risk Assessment And Financing Initiative
 Pacific Catastrophe Risk Assessment And Financing Initiative TIMOR-LESTE September Timor-Leste is expected to incur, on average, 5.9 million USD per year in losses due to earthquakes and tropical cyclones.
Pacific Catastrophe Risk Assessment And Financing Initiative
 Pacific Catastrophe Risk Assessment And Financing Initiative VANUATU September 211 Country Risk Profile: VANUATU is expected to incur, on average, 48 million USD per year in losses due to earthquakes and
GIS methodologies for local tsunami risk assessment: examples
 GIS methodologies for local tsunami risk assessment: examples R. Frauenfelder 1,2, C.B. Harbitz 1,2, Sverdrup-Thygeson 1,2, G. Kaiser 2,4, R. Swarny 3, L. Gruenburg 3, S. Glimsdal 1,2, F. Løvholt 1,2,
Copernicus Overview. Major Emergency Management Conference Athlone 2017
 Copernicus Overview Major Emergency Management Conference Athlone 2017 Copernicus is a European programme implemented by the European Commission. The services address six thematic areas: land, marine,
The AIR Bushfire Model for Australia
 The AIR Bushfire Model for Australia In February 2009, amid tripledigit temperatures and drought conditions, fires broke out just north of Melbourne, Australia. Propelled by high winds, as many as 400
3D BUILDING GIS DATABASE GENERATION FROM LIDAR DATA AND FREE ONLINE WEB MAPS AND ITS APPLICATION FOR FLOOD HAZARD EXPOSURE ASSESSMENT
 3D BUILDING GIS DATABASE GENERATION FROM LIDAR DATA AND FREE ONLINE WEB MAPS AND ITS APPLICATION FOR FLOOD HAZARD EXPOSURE ASSESSMENT Jojene R. Santillan, Meriam Makinano-Santillan, Linbert C. Cutamora,
Applied Geoscience and Technology Division SOPAC. Joy Papao, Risk Information Systems Officer
 Joy Papao, Risk Information Systems Officer Secretariat of the Pacific Community SPC 22 Pacific Island States Head office in Noumea, New Caledonia 2 Regional offices (Pohnpei and Honiara) 600 staff 9 Technical
Australia Government Geospatial Capacity Building Efforts in Asia and the Pacific. Dr John Dawson
 Australia Government Geospatial Capacity Building Efforts in Asia and the Pacific Dr John Dawson Presentation Overview About Geoscience Australia Examples of Geospatial Capacity Building Activity Geodesy
Crowdsourcing approach for large scale mapping of built-up land
 Crowdsourcing approach for large scale mapping of built-up land Kavinda Gunasekara Kavinda@ait.asia Geoinformatics Center Asian Institute of Technology, Thailand. Regional expert workshop on land accounting
Earthquakes. & Expansive Soils
 Earthquakes & Expansive Soils January 22, 2009 Plan Update Flanagan & Associates, LLC Consultants Tulsa, OK www.rdflanagan.com rdflanagan@rdflanagan.com Plan can be reviewed at: www.rdflanagan.com/.html
Application of high-resolution (10 m) DEM on Flood Disaster in 3D-GIS
 DEM on Flood Disaster in 3D-GIS") Risk Analysis V: Simulation and Hazard Mitigation 263 Application of high-resolution (10 m) DEM on Flood Disaster in 3D-GIS M. Mori Department of Information and Computer Science, Kinki University, Japan
Risk Analysis V: Simulation and Hazard Mitigation 263 Application of high-resolution (10 m) DEM on Flood Disaster in 3D-GIS M. Mori Department of Information and Computer Science, Kinki University, Japan
Downtown Anchorage Seismic Risk Assessment & Land Use Regulations to Mitigate Seismic Risk
 Prepared for: The Municipality of Anchorage Planning Department and the Geotechnical Advisory Commission Downtown Anchorage Seismic Risk Assessment & Land Use Regulations to Mitigate Seismic Risk Prepared
KENTUCKY HAZARD MITIGATION PLAN RISK ASSESSMENT
 KENTUCKY HAZARD MITIGATION PLAN RISK ASSESSMENT Presentation Outline Development of the 2013 State Hazard Mitigation Plan Risk Assessment Determining risk assessment scale Census Data Aggregation Levels
They include earthquakes, volcanic eruptions, floods, landslides, and other processes and occurrences. They are included in the broader concept of.
 They include earthquakes, volcanic eruptions, floods, landslides, and other processes and occurrences. They are included in the broader concept of. In general, natural processes are labeled hazardous only
Exposure Database of the Pacific Islands. ADB TA 6496-REG: Regional Partnerships for Climate Change Adaptation and Disaster Preparedness
 Exposure Database of the Pacific Islands ADB TA 6496-REG: Regional Partnerships for Climate Change Adaptation and Disaster Preparedness Update GFDRR Meeting 16 19 May 2010 Phil Glassey 1, David Heron 1,
World Meteorological Organization
 World Meteorological Organization Opportunities and Challenges for Development of Weather-based Insurance and Derivatives Markets in Developing Countries By Maryam Golnaraghi, Ph.D. Head of WMO Disaster
1The Many Uses of GIS
 1The Many Uses of GIS BUILDING EUROPEAN SPATIAL DATA INFRASTRUCTURES In April 2006, Esri president Jack Dangermond gave a presentation on the INSPIRE Directive at the European Union (EU) Interparliamentary
VULNERABILITY FUNCTIONS FOR BUILDINGS BASED ON DAMAGE SURVEY DATA IN SRI LANKA AFTER THE 2004 INDIAN OCEAN TSUNAMI. Murao, O. 1, Nakazato, H.
 371 VULNERABILITY FUNCTIONS FOR BUILDINGS BASED ON DAMAGE SURVEY DATA IN SRI LANKA AFTER THE 2004 INDIAN OCEAN TSUNAMI Murao, O. 1, Nakazato, H. 2 1 Graduate School of Systems and Information Engineering,
Geospatial Information and Services for Disasters (GIS4D)
") Geospatial Information and Services for Disasters (GIS4D) 31 July 2017 Tae Hyung KIM ICT and Disaster Risk Reduction Division (IDD) UNESCAP 1 About ESCAP Who is ESCAP? United Nations Economic and Social
Geospatial Information and Services for Disasters (GIS4D) 31 July 2017 Tae Hyung KIM ICT and Disaster Risk Reduction Division (IDD) UNESCAP 1 About ESCAP Who is ESCAP? United Nations Economic and Social
Geospatial Information Management in the Americas: Lessons for the Post-2015 development agenda
 Geospatial Information Management in the Americas: Lessons for the Post-2015 development agenda Rolando Ocampo President, UN-GGIM: Americas October 2014 The integration of statistical and geographical
Disaster Risk Assessment: Opportunities for GIS and data management with Open DRI
 Disaster Risk Assessment: Opportunities for GIS and data management with Open DRI Jacob Opadeyi Department of Geomatics Engineering and Land Management, The University of the West Indies, St. Augustine,
Spatial Analysis of Natural Hazard and Climate Change Risks in Peri-Urban Expansion Areas of Dakar, Senegal
 1 Spatial Analysis of Natural Hazard and Climate Change Risks in Peri-Urban Expansion Areas of Dakar, Senegal URBAN WEEK 2009 BBL Preston Lounge Thursday, March 12, 2009 Christian Hoffmann GeoVille group
Use of Geospatial data for disaster managements
 Use of Geospatial data for disaster managements Source: http://alertsystemsgroup.com Instructor : Professor Dr. Yuji Murayama Teaching Assistant : Manjula Ranagalage What is GIS? A powerful set of tools
STATUS OF HAZARD MAPS VULNERABILITY ASSESSMENTS AND DIGITAL MAPS
 JapanInternational Cooperation Agency STATUS OF HAZARD MAPS VULNERABILITY ASSESSMENTS AND DIGITAL MAPS ANGUILLA REPORT THE CARIBBEAN DISASTER EMERGENCY RESPONSE AGENCY () Table of Contents Page Preface
SEISMIC RISK ASSESSMENT IN ARMENIA
 SEISMIC RISK ASSESSMENT IN ARMENIA Hovhannes Khangeldyan Head of National Crisis Management Center Rescue Service Ministry of Emergency Situations of the Republic of Armenia Tokyo, 2016 ARMENIA: GEOGRAPHICAL
AUTOMATED BUILDING DETECTION FROM HIGH-RESOLUTION SATELLITE IMAGE FOR UPDATING GIS BUILDING INVENTORY DATA
 13th World Conference on Earthquake Engineering Vancouver, B.C., Canada August 1-6, 2004 Paper No. 678 AUTOMATED BUILDING DETECTION FROM HIGH-RESOLUTION SATELLITE IMAGE FOR UPDATING GIS BUILDING INVENTORY
COMPREHENSIVE GIS-BASED SOLUTION FOR ROAD BLOCKAGE DUE TO SEISMIC BUILDING COLLAPSE IN TEHRAN
 COMPREHENSIVE GIS-BASED SOLUTION FOR ROAD BLOCKAGE DUE TO SEISMIC BUILDING COLLAPSE IN TEHRAN B. Mansouri 1, R. Nourjou 2 and K.A. Hosseini 3 1 Assistant Professor, Dept. of Emergency Management, International
Introduction. Thematic Mapping for Disaster Risk Assessment in Case of Earthquake FIG Working Week
 Thematic Mapping for Disaster Risk Assessment in Case of Earthquake Silvia MARINOVA, Temenoujka BANDROVA, Mihaela KOUTEVA-GUENTCHEVA, Stefan BONCHEV University of Architecture, Civil Engineering and Geodesy
SUPPORTS SUSTAINABLE GROWTH
 DDSS BBUUN NDDLLEE G E O S P AT I A L G O V E R N A N C E P A C K A G E SUPPORTS SUSTAINABLE GROWTH www.digitalglobe.com BRISBANE, AUSTRALIA WORLDVIEW-3 30 CM International Civil Government Programs US
Roles of NGII in successful disaster management
 The Second UN-GGIM-AP Plenary Meeting Roles of NGII in successful disaster management Republic of Korea Teheran Iran 28 October 2013 Sanghoon Lee, Ph.D. NGII Outline Type of Disasters Occur in Korea Practical
Southington. Challenges
 Southington Southington, similar to its next-door neighbor Berlin, is a suburban community in the southeast part of the region. Originally an agricultural community, Southington has also hosted industry
Appendix 2. Extracts from Ministry for the Environment Active Fault Guidelines 2003
 Extracts from Ministry for the Environment Active Fault Guidelines 2003 Published in July 2003 by the Ministry for the Environment Manatu Mo Te Taiao PO Box 10-362, Wellington, New Zealand ISBN: 0-478-18901
Understanding China Census Data with GIS By Shuming Bao and Susan Haynie China Data Center, University of Michigan
 Understanding China Census Data with GIS By Shuming Bao and Susan Haynie China Data Center, University of Michigan The Census data for China provides comprehensive demographic and business information
Land Accounts - The Canadian Experience
 Land Accounts - The Canadian Experience Development of a Geospatial database to measure the effect of human activity on the environment Who is doing Land Accounts Statistics Canada (national) Component
USE OF GEOREFERENCE INFORMATION FOR DRM Arnob Bormdoi Research Associate, GIC
 USE OF GEOREFERENCE INFORMATION FOR DRM Arnob Bormdoi Research Associate, GIC CONTENTS INTRODUCTION THE IMPORTANCE OF SPATIAL INFORMATION CASE STUDIES SUMMARY INTRODUCTION The process of defining how raster
KNOWLEDGE NOTE 5-1. Risk Assessment and Hazard Mapping. CLUSTER 5: Hazard and Risk Information and Decision Making. Public Disclosure Authorized
 Public Disclosure Authorized Public Disclosure Authorized Public Disclosure Authorized Public Disclosure Authorized KNOWLEDGE NOTE 5-1 CLUSTER 5: Hazard and Risk Information and Decision Making Risk Assessment
CURRENT AND FUTURE TROPICAL CYCLONE RISK IN THE SOUTH PACIFIC
 CURRENT AND FUTURE TROPICAL CYCLONE RISK IN THE SOUTH PACIFIC COUNTRY RISK PROFILE: SAMOA JUNE 2013 Samoa has been affected by devastating cyclones on multiple occasions, e.g. tropical cyclones Ofa and
LandScan Global Population Database
 LandScan Global Population Database The World s Finest Population Distribution Data Uncommon information. Extraordinary places. LandScan Global Population Database East View Cartographic is now offering
Using Remote Sensing Technologies to Improve Resilience
 4 Using Remote Sensing Technologies to Improve Resilience Ronald T. Eguchi CEO, ImageCat, Inc. 6 years ago The world had just survived the Y2K bug with no major incidents Nations around the world commit
Vulnerability assessment using remote sensing. Achim Roth, Hannes Taubenböck German Aerospace Center, German Remote Sensing Data Center
 Vulnerability assessment using remote sensing Achim Roth, Hannes Taubenböck German Aerospace Center, German Remote Sensing Data Center Risk Hazard - Vulnerability Izmit Earthquake 1999 Folie 2 Risk Hazard
ENV208/ENV508 Applied GIS. Week 1: What is GIS?
 ENV208/ENV508 Applied GIS Week 1: What is GIS? 1 WHAT IS GIS? A GIS integrates hardware, software, and data for capturing, managing, analyzing, and displaying all forms of geographically referenced information.
THE 3D SIMULATION INFORMATION SYSTEM FOR ASSESSING THE FLOODING LOST IN KEELUNG RIVER BASIN
 THE 3D SIMULATION INFORMATION SYSTEM FOR ASSESSING THE FLOODING LOST IN KEELUNG RIVER BASIN Kuo-Chung Wen *, Tsung-Hsing Huang ** * Associate Professor, Chinese Culture University, Taipei **Master, Chinese
Summary of Available Datasets that are Relevant to Flood Risk Characterization
 Inter-Agency Characterization Workshop February 25-27, 2014 USACE Institute for Water Resources, Alexandria, VA, IWR Classroom Summary of Available Datasets that are Relevant to Characterization National
Georeferencing and Satellite Image Support: Lessons learned, Challenges and Opportunities
 Georeferencing and Satellite Image Support: Lessons learned, Challenges and Opportunities Shirish Ravan shirish.ravan@unoosa.org UN-SPIDER United Nations Office for Outer Space Affairs (UNOOSA) UN-SPIDER
Landslide Hazard Assessment Methodologies in Romania
 A Scientific Network for Earthquake, Landslide and Flood Hazard Prevention SciNet NatHazPrev Landslide Hazard Assessment Methodologies in Romania In the literature the terms of susceptibility and landslide
2/27/2015. Perils. Risk. Loss PRICING TORNADOES: USING CAT MODELS FOR GRANULAR RISK UNDERWRITING WHY MODEL TORNADO RISK? FIRST, YOU HAVE TO ANSWER:
 PURPOSE OF RMS Tool for the Insurance Industry to help with: PRICING TORNADOES: USING CAT MODELS FOR GRANULAR RISK UNDERWRITING Kevin Van Leer, Product Manager Americas Climate National Summit Oklahoma
Baldwin County, Alabama
 2015 Baldwin County, Alabama Multi-Hazard Mitigation Plan I. Comprehensive Plan A multi-jurisdiction plan City of Bay Minette City of Daphne Town of Elberta City of Fairhope City of Foley City of Gulf
GIS and Remote Sensing Support for Evacuation Analysis
 GIS and Remote Sensing Support for Evacuation Analysis Presented to GIS for Transportation Symposium Rapid City, South Dakota March 28-31, 2004 Demin Xiong Oak Ridge National Laboratory 2360 Cherahala
Exploring GIS Potential for Northwestern Ontario Land Information Ontario
 Exploring GIS Potential for Northwestern Ontario Land Information Ontario May 13, 2015 The LIO Vision LIO Vision: That all geographic information about Ontario is fully integrated and accessible LIO Goal:
RISK ASSESSMENT COMMUNITY PROFILE NATURAL HAZARDS COMMUNITY RISK PROFILES. Page 13 of 524
 RISK ASSESSMENT COMMUNITY PROFILE NATURAL HAZARDS COMMUNITY RISK PROFILES Page 13 of 524 Introduction The Risk Assessment identifies and characterizes Tillamook County s natural hazards and describes how
The Tampa Bay Catastrophic Plan Presentation to CFGIS Users Group FDOT District 5 Urban Offices - Orlando July 30, 2010
 The Tampa Bay Catastrophic Plan Presentation to CFGIS Users Group FDOT District 5 Urban Offices - Orlando July 30, 2010 Brady Smith Senior Planner Tampa Bay Regional Planning Council Introduction Recent
M 7.1 EARTHQUAKE 5KM ENE OF RABOSO, MEXICO EXACT LOCATION: N W DEPTH: 51.0KM SEPTEMBER 19, 1:14 LOCAL TIME
 M 7.1 EARTHQUAKE 5KM ENE OF RABOSO, MEXICO EXACT LOCATION: 18.584 N 98.399 W DEPTH: 51.0KM SEPTEMBER 19, 2017 @ 1:14 LOCAL TIME Photo: Eduardo Verdugo / AP Photo: Alfredo Estrella/ Agence France-Presse/
2 nd Semester. Core Courses. C 2.1 City and Metropolitan Planning. Module 1: Urban Structure and Growth Implications
 2 nd Semester Core Courses C 2.1 City and Metropolitan Planning Module 1: Urban Structure and Growth Implications Growth of cities; cities as engine of growth; urban sprawl; land value, economic attributes
Performing seismic scenarios in the Luchon-Val d Aran area, Central Pyrenees
 Performing seismic scenarios in the Luchon-Val d Aran area, Central Pyrenees 7th EUROGEO, Bologna, Italy, 12th-15th june 2012 Authors: A. Roullé (BRGM), A. Macau (IGC), S. Figueras (IGC), D. Monfort- Climent
Combination of high resolution satellite images population census statistics to estimating population exposed to risks of disaster
 Combination of high resolution satellite images population census statistics to estimating population exposed to risks of disaster Daniel Clarke (UNESCAP) Jean-Louis Weber (Consultant-UNESCAP) Disaster
National Disaster Management Centre (NDMC) Republic of Maldives. Location
 Republic of Maldives. Location") National Disaster Management Centre (NDMC) Republic of Maldives Location Country Profile 1,190 islands. 198 Inhabited Islands. Total land area 300 sq km Islands range b/w 0.2 5 sq km Population approx.
National Disaster Management Centre (NDMC) Republic of Maldives Location Country Profile 1,190 islands. 198 Inhabited Islands. Total land area 300 sq km Islands range b/w 0.2 5 sq km Population approx.
Use of GIS and Remote Sensing for risk assessment related to climate change in the Pacific
 Use of GIS and Remote Sensing for risk assessment related to climate change in the Pacific Professor Lalit Kumar University of New England, Armidale NSW AUSTRALIA Two parts to this presentation Developing
Earthquake Hazards in Douglas County
 Earthquake Hazards in Douglas County Craig M. depolo Nevada Bureau of Mines and Geology Nevada Hazard Mitigation Planning Committee August 9, 2012 Earthquake Truths The consequences of bad earthquakes
INTEGRATING CLIMATE VULNERABILITY & RISK ASSESSMENT INTO URBAN SPATIAL PLANNING PROCESS
 INTEGRATING CLIMATE VULNERABILITY & RISK ASSESSMENT INTO URBAN SPATIAL PLANNING PROCESS (CASE STUDY: BLITAR CITY, EAST JAVA, INDONESIA) SHINTA MICHIKO PUTERI, ST, MT. DR. IR. DENNY ZULKAIDI, MUP. WRITER
Earthquake Hazard Analysis Methods: A Review
 IOP Conference Series: Earth and Environmental Science PAPER OPEN ACCESS Earthquake Hazard Analysis Methods: A Review To cite this article: A M Sari and A Fakhrurrozi 2018 IOP Conf. Ser.: Earth Environ.
USING 3D GIS TO ASSESS ENVIRONMENTAL FLOOD HAZARDS IN MINA
 King Fahd University of Petroleum & Minerals College of Environmental Design Geographical Information system USING 3D GIS TO ASSESS ENVIRONMENTAL FLOOD HAZARDS IN MINA Prepared by : Ali AL-Zahrani OUTLINE
GIS = Geographic Information Systems;
 What is GIS GIS = Geographic Information Systems; What Information are we talking about? Information about anything that has a place (e.g. locations of features, address of people) on Earth s surface,
CURRENT AND FUTURE TROPICAL CYCLONE RISK IN THE SOUTH PACIFIC
 CURRENT AND FUTURE TROPICAL CYCLONE RISK IN THE SOUTH PACIFIC SOUTH PACIFIC JUNE 2013 The South Pacific region is prone to significant tropical cyclone risk. This project compared both current and future
Disaster Management in Republic of Korea
 The Third UN-GGIM-AP Plenary Meeting Disaster Management in Republic of Korea ~Coordination among NGIA & Other Related Organizations and Recommendations~ Bali Indonesia 10 November 2014 Sanghoon Lee, Ph.D.
Preliminary Earthquake Risk Management Strategy Plan of Eskisehir, Turkey by using GIS
 Preliminary Earthquake Risk Management Strategy Plan of Eskisehir, Turkey by using GIS Metin Altan, Ferah Özturk and Can Ayday Space and Satellite Sciences Research Institute Anadolu University, TURKEY
INDIANA ACADEMIC STANDARDS FOR SOCIAL STUDIES, WORLD GEOGRAPHY. PAGE(S) WHERE TAUGHT (If submission is not a book, cite appropriate location(s))
 WHERE TAUGHT (If submission is not a book, cite appropriate location(s))") Prentice Hall: The Cultural Landscape, An Introduction to Human Geography 2002 Indiana Academic Standards for Social Studies, World Geography (Grades 9-12) STANDARD 1: THE WORLD IN SPATIAL TERMS Students
Prentice Hall: The Cultural Landscape, An Introduction to Human Geography 2002 Indiana Academic Standards for Social Studies, World Geography (Grades 9-12) STANDARD 1: THE WORLD IN SPATIAL TERMS Students
Interpretive Map Series 24
 Oregon Department of Geology and Mineral Industries Interpretive Map Series 24 Geologic Hazards, and Hazard Maps, and Future Damage Estimates for Six Counties in the Mid/Southern Willamette Valley Including
Remote Sensing the Urban Landscape
 Remote Sensing the Urban Landscape Urban landscape are composed of a diverse assemblage of materials (concrete, asphalt, metal, plastic, shingles, glass, water, grass, shrubbery, trees, and soil) arranged
Performance assessment under multiple hazards
 Performance assessment under multiple hazards D. Vamvatsikos, Dept of Civil and Environmental Engineering, University of Cyprus, Cyprus E. Nigro, Dept of Structural Engineering, University of Naples Federico
Lesson 8. Natural Disasters
 Lesson 8 Natural Disasters 1 Reading is NOT a spectator sport! 2 Reading requires active participation! 3 PREDICT Try to figure out what information will come next and how the selection might end. 4 Natural
PRICING TORNADOES: USING CAT MODELS FOR GRANULAR RISK UNDERWRITING
 PRICING TORNADOES: USING CAT MODELS FOR GRANULAR RISK UNDERWRITING Kevin Van Leer, Product Manager Americas Climate National Tornado Summit Oklahoma City, OK February 24, 2015 PURPOSE OF RMS Tool for the
Earthquake Hazards in Henderson
 Earthquake Hazards in Henderson Craig M. depolo Nevada Bureau of Mines and Geology Nevada Hazard Mitigation Planning Committee November 15, 2012 Earthquake Truths The consequences of bad earthquakes to
DOWNLOAD OR READ : GIS BASED FLOOD LOSS ESTIMATION MODELING IN JAPAN PDF EBOOK EPUB MOBI
 DOWNLOAD OR READ : GIS BASED FLOOD LOSS ESTIMATION MODELING IN JAPAN PDF EBOOK EPUB MOBI Page 1 Page 2 gis based flood loss estimation modeling in japan gis based flood loss pdf gis based flood loss estimation
The Governance of Land Use
 The planning system The Governance of Land Use United Kingdom Levels of government and their responsibilities The United Kingdom is a unitary state with three devolved governments in Northern Ireland,
Climate Resilience Decision Making Framework in the Caribbean. A case of Spatial Data Management
 Climate Resilience Decision Making Framework in the Caribbean A case of Spatial Data Management Bishwa Pandey Sr. Data Management Specialist The World Bank Background The mission of The World Bank s Latin
Measuring Disaster Risk for Urban areas in Asia-Pacific
 Measuring Disaster Risk for Urban areas in Asia-Pacific Acknowledgement: Trevor Clifford, Intl Consultant 1 SDG 11 Make cities and human settlements inclusive, safe, resilient and sustainable 11.1: By
Compact guides GISCO. Geographic information system of the Commission
 Compact guides GISCO Geographic information system of the Commission What is GISCO? GISCO, the Geographic Information System of the COmmission, is a permanent service of Eurostat that fulfils the requirements
GIS Geographical Information Systems. GIS Management
 GIS Geographical Information Systems GIS Management Difficulties on establishing a GIS Funding GIS Determining Project Standards Data Gathering Map Development Recruiting GIS Professionals Educating Staff
Poverty and Hazard Linkages
 Poverty and Hazard Linkages Global Risk Identification Programme Proposal Development Coordination Meeting Friday, 19 May 2006 CIESIN Earth Institute Columbia University www.ciesin.columbia.edu Data Improvements
Climate Risk Visualization for Adaptation Planning and Emergency Response
 Climate Risk Visualization for Adaptation Planning and Emergency Response NCR Flood Fact Finding Workshop Ricardo Saavedra ricardo@vizonomy.com Social Media, Mobile, and Big Data St. Peter s Basilica,
Chapter 6. Fundamentals of GIS-Based Data Analysis for Decision Support. Table 6.1. Spatial Data Transformations by Geospatial Data Types
 Chapter 6 Fundamentals of GIS-Based Data Analysis for Decision Support FROM: Points Lines Polygons Fields Table 6.1. Spatial Data Transformations by Geospatial Data Types TO: Points Lines Polygons Fields
Application of a GIS for Earthquake Hazard Assessment and Risk Mitigation in Vietnam
 Application of a GIS for Earthquake Hazard Assessment and Risk Mitigation in Vietnam Nguyen Hong Phuong Earthquake Information and Tsunami Warning Centre, VAST OUTLINE Introduction Fault Source Model and
Copernicus EMS: Αξιολόγηση πολλαπλών φυσικών κινδύνων - Σχεδιασμός και Ανάκτηση
 Building Capacity for a Centre of Excellence for EO-based monitoring of Natural Disasters Copernicus EMS: Αξιολόγηση πολλαπλών φυσικών κινδύνων - Σχεδιασμός και Ανάκτηση Γιάννης Παπουτσής ΙΑΑΔΕΤ Εθνικό
GIS in Weather and Society
 GIS in Weather and Society Olga Wilhelmi Institute for the Study of Society and Environment National Center for Atmospheric Research WAS*IS November 8, 2005 Boulder, Colorado Presentation Outline GIS basic
Risk Identification using Hazus
 Risk Identification using Hazus City of Boston, Suffolk County, MA Dave Shortman, GISP, CFM 6/21/2016 Agenda Objective Project Location Hazus Overview Hazus Level 2 Risk Assessment Comparison and Reporting
Storm Surge/Coastal Inundation State of the Union. Jamie Rhome Storm Surge Team Lead NOAA/National Hurricane Center
 Storm Surge/Coastal Inundation State of the Union Jamie Rhome Storm Surge Team Lead NOAA/National Hurricane Center 2 Tampa: Cat 5 Scenario 3 4 The Stakes are High Combination of SLR and increasing coastal
Vulnerability of Bangladesh to Cyclones in a Changing Climate
 Vulnerability of Bangladesh to Cyclones in a Changing Climate Susmita Dasgupta Kiran Pandey Mainul Huq Zahirul Huq Khan M.M. Zahid Ahmed Nandan Mukherjee Malik Fida Khan 2010 Bangladesh: Tropical Cyclone
Predicting Tsunami Inundated Area and Evacuation Road Based On Local Condition Using GIS
 IOSR Journal of Environmental Science, Toxicology and Food Technology (IOSR-JESTFT) ISSN: 2319-2402, ISBN: 2319-2399. Volume 1, Issue 4 (Sep-Oct. 2012), PP 05-11 Predicting Tsunami Inundated Area and Evacuation
SECTION 6 VULNERABILITY ASSESSMENT
 SECTION 6 VULNERABILITY ASSESSMENT This section identifies and quantifies the vulnerability of the MEMA District 1 Region to the significant hazards identified in the previous sections (Hazard Identification
World Geography. WG.1.1 Explain Earth s grid system and be able to locate places using degrees of latitude and longitude.
 Standard 1: The World in Spatial Terms Students will use maps, globes, atlases, and grid-referenced technologies, such as remote sensing, Geographic Information Systems (GIS), and Global Positioning Systems
International Conference Analysis and Management of Changing Risks for Natural Hazards November 2014 l Padua, Italy
 Abstract Code: B01 Assets mapping products in support of preparedness and prevention measures (examples from Germany, Italy and France) Marc Mueller, Thierry Fourty, Mehdi Lefeuvre Airbus Defence and Space,
Earthquake Risk in Canada and the National Building Code
 Earthquake Risk in Canada and the National Building Code Tuna Onur, Ph.D. Onur Seemann Consulting, Inc. NICC, Vancouver, BC, 28-30 September 2016 Southwestern Canada: Cascadia Subduction Zone + Crustal
Module 3 Educator s Guide Overview
 Module 3 Educator s Guide Overview Human footprints on Earth as seen by NASA scientists Module Overview This module draws upon NASA images and research to introduce students to the various ways humans
The World Bank Ecuador Risk Mitigation and Emergency Recovery Project (P157324)
") Public Disclosure Authorized LATIN AMERICA AND CARIBBEAN Ecuador Social, Urban, Rural and Resilience Global Practice Global Practice IBRD/IDA Investment Project Financing FY 2016 Seq No: 2 ARCHIVED on
Public Disclosure Authorized LATIN AMERICA AND CARIBBEAN Ecuador Social, Urban, Rural and Resilience Global Practice Global Practice IBRD/IDA Investment Project Financing FY 2016 Seq No: 2 ARCHIVED on
HIGH RESOLUTION SATELLITE IMAGERY NEW PERSPECTIVES FOR THE EARTHQUAKE RISK MANAGEMENT
 HIGH RESOLUTION SATELLITE IMAGERY NEW PERSPECTIVES FOR THE EARTHQUAKE RISK MANAGEMENT Lucian CHIROIU Denis Diderot University, Pôle Image Laboratory Paris, France Geosciences Consultants Paris, France