How we made the maps. By Chris Walker. Map US Coast Survey
|
|
|
- Edward Lee
- 5 years ago
- Views:
Transcription

1 How we made the maps By Chris Walker Map US Coast Survey Map US Coast Survey registered to Open Street Map, with landmark and historical resource boundaries.

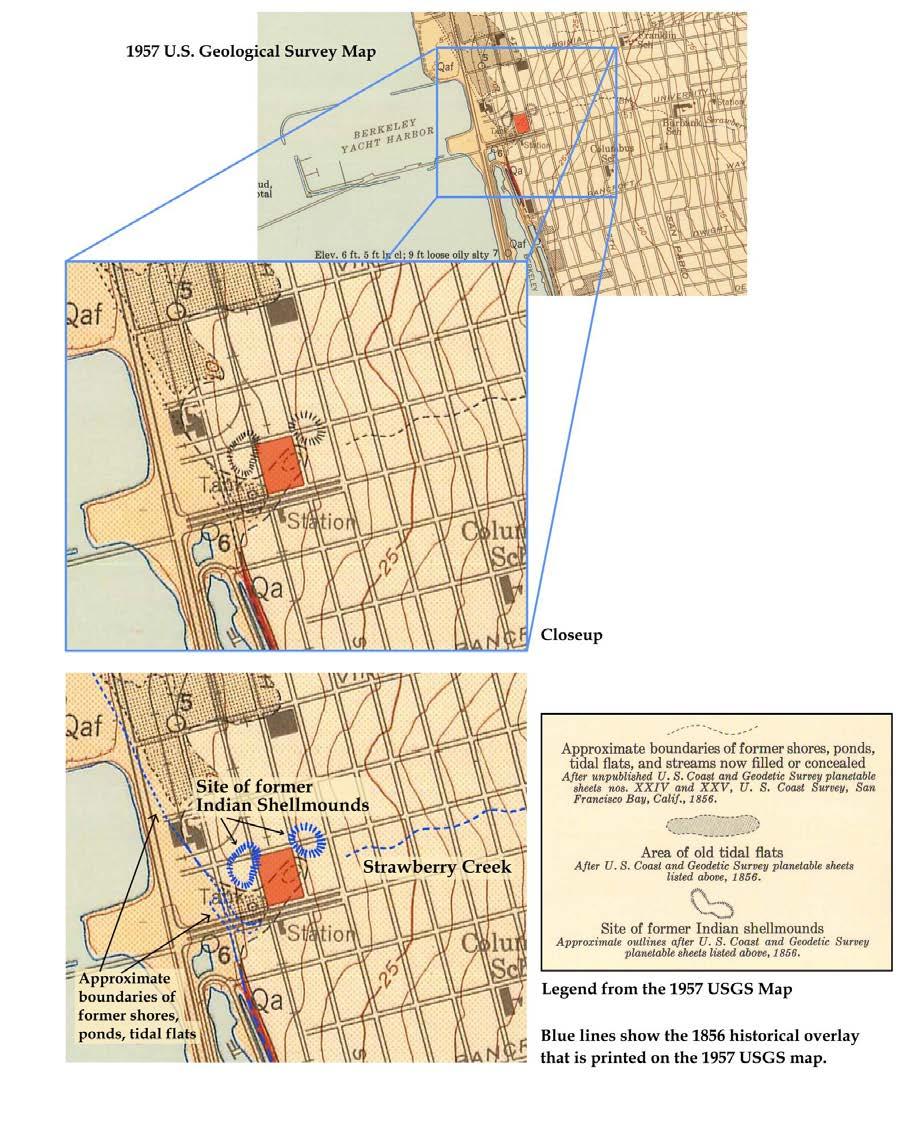
2 We started with a map that was presented by Morrison and Foerster, the lawyers for Blake Griggs Properties, the developers who are proposing to build 260 apartments and 28,000 square feet of retail on the West Berkeley Shellmound Landmark site at th Street in Berkeley. In the lawyer s letter defending the Draft Environmental Impact Report, the following map appears as Exhibit C. Map 3 - Exhibit C - Comment letter from Morrison and Foerster, 1900 Fourth Street Project Draft Environmental Impact Report. This map shows two mounds indicated as hatched circles on either side of the Spenger s parking lot. What is unique about this map is that it has historical line work superimposed on a modern street grid. This map was created by the U.S. Geological Survey (USGS) in 1957, with the exception of the orange rectangle that was added by the developer to indicate the th street project site.
3


4 In the legend of the 1957 U.S. Geological Survey map, the boundaries of the former shorelines, the streams, the tidal flats, and the Indian shellmounds, are indicated as being referenced from an entirely different map, specifically the U. S. Coast and Geodetic Survey planetable sheets nos. XXIV and XXV, U. S. Coast Survey, San Francisco Bay, Calif., From the Legend on the 1957 USGS Map. Everything that we were interested in The Shellmounds, the Original Shores, Ponds and Tidal flats had been superimposed onto this new 1957 map from another, older, unpublished US Coast Survey Map from I found a clean digital copy of the 1856 U. S. Coast Survey at the National Oceanic and Atmospheric Administration (NOAA) historic maps library. The technical name for this map is T-sheet 591 ( T for Topographic). Title section of the 1856 US Coast Survey map.

5 The 1856 Coast Survey source map includes significant details that do not appear in the 1957 USGS Map shown on page 2 and 3 above. The shellmounds actually have topographic lines on them, and they are surrounded by a riparian landscape along Strawberry Creek. The detailing of the peninsula at the mouth of Strawberry creek is more clearly defined. And spot elevation data is written in pencil for the early structures. Map 4 - Detail of the 1856 US Coast Survey Map. I inserted this recently recovered unpublished source map back into the 1957 USGS map, creating the map that appears on the next page.

6 Map 5 - When the shellmounds (in yellow) from the 1856 map are superimposed onto the 1957 USGS map, you can see that the westerly mound significantly overlaps the Spenger s parking lot in the northwest corner. Here is the process I followed to create the 15-map sequence of the history of this site: To achieve the highest accuracy possible for registering these maps to one another, a wide set of landmarks were identified in common to each map. The further these landmarks are away from each other, the more accurate the rotational and spatial registration will be. In this case, I identified landmarks from Fleming Point in the north, to the Emeryville Shellmound in the south, and several landmarks inbetween. (See Map 7 below.) I used three frames of reference for landmarks; 1) The landmarks that the surveyors used in ) The Coastline, Creeks and Roads. 3) The local landmarks closest to the site, specifically, Jacob s Landing and Railroad Spur, and the small peninsula comprised of alluvial deposition that had built up at the mouth of Strawberry Creek.

7 Surveyors Landmarks The U.S. Coast Survey map makers used recognizable high points and monuments in the landscape as surveying base stations for triangulating positions and distances. These base stations were measured against each other to create highest possible degree of accuracy. Map 6 - Triangulation map of the San Francisco Bay, 1882

8 The triangulation map above was created in 1882, at a time when surveyors were using prominent industrial features such as spires and smokestacks as well as geographic features, such as the top of Yerba Buena Island, as reference points for their trigonometric calculations. The accuracy of these early coast surveys is comparable to modern mapping techniques. As quoted in Triangulating Archeological Landscapes by Scott Byram (page 17): The triangulation from the Pulgas Base (35 miles south of San Francisco) to the Yolo base exceeded its true length by.35 meters, a difference which is equivalent to about 1/50,0000 of the actual length. In other words, a measurement between the two bases was so accurate that the error was one foot across 10 miles.

9 Map 7 - The map above shows the 1957 US Geological Survey (the Developer s exhibit) with the 1856 T-sheet registered, at 50% transparency, with close-up insets of each of the four base stations used as landmarks.

10 The Coastline, Creeks and Roads Map 8 - The 1957 US Geology Survey with, The Coast line, The Creeks, and San Pablo Blvd. highlighted.
11 Map 9 - The same landmarks from the 1957 USGS map above, superimposed onto the 1856 US Coast Survey.

12 Map 10 - The coincidence of landmarks highlighted in pink, between the 1957 US Geological Survey map and the 1856 Coast Survey map.

13 Local Landmarks Two local landmarks, the peninsula at the mouth of Strawberry Creek, and Jacob s Landing, are lined up and corroborated on multiple maps. Maps 11 - Knowing that these two landmarks are stable over time gives us confidence to use them as landmarks for registration between the 1957 USGS and 1856 US Coast Survey maps. After registering the 1856 Coast Survey to the 1957 USGS map, using all of the methods above, o The Surveyors landmarks, o The Coastline, Creeks and Streets, o Local landmarks, We can now systematically create a contemporary map with a more precise Shellmound footprint.

14 Map 12 - Starting with the 1957 USGS map, Local Landmarks annotated. Map 13 - The map above is the same 1957 Geological Survey map, but with its historical data highlighted. Specifically, the historical coastline in red, and Strawberry Creek in blue.


15 Map 14 - The map above is the 1856 US Coast Survey, registered and superimposed onto the 1957 U.S Geological Survey map. Note that Jacob s Landing, the Coastline, Strawberry Creek, and the peninsula at the mouth of the creek, are all lining up. Map 16 - After registering the 1856 Coast Survey, the Shellmounds are highlighted in yellow.

16 Map 17 - The street grid from the 1957 Geological Survey along with Spenger s parking lot are highlighted in red. Local registration between the 1957 USGS and 1856 USCS maps is shown in pink. Map 18 - Finally, 2018 OpenStreeetMap is then registered to the 1957 USGS street grid. The Shellmounds from the 1856 US Coast Survey are registered to a modern street grid using all three landmark registration methods outlined above.
17 With contemporary streets we can now see how the Berkeley City landmark and historical resource boundaries are embracing the shellmound footprints. The Spenger s parking lot is at the center of one of the most valuable historical resources in the state of California. And the 1856 Coast Survey re-inserted into the 1957 USGS map shows that the western shellmound is overlapping the Spenger s parking lot in the northwest corner. Based on the research above, we know that the US Coast Survey team utilized the most accurate mapping techniques of its time. And that the accuracy they achieved is comparable to modern mapmaking. We also know that the local landmarks used for alignment were stable for at least 30 years. Lastly, we owe a debt of gratitude to David Kerr, the surveyor who drew the 1856 T- sheet, who lovingly set out to document the West Berkeley Shellmound and ecosystem. The accuracy of the shape of the mounds and the 20-foot topo line speaks for itself.
1. The topographic map below shows a depression contour line on Earth's surface.
 1. The topographic map below shows a depression contour line on Earth's surface. Points A, B, C, and D represent surface locations. Contour line elevations are in feet. Which profile best shows the topography
Geology 101 Lab Worksheet: Topographic Maps
 Geology 101 Lab Worksheet: Topographic Maps Name: Refer to the Topographic Maps Lab for the information you need to complete this worksheet (http://commons.wvc.edu/rdawes/g101ocl/labs/topomapslab.html).
Preliminary Data Release for the Humboldt Bay Sea Level Rise Vulnerability Assessment: Humboldt Bay Sea Level Rise Inundation Mapping
 Preliminary Data Release for the Humboldt Bay Sea Level Rise Vulnerability Assessment: Humboldt Bay Sea Level Rise Inundation Mapping Prepared by: Jeff Anderson, Northern Hydrology & Engineering (jeff@northernhydrology.com)
Compass Basics. Quick Map Basics Review For Compass Use
 Compass Basics Quick Map Basics Review For Compass Use A topographic map tells you where things are and how to get to them, whether you're hiking, biking, hunting, fishing, or just interested in the world
Navigating with Map & Compass. Nevada County Sheriff s Search & Rescue
 Navigating with Map & Compass Nevada County Sheriff s Search & Rescue Objectives Very Practical Teach you how to go from point A to point B Go from the wilderness (real world) to a map and visa versa Agenda
Notes and Summary pages:
 Topographic Mapping 8.9C Interpret topographical maps and satellite views to identify land and erosional features and predict how these shapes may be reshaped by weathering ATL Skills: Communication taking
Topographic Maps. More than a Road Map
 Topographic Maps More than a Road Map What is a Topographic Map? Scaled representation of features on the surface of the Earth such as roads, rivers, and plains Provides information about land elevations
APPENDIX A GLOSSARY. Appendix A.1
 APPENDIX A GLOSSARY Appendix A.1 Appendix A.2 Back Bearing A back bearing is measured from the object to your position. It is the exact opposite of a direct bearing. Base Line An imaginary line on the
What is a map? A Map is a two or three-dimensional model or representation of the Earth s surface. 2-Dimensional map
 What is a map? A Map is a two or three-dimensional model or representation of the Earth s surface. 2-Dimensional map What is a Map Projection? Planar Projection Projection A Projection is a mathematical
Date: UNI. world. *Dedicated to
 Name: Date: UNI IT THREE 2D and 3D model s of the natural world *Dedicated to Name: Date: ABSTRACT T AND RATIONALE A topographic map is a type of map that depicts the detail and quantitative representation
5. The topographic map below shows a lake and two rivers.
 Mapping A B1 1. The diagram below shows latitude measurements every 10 degrees and longitude measurements every 15 degrees. What is the latitude and longitude of point X? 5. The topographic map below shows
Where, on Earth, are you?
 Where, on Earth, are you? We all live on a big planet called Earth, of course. But where on Earth? And if you want to go to a different spot on Earth other than the spot you are in, how do you know which
CAUSES FOR CHANGE IN STREAM-CHANNEL MORPHOLOGY
 CAUSES FOR CHANGE IN STREAM-CHANNEL MORPHOLOGY Chad A. Whaley, Department of Earth Sciences, University of South Alabama, MobileAL, 36688. E-MAIL: caw408@jaguar1.usouthal.edu The ultimate goal of this
Measuring Planet Earth Regents Review. 2. State the altitude of Polaris as seen by an observer at the North Pole.
 Name Measuring Planet Earth Regents Review ase your answers to questions 1 through 3 on the diagram below, which represents a north polar view of Earth on a specific day of the year. Solar times at selected
Topographic Maps and Landforms Geology Lab
 Topographic Maps and Landforms Geology Lab Ray Rector: Instructor Today s Lab Activities 1) Discussion of Last Week s Lab 2) Lecture on Topo Maps and Elevation Contours 3) Construct Topographic Maps and
Basic Map Skills for the Outdoors
 Geography 80-20 80% of what there is to know, for 20% of the sweat Basic Map Skills for the Outdoors Map Scale Map source: US Geological Survey Four ways to indicate map scale: Representative fraction
Mapping Earth. How are Earth s surface features measured and modeled?
 Name Mapping Earth How are Earth s surface features measured and modeled? Before You Read Before you read the chapter, think about what you know about maps Record your thoughts in the first column Pair
UNIT 1C. USING TOPOGRAPHIC MAPS WHERE IN THE WORLD... ARE YOU?
 UNIT 1C. USING TOPOGRAPHIC MAPS WHERE IN THE WORLD... ARE YOU? TIME 60-90 minutes LEVEL All BENCHMARKS Next Generation Science Standards MS-LS1.D Science & Engineering Practices Developing and Using Models
LESSON 2: INTRODUCTION TO TOPOGRAPHICAL MAPS
 LESSON 2: INTRODUCTION TO TOPOGRAPHICAL MAPS Finding your way if you become separated from a group. PURPOSE This lesson presents an overview of topographic maps. It describes their characteristics and
THE MAMMOTH "EARTHQUAKE FAULT" AND RELATED FEATURES IN MON0 COUNTY, CALIFORNIA* By H. BENIOFF and B. GUTENBERG
 THE MAMMOTH "EARTHQUAKE FAULT" AND RELATED FEATURES IN MON0 COUNTY, CALIFORNIA* By H. BENIOFF and B. GUTENBERG IN UNDERTAKING this work it was our intention to investigate the well-known "Earthquake Fault"
Regents Earth Science Unit 1 Earth Dimensions
 Regents Earth Science Unit 1 Earth Dimensions www. BarnesWeb.org 2014-15 edition Name: Name: OBJECTIVES Correctly define: isolines, gradient, topographic map, contour interval, hachured lines, profile,
CHAPTER 28. PHYSIOGRAPHY Cook Inlet Drainages
 PEBBLE PROJECT ENVIRONMENTAL BASELINE DOCUMENT 2004 through 2008 CHAPTER 28. PHYSIOGRAPHY Cook Inlet Drainages PREPARED BY: Knight Piésold Ltd. PHYSIOGRAPHY COOK INLET DRAINAGES TABLE OF CONTENTS TABLE
1/28/16. EGM101 Skills Toolbox. Map types. Political Physical Topographic Climate Resource Road. Thematic maps (use one of the above as backdrop)
") EGM101 Skills Toolbox Map types Political Physical Topographic Climate Resource Road Thematic maps (use one of the above as backdrop) Map Types Deriving information from maps Hydrographic Geological Soils
EGM101 Skills Toolbox Map types Political Physical Topographic Climate Resource Road Thematic maps (use one of the above as backdrop) Map Types Deriving information from maps Hydrographic Geological Soils
2 Mapping Earth Reading Essentials. 2. Contrast What is the difference between a map view and a profile view?
 Mapping Earth Maps What do you think? Read the three statements below and decide whether you agree or disagree with them. Place an A in the Before column if you agree with the statement or a D if you disagree.
GEOL 380: Earthquake Hazards in the Puget Sound Region (in class and assignment) Due in class Wednesday, Nov 109th
 Due in class Wednesday, Nov 109th") GEOL 380: Earthquake Hazards in the Puget Sound Region (in class and assignment) Due in class Wednesday, Nov 109th The purpose of this exercise/assignment is for you to gain practice and experience in
GEOL 380: Earthquake Hazards in the Puget Sound Region (in class and assignment) Due in class Wednesday, Nov 109th The purpose of this exercise/assignment is for you to gain practice and experience in
UNITED NATIONS E/CONF.96/CRP. 5
 UNITED NATIONS E/CONF.96/CRP. 5 ECONOMIC AND SOCIAL COUNCIL Eighth United Nations Regional Cartographic Conference for the Americas New York, 27 June -1 July 2005 Item 5 of the provisional agenda* COUNTRY
LOCATING THE WASHINGTON MONUMENT GEODETIC BASE IN THE ISLAND OF GRAND CANARY MEASURED BY THE HYDROGRAPHIC EXPEDITION OF THE ARCHIPELAGO
 LOCATING THE WASHINGTON MONUMENT (Reproduced from. Geodetic Letter N 2, published in February 1935 by U. S. Coast and Geodetic Survey). On November 19, 1934, work was begun to permanently and accurately
LOMR SUBMITTAL LOWER NESTUCCA RIVER TILLAMOOK COUNTY, OREGON
 LOMR SUBMITTAL LOWER NESTUCCA RIVER TILLAMOOK COUNTY, OREGON Prepared for: TILLAMOOK COUNTY DEPARTMENT OF COMMUNITY DEVELOPMENT 1510-B THIRD STREET TILLAMOOK, OR 97141 Prepared by: 10300 SW GREENBURG ROAD,
Different types of maps and how to read them.
 Different types of maps and how to read them. A map is a picture or representation of the Earth's surface, showing how things are related to each other by distance, direction, and size. Maps have been
EROSIONAL FEATURES. reflect
 reflect Have you ever looked at the land around you and wondered what processes shaped what you see? Perhaps you see mountains, valleys, rivers, or canyons. Do you know how long these geologic features
Map Skills Unit. Note taking unit
 Map Skills Unit Note taking unit Introduction To learn about the Earth, we are going to learn about two geographic tools you can use.globes and maps. Globe A globe is a round model of the planet Earth
What Is a Globe? Hemispheres. Main Idea Globes and maps provide different ways of showing features of the earth. Terms to Know
 r Main Idea Globes and maps provide different ways of showing features of the earth. Terms to Know hemisphere latitude longitude scale bar scale relief elevation contour line What Is a Globe? A globe is
B. Topographic maps are also called. contour maps
 Topographic Maps Introduction A. Topographic maps are essential tools in geologic and engineering studies because they show the configuration of Earth's surface in remarkable detail and permit one to measure
Appendix I-1: Archaeological Records Search
 Appendix I-1: Archaeological Records Search South Central Coastal Information Center California State University, Fullerton Department of Anthropology MH-426 800 North State College Boulevard Fullerton,
Mapping of Future Coastal Hazards. for Southern California. January 7th, David Revell, Ph.D. E.
 Mapping of Future Coastal Hazards for Southern California January 7th, 2014 David Revell, Ph.D. drevell@esassoc.com E. Vandebroek, 2012 Outline Coastal erosion hazard zones Flood hazard zones: Coastal
1. Identify the Earth motion that provides the basis for our system of local time and time zones.
 Base your answers to questions 1 through 4 on the map below and on your knowledge of Earth science. The map shows the four time zones and some latitude and longitude lines across the continental United
Delineation of high landslide risk areas as a result of land cover, slope, and geology in San Mateo County, California
 Delineation of high landslide risk areas as a result of land cover, slope, and geology in San Mateo County, California Introduction Problem Overview This project attempts to delineate the high-risk areas
Sacred Lands File & Native American Contacts List Request
 Sacred Lands File & Native American Contacts List Request NATIVE AMERICAN HERITAGE COMMISSION 915 Capitol Mall, RM 364 Sacramento, CA 95814 (916) 653-4082 (916) 657-5390 Fax nahc@pacbell.net Information
8 th 12 th Designing a Monitoring Plan Mapping & Analysis (Activities 1 2)
") 8 th 12 th Designing a Monitoring Plan Mapping & Analysis (Activities 1 2) Objectives for All Activities - To be able to define and describe the purpose and uses of topographic maps. - To define rules
8 th 12 th Designing a Monitoring Plan Mapping & Analysis (Activities 1 2) Objectives for All Activities - To be able to define and describe the purpose and uses of topographic maps. - To define rules
Draft exercise for share fair at Bozeman workshop only. This exercise is not ready for distribution. Please send helpful suggestions to
 Draft exercise for share fair at Bozeman workshop only. This exercise is not ready for distribution. Please send helpful suggestions to foleyd@plu.edu Figure list 1. Trailer photograph 2. Location map
Finding Fault Geologic History from a Road Cut
 Finding Fault Geologic History from a Road Cut Elisabeth M. Price, DD LaPointe, and Jonathan G. Price 4 July 2005 Introduction Earth science is an important science to present to students because it directly
MAPS AND THEIR CLASSIFICATION
 MAPPING MAPS AND THEIR CLASSIFICATION WHAT IS A MAP? A map is representation of the Earth's surface, showing how things are related to each other by distance, direction, and size. Maps are a way of showing
Development and Land Use Change in the Central Potomac River Watershed. Rebecca Posa. GIS for Water Resources, Fall 2014 University of Texas
 Development and Land Use Change in the Central Potomac River Watershed Rebecca Posa GIS for Water Resources, Fall 2014 University of Texas December 5, 2014 Table of Contents I. Introduction and Motivation..4
Decoding Topographic Maps
 Name: Date: 1. Base your answer(s) to the following question(s) on the topographic map below and on your knowledge of Earth science. Letters A through F represent locations on the map. What is the contour
Map 4: Cowal Peninsula: Cluniter to Ardyne Point Map Content Descriptions
 Map 4: Cowal Peninsula: Cluniter to Ardyne Point Map Content Descriptions 1. Built Heritage and Archaeology A total of twenty four sites were recorded in the area covered by Map 4. Of these six were previously
Town of Chino Valley. Survey Control Network Report. mgfneerhg mc N. Willow Creek Road Prescott AZ
 Town of Chino Valley Survey Control Network Report mgfneerhg mc. 2050 N. Willow Creek Road Prescott AZ 86301 928-771-2376 Page 1 of 70 Table of Contents Town of Chino Valley Survey Datum Outline A short
Great California Delta Trail Blueprint for Contra Costa and Solano Counties GIS AND MAPPING MEMORANDUM JULY 2010
 Great California Delta Trail Blueprint for Contra Costa and Solano Counties GIS AND MAPPING MEMORANDUM JULY 2010 {DRAFT} July 2010 Introduction Geographic Information Systems (GIS) are computer-based
COASTAL FLOODING IMPACT REPORT (100-YEAR RETURN PERIOD EVENT) CORDECO DISCOVERY BAY RESORT & MARINA BO. ESPINAL, AGUADA, P.R.
 CORDECO DISCOVERY BAY RESORT & MARINA BO. ESPINAL, AGUADA, P.R.") COASTAL FLOODING IMPACT REPORT (100-YEAR RETURN PERIOD EVENT) CORDECO DISCOVERY BAY RESORT & MARINA BO. ESPINAL, AGUADA, P.R. submitted to CORDECO NORTHWEST CORP. 2305 LAUREL ST. SAN JUAN, P.R. 00913 by
COASTAL FLOODING IMPACT REPORT (100-YEAR RETURN PERIOD EVENT) CORDECO DISCOVERY BAY RESORT & MARINA BO. ESPINAL, AGUADA, P.R. submitted to CORDECO NORTHWEST CORP. 2305 LAUREL ST. SAN JUAN, P.R. 00913 by
Model Setup IDM Vol 2: Process Model
 Model Setup IDM Vol 2: Process Model Gateway to Melbourne, Australia. Source: Fender Katsalidis, Architects Version 1.4 27 June 2017 Contents Model Setup Exchange Scenarios... 1 Overview... 1 Project Roles...
Parts of a Map. Map Skills. The Title. There are 4 main parts of a map: The Title The Compass Rose The Map Key The Scale
 Map Skills Parts of a Map There are 4 main parts of a map: The Title The Compass Rose The Map Key The Scale The Title The title of the map is usually at the top and describes the topic of the map Example:
Road Scholar. Williamette Valley Invitational Practice Tournament
 Road Scholar Williamette Valley Invitational Practice Tournament Rules for this Event As you complete this event, enter your answers on the online data sheet. You may click "submit" when done and quietly
2. What type of rocks would you expect in this area, based on the topography? What is your reasoning?
 Geology 101 Bonus Lab Name Topographic maps are useful in helping us interpret the history of the landscape of an area. The questions below are designed to help you learn to interpret topographic maps.
The Tacoma Mountaineers Wilderness Navigation
 The Tacoma Mountaineers Wilderness Navigation Navigation Fundamentals Navigation in mountainous terrain and wilderness areas requires a set of skills, of which using a map and compass is only one part.
The Geology of Sebago Lake State Park
 Maine Geologic Facts and Localities September, 2002 43 55 17.46 N, 70 34 13.07 W Text by Robert Johnston, Department of Agriculture, Conservation & Forestry 1 Map by Robert Johnston Introduction Sebago
GEOMATICS ENGINEERING / SURVEYING
 1 GEOMATICS ENGINEERING / SURVEYING CHAPTER 1 Dr. Muhammad Ashraf Javid Assistant Professor Department of Civil and Environmental Engineering Email: muhammad.javid@unizwa.edu.om 2 Geomatics Engineering
Module 7, Lesson 1 Water world
 Module 7, Lesson 1 Water world Imagine that the year is 2100. Scientists have determined that the rapidly warming climate of the earth will cause the ice sheets of Antarctica to break apart and melt at
Create A Watershed Profile
 Name Date Follow the steps below with Chesapeake Bay FieldScope to create a watershed profile for your location. Part 1. Take a trip down your tributaries. Create A Watershed Profile 1. Find your field
CASE STUDY #9 - Brushy Fork Dam, Sugar Grove, West Virginia
 CASE STUDY #9 - Brushy Fork Dam, Sugar Grove, West Virginia Brushy Fork Dam is a flood control structure built by the Soil Conservation Service southeast of the city of Franklin in Pendleton County, West
Butte County Fire Department
 Butte County Fire Department Basic Land Navigation Verification Sheet I verify that Print Supervisor s name has completed the Print Employee s name Basic Land Navigation self study guide on. Date Attached
Module 7, Lesson 1 Water world
 Module 7, Lesson 1 Water world Imagine that the year is 2100. Scientists have determined that the rapidly warming climate of the earth will cause the ice sheets of Antarctica to break apart and melt at
Map and Compass Skills
 Map and Compass Skills Grade levels: 5-12 In a Nutshell Given a map and compass, students will be able to find a location on the map, chart a course to that location with the compass, and find that location
Unit 1 Physical Setting
 Unit 1 Physical Setting Chapter 1: Finding Your Way Chapter 2: Our Natural Environment Chapter 3: The Changing Weather Chapter 4: A Place To Live Chapter 1: Finding Our Way Key Terms Lines of Latitude
CE 311. Elementary & Higher Surveying
 CE 311 Elementary & Higher Surveying Surveying Concept What do surveyors do? What do surveyors measure? What distances do surveyors measure? What angles do surveyors measure? What positions do surveyors
Boundary Expansion of Thunder Bay National Marine Sanctuary; Correction and Expansion of Fagatele Bay National Marine
 This document is scheduled to be published in the Federal Register on 12/23/2015 and available online at http://federalregister.gov/a/2015-32265, and on FDsys.gov Billing Code 3510-NK-P DEPARTMENT OF COMMERCE
Ice Sheets and Sea Level -- Concerns at the Coast (Teachers Guide)
") Ice Sheets and Sea Level -- Concerns at the Coast (Teachers Guide) Roughly 153 million Americans (~53% of the US population) live in coastal counties. World wide some 3 billion people live within 200 km
Ice Sheets and Sea Level -- Concerns at the Coast (Teachers Guide) Roughly 153 million Americans (~53% of the US population) live in coastal counties. World wide some 3 billion people live within 200 km
Highland Lake Bathymetric Survey
 Highland Lake Bathymetric Survey Final Report, Prepared For: The Town of Highland Lake 612 Lakeshore Drive Oneonta, AL 35121 Prepared By: Tetra Tech 2110 Powers Ferry Road SE Suite 202 Atlanta, GA 30339
Geography and Earth Science. Unit 5
 Geography and Earth Science Unit 5 Chapter 1 Map Skills Lesson 2 Introduction to Maps Key Terms What You Will Learn to Do Use map reading skills bar scale contrast elevation intermittent landforms legend
Frequently Asked Questions about MnDOT s Railroad Map Conversion Project
 Frequently Asked Questions about MnDOT s Railroad Map Conversion Project What were the main objectives of the project? What are the results and end products? What can these railroad maps be used for? Who
4.3 CULTURAL RESOURCES
 4.3 CULTURAL RESOURCES This section of the EIR analyzes the proposed project s potential impacts on archaeological and paleontological resources. This analysis summarizes the findings of the Archaeological
POLAR WEEKEND SHRINKING ICE SHEETS AND RISING SEA LEVEL
 POLAR WEEKEND SHRINKING ICE SHEETS AND RISING SEA LEVEL TOPIC: Shrinking Ice Sheets and Rising Sea Levels PROJECT PERSONNEL: Dr. Robert Bindschadler, Glaciologist, NASA Scientists provide information on
Topographic Maps and Profiles
 Name: Date: Period: Earth Science Foundations The Physical Setting: Earth Science CLASS NOTES! Topographic Maps [contour maps] -! Topographic maps show three-dimensional shapes in two dimensions Elevation
Elevations are in meters above mean sea level. Scale 1:2000
 12.001 LAB 7: TOPOGRAPHIC MAPS Due: Monday, April 11 PART I: CONTOURING AND PROFILES (20 PTS) 1. Contour this area map using a 5 meter contour interval. Remember some fundamental rules of contour lines,
Underwater Parks: Three Case Studies, and a Primer on Marine Boundary Issues. Robert E. Johnson Leland F. Thormahlen
 Robert E. Johnson Leland F. Thormahlen Underwater Parks: Three Case Studies, and a Primer on Marine Boundary Issues Unlike boundaries on land, most marine boundaries are not marked with monuments or fences.
Use of Elevation Data in NOAA Coastal Mapping Shoreline Products. Coastal GeoTools April 1, 2015
 Use of Elevation Data in NOAA Coastal Mapping Shoreline Products Coastal GeoTools April 1, 2015 - NOAA s Coastal Mapping Program & CUSP - Shoreline Uses, Delineation Issues, Definitions - Current Extraction
About places and/or important events Landmarks Maps How the land is, hills or flat or mountain range Connected to maps World Different countries
 What do you think you know about geography? About places and/or important events Landmarks Maps How the land is, hills or flat or mountain range Connected to maps World Different countries What do you
Magnitude 6.9 GULF OF CALIFORNIA
 A pair of strong earthquakes struck off the coast of Mexico early Thursday only minutes apart. The magnitude 6.9 and 6.2 were centered about 85 miles northeast of Guerrero Negro in the Mexican state of
Using Map and Compass Together
 Using Map and Compass Together In situations where you foresee a potential evacuation on foot, where there are no roads, and no indication as to the direction of travel (i.e., road signs), it is recommended
Name: Mid-Year Review #2 SAR
 Name: Mid-Year Review #2 SAR Base your answers to questions 1 through 3 on on the diagram below, which shows laboratory materials used for an investigation of the effects of sediment size on permeability,
Approximately how many inches of average yearly precipitation does Rochester, New York, receive?
 1. Base your answer to the following question on the isoline map below, which shows the average yearly precipitation, in inches, across New York State. Approximately how many inches of average yearly precipitation
Phase 1 Cards. Phase 1. Phase 1. How many picnic areas does the park have? Write the answer near the legend.
 S T U D E N T H A N D O U T F Cards Write the map s title in the northwest corner above the map. How many picnic areas does the park have? Write the answer near the legend. 1 2 Draw a compass rose near
Navigating for Scouts A Self-teaching Guide to Navigation with Map and Compass
 Don Burgess, November 2003 Materials topographic maps Navigating for Scouts A Self-teaching Guide to Navigation with Map and Compass metric ruler orienteering compass 30 M/5 Hamilton-Burlington 41 I/13
Lab # - Ocean Bottom Topography. Background Information:
 Name Lab Grade /10 Date Period Lab # - Ocean Bottom Topography Background Information: Ocean depth varies markedly from one location to another. Over large areas water depth is less than 200m (650 ft);
10-1 L E S S O N M A S T E R. Name. Vocabulary. 1. Refer to the diagram at the right. Fill in the blank. a. The leg adjacent to is.
 L E S S O N M S T E R Vocabular 10 Questions on SPUR Objectives 1. Refer to the diagram at the right. Fill in the blank. a. The leg adjacent to is. b. The leg opposite is. c. The hpotenuse is. C 2. Fill
Geographers Tools: Maps and their Parts
 MP MKIG Geographers Tools: Maps and their Parts Prof. nthony Grande Hunter ollege Geography Lecture design, content and presentation FG 0616. Individual images and illustrations may be subject to prior
LOMR SUBMITTAL LOWER NEHALEM RIVER TILLAMOOK COUNTY, OREGON
 LOMR SUBMITTAL LOWER NEHALEM RIVER TILLAMOOK COUNTY, OREGON Prepared for: TILLAMOOK COUNTY DEPARTMENT OF COMMUNITY DEVELOPMENT 1510-B THIRD STREET TILLAMOOK, OR 97141 Prepared by: 10300 SW GREENBURG ROAD,
Streams in the Ranching Country of South Texas
 Streams in the Ranching Country of South Texas Watershed Analysis of HUC 12110207 Sandranell Moerbe CE GIS in Water Resources Fall 2015 INTRODUCTION This project investigates the portion of South Texas
NAME DATE TOPOGRAPHIC MAPS. Activity 1: Topographic Map Investigation I: More Than a Road Map
 NAME DATE PARTNER(S) TOPOGRAPHIC MAPS Now you have seen how topographic maps can be generated to present the elevation of a terrain. Let s look at some topographic maps and learn how to interpret them.
Geology 109L Lab 3: Modern Sedimentary Environments --Field Trip to Bodega Bay--
 Geology 109L Lab 3: Modern Sedimentary Environments --Field Trip to Bodega Bay-- Goal: The purpose of this lab is to recognize characteristics of modern sedimentary environments, which will aid you in
What is a map? Understanding your map needs
 What is a map? A map is simply a drawing or picture of a landscape or location. Maps usually show the landscape as it would be seen from above, looking directly down. As well as showing the landscape of
1. Label a few examples of lines of latitude and lines of longitude on the globe above left.
 Oceanography 2 Location, Direction, and Distance on Nautical Charts Please read Appendix III in the textbook for reference. Learning Objectives for the first nautical chart Lab 1. Use the latitude-longitude
UPPER COSUMNES RIVER FLOOD MAPPING
 UPPER COSUMNES RIVER FLOOD MAPPING DRAFT BASIC DATA NARRATIVE FLOOD INSURANCE STUDY SACRAMENTO COUTY, CALIFORNIA Community No. 060262 November 2008 Prepared By: CIVIL ENGINEERING SOLUTIONS, INC. 1325 Howe
2 Georgia: Its Heritage and Its Promise
 TERMS region, erosion, fault, elevation, Fall Line, aquifer, marsh, climate, weather, precipitation, drought, tornado, hurricane, wetland, estuary, barrier island, swamp PLACES Appalachian Mountains, Appalachian
LAND NAVIGATION 2-1. DEFINITION
 LAND NAVIGATION MAPS Cartography is the art and science of expressing the known physical features of the earth graphically by maps and charts. No one knows who drew, molded, laced together, or scratched
Map Reading: Grades 2 & 3
 Map Reading: Grades 2 & 3 Grades: 2, 3 Team Size: 1-2 competitors Duration: 25 minutes (5 minute introduction, 20 minutes for questions) Supervisors: Rebecca Neill-Totsuka, Sriram Garapati Summary Description
Student Handout. Write the map s title in the northwest corner of the map. How many picnic areas does the park have? Write the answer near the legend.
 Student Handout 1F Cards Write the map s title in the northwest corner of the map. How many picnic areas does the park have? Write the answer near the legend. 1 2 Draw a compass rose near the west edge
Hydrology and Hydraulics Design Report. Background Summary
 To: National Park Services Montezuma Castle National Monument Richard Goepfrich, Facility Manager From: Multicultural Technical Engineers Date: Tuesday - February 13, 2018 Subject: 30% Hydrology and Hydraulics
Integrating new coastline information and geographically coordinated coastal geomorphology data
 Integrating new coastline information and geographically coordinated coastal geomorphology data NOAA Contemporary Shoreline DOE Coastal Geomorphology Cynthia Miller Corbett Jeff Simley 1 National Hydrography
Erosional Features. What processes shaped this landscape?
 Have you ever looked at the land around you and wondered what processes shaped what you see? Perhaps you see mountains, valleys, rivers, or canyons. Do you know how long these geologic features have been
A) greatest in diameter at the Equator C) 53 N B) Albany D) 13.8 billion years B) cosmic background radiation
 greatest in diameter at the Equator C) 53 N B) Albany D) 13.8 billion years B) cosmic background radiation") 1. Measurements taken from space show the Earth to be A) greatest in diameter at the Equator B) greatest in diameter at the poles C) a perfect sphere D) pear shaped 2. The diagram below represents an observer
1. Measurements taken from space show the Earth to be A) greatest in diameter at the Equator B) greatest in diameter at the poles C) a perfect sphere D) pear shaped 2. The diagram below represents an observer
What Do You See? FOR 274: Forest Measurements and Inventory. Area Determination: Frequency and Cover
 What Do You See? Message of the Day: Many options exist to determine the size, area, or extent of a feature on a landscape FOR 274: Forest Measurements and Inventory Lecture 7: Measures of Land Area Frequency