Monthly Long Range Weather Commentary Issued: July 9, 2012 Steven A. Root, CCM, President/CEO JUNE 2012
|
|
|
- Roger Ambrose Atkinson
- 5 years ago
- Views:
Transcription


1 Monthly Long Range Weather Commentary Issued: July 9, 2012 Steven A. Root, CCM, President/CEO JUNE 2012 June Background The average temperature for the contiguous United States during June was 2 F above the twentiethcentury NORMAL. Scorching temperatures during the second half of the month broke or tied over 170 alltime temperature records in cities across America. June temperatures also contributed to a record warm first half of the year and the warmest 12 month period the nation has experienced since recordkeeping began in 1895.

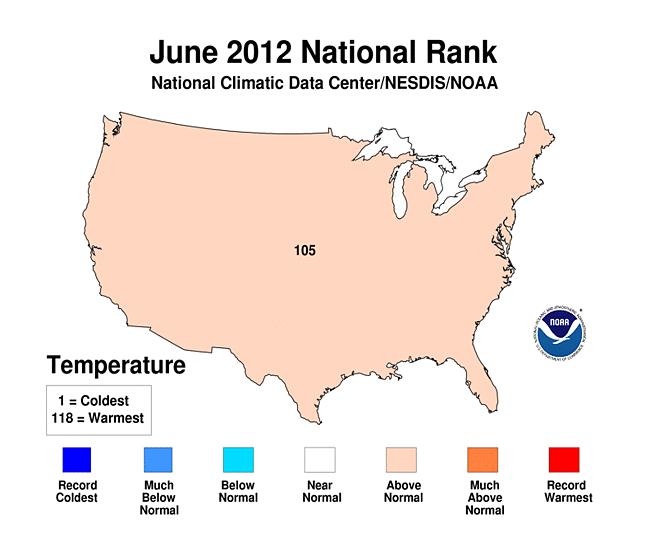
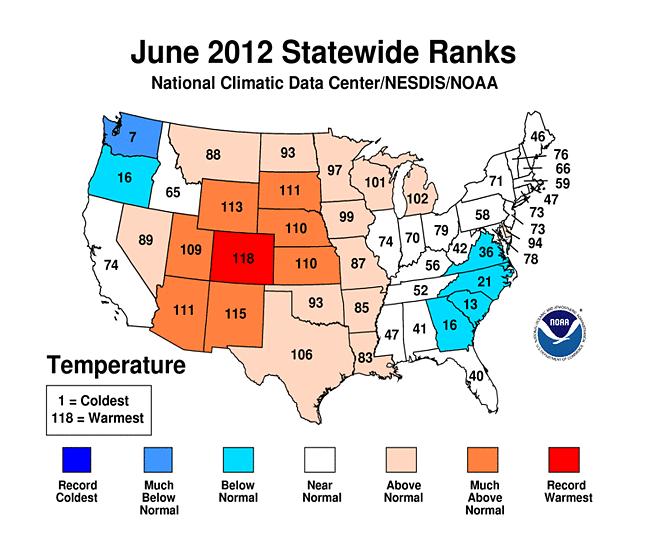
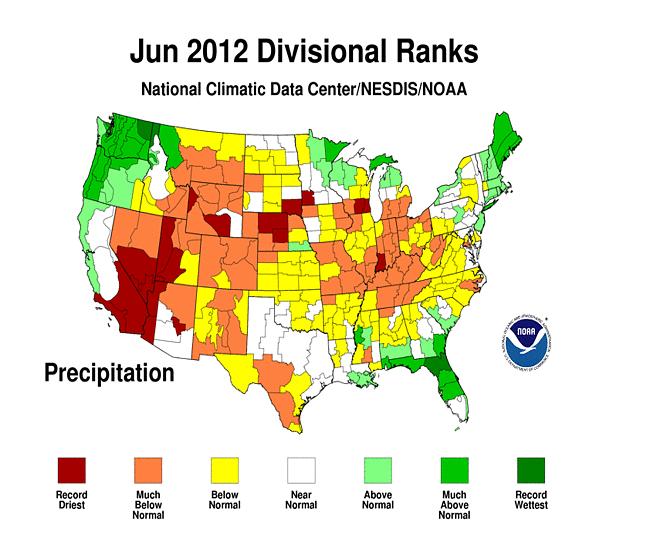
2 The map above shows where in the United States June 2012 temperatures were different from the NORMAL. Shades of red indicate temperatures up to 8 F WARMER THAN NORMAL, and shades of blue indicate temperatures up to 5 F COOLER THAN NORMAL the darker the color, the larger the temperature difference. The Intermountain West and much of the Great Plains are shaded in red, indicating the WARMER THAN NORMAL temperatures that persisted throughout June. Colorado has its warmest June on record, with a statewide temperature more than 6 F above average. Seven additional states in the region had a top ten warm June. COOLER THAN NORMAL temperatures were present for the Pacific Northwest, where Washington had its seventh coolest June on record. Cool conditions were also present for the Southeast, despite record warm temperatures towards the end of the month. Record breaking temperatures occurred across a large portion of the nation during the second half of June. Temperatures in South Carolina (113 F) and Georgia (112 F) are currently under review by the U.S. State Climate Extremes Committee as possible all time statewide temperature records. Despite the record heat late in the month, the month s average temperatures for the Lower 48 ranked only 14th warmest, with 1933 holding the record for the warmest U.S. June. According to the U.S. Drought Monitor, as of July 3, 56.0 percent of the contiguous U.S. experienced drought conditions, marking the largest percentage of the nation experiencing drought conditions in the 12 year record of the U.S. Drought Monitor. Drought conditions improved across Florida, due to the rains from Tropical Storm Debby. Drought conditions worsened across much of the West, Central Plains, and the Ohio Valley, causing significant impacts on agriculture in those regions.

3 Tropical Storm Debby brought copious precipitation to Florida during June as it slowly traversed the state. Florida s monthly statewide precipitation total of inches was 6.17 inches ABOVE NORMAL, ranking as the wettest June on record for the state. Parts of the Northeast, as well as the Pacific Northwest, were WETTER THAN NORMAL. Maine, Oregon, and Washington each had a top ten wet June. This very dry, warm, and windy weather created ideal wildfire conditions in June. Several large wildfires raged across the West, destroying hundreds of homes and causing the evacuation of tens of thousands of residences. Nationwide, wildfires scorched over 1.3 million acres, the second largest extent on record for June. Additionally, the areas of the contiguous U.S. experiencing drought conditions increased in June by almost 20 percent, leaving even more regions vulnerable to wildfires. June Increased Sunshine and Expanding Drought Summer officially began with the summer solstice this year on June 20 th, equating to longer days. By way of comparison, Chicago and New York now has more than 15 hours of sunlight per day versus about 9 hours per day during the winter solstice (on or near Dec. 21 st ). All locations in the Northern Hemisphere north of the Arctic Circle received 24 hours of daylight after June 20 th. The first day of summer brought a heat wave in the eastern USA as well as much southeasterm Canada (Ontario and Quebec). One hundred USA heat records were broken, some by as much as 15 F (8.3 C) and 51 records were tied. There are heat warnings for 13 states, and New York, Boston and Washington, D.C saw temperature records fall. Later in June, another heatwave blasted the entire central and eastern portions of the continent, breaking 1,011 US temperature records in a single week. Out of a possible 171,442 Daily Highest Max Temperatures, 2,284 were broken and (+) 998 were tied (a total of 3,2,82) during June so July is starting with a heat wave.

4 The most serious consequence of the increasing heat, however, has not been the temperatures, but rather the resulting evaporation rate. Much of the USA was left drought stricken by almost 2 years of La Niña conditions. Once the event ended in late March, the nation went through a warm spring and higher temperatures in the Great Plains and much of the Midwest the national grain belt. Even when these regions had normal to above normal rainfall, there was a higher than average evaporation rate. As a result, a nation that ended the La Niña with 56% of the lower 48 states with dry or drought conditions is now 72% dry. Even more seriously, the dried out areas are the most productive agricultural lands in the nation. Selected Records Preliminary Location Record Type Value Previous Record (date) Portland, Maine Pensacola, Florida Sidney AP, Nebraska Tribune, Kansas Goodland, Kansas Hill City, Kansas Colby, Kansas Gainesville, Florida Fourth wettest day in June on record Second highest all time calendar day rainfall on record (tied) (tied) (tied) All time wettest June on record 3.63 June " the wettest day occurred on June 18, 1922 with 4.35" 13.13" June 9 N/A the highest occurred on October 5, 1934 with 15.29" 111 F June F June F June F June F June " June F June 25, F June 23, F June F June 26, F June 24, " June 1965
5 Location Record Type Value Previous Record (date) Gainesville, Florida Gainesville, Florida Gainesville, Florida Little Rock Adams Field, AR North Little Rock, Arkansas Denver Int l AP, Colorado Denver Int l AP, Colorado Russellville, Arkansas Batesville AP, Arkansas Hot Springs AP, Arkansas Jacksonville/L. Rock AFB, AR Tampa, Florida Miles City, Montana June wettest calendar day rainfall on record All time second highest calendar day rainfall on record All time second highest three(3) day rainfall on record (tied) record (tied) Wettest June on record 6.95" June " June 27, " June 9 N/A the highest occurred on October 24, 1938 with 7.42" 12.02" June N/A the highest occurred on September 25 27, 1894 with 12.68" 106 F June F June F June F June F June F June F June F June 20, 1936 June 29, 1988 and June25, F June 25, F F July 20, F June 28, F June 30, F June 29, F June F June 22, " as of June " June F June F June 23 and 24; 2007 July 14, 2002; August 7, 1995; August 7, 1949 Miles City, Montana Driest June on record 0.36" 0.51" June 2006 Billings, Montana Driest June on record (tied) 0.24" 0.24" June 1961 Scottsbluff AP, Nebraska Chadron AP, Nebraska McCook, Nebraska Yuma, Colorado Austin Camp Mabry, Texas Jacksonville, Florida (tied) (tied) record All time two(2) day rainfall record 106 F June F June F June F June F June " June F June 25, 2012 and June 26, F June 29, F July 20, F June 19, F June 14, " September 9 10, 1908
6 Location Record Type Value Previous Record (date) Indianapolis Int l AP, Indiana Indianapolis Int l AP, Indiana St. Louis, Missouri Columbia Reg l AP, Missouri Harrison, Arkansas Fort Wayne, Indiana Louisville, Kentucky Evansville, Indiana Dayton, Ohio Springfield, Missouri Vichy Rolla, Missouri West Plains, Missouri Madison/Dane County AP, WI Atlanta, Georgia Macon, Georgia 104 F June 28 Driest June on record 0.09" record (tied) (tied) (tied) (tied) 108 F June F June F June F June F June F June F June F June F June F June 28 Driest June on record 0.31" (tied) 106 F June F June F June 25, " June F June 25, 1952 and June 16, F June 19, F June 20, F June 28, 1988 July 14, 1936 and July 22, F June 28, F June 30, F June F June 27, F June F June " June F June F June 1980 Columbus, Georgia 106 F June F June 29, 2012 Juneau Int l AP, Alaska Wettest June on record 6.69" 6.22" June 1996 Salt Lake City AP, Utah Driest June on record (tied) Trace Trace June 1994 Apalachicola Muni AP, Wettest June on record 21.60" Florida 18.32" June 1965 Kalispell, Montana Wettest June on record 6.20" 5.66" June 2005
, demand (evapotranspiration) and loss (runoff), the Standardized Precipitation Index (SPI) is a probability index that considers only")
7 What a difference a year makes here is the LONG TERM PALMER DROUGHT conditions during JUNE 2011: and the same presentation at the end of MAY 2012: While Palmer's indices are water balance indices that consider water supply (precipitation), demand (evapotranspiration) and loss (runoff), the Standardized Precipitation Index (SPI) is a probability index that considers only precipitation.
. The index is negative for drought, and positive for wet conditions.")
8 The SPI is an index based on the probability of recording a given amount of precipitation, and the probabilities are standardized so that an index of zero indicates the median precipitation amount (half of the historical precipitation amounts are below the median, and half are above the median). The index is negative for drought, and positive for wet conditions. As the dry or wet conditions become more severe, the index becomes more negative or positive. The SPI is computed by NCDC for several time scales, ranging from one month to 24 months, to capture the various scales of both short term and long term drought.

9 Here is the current DROUGHT OUTLOOK, extending through Sept. 30, 2012:
10
11
12
13
14


15 Western states reservoir storage remains generally lower than this same time last year:
 is located well north, well into central and northern Canada, similar to the positions of the past 6")
, again reinforcing the ABOVE NORMAL")
16 The following graphic shows the upper level storm track, measured at approximately 18,000 feet above sea level, averaged for JUNE 2012: Notice that the main core of the jet (5,400 to 5,600 meter heights, PURPLE to light GREEN) is located well north, well into central and northern Canada, similar to the positions of the past 6 months, except over the Pacific Northwest (an area of COLDER THAN NORMAL temperatures and WETTER THAN NORMAL rainfall). This displacement of the main jet stream core during JUNE 2012 is quite evident in the departure from normal positioning (below), again reinforcing the ABOVE NORMAL temperatures observed nationwide during last month.

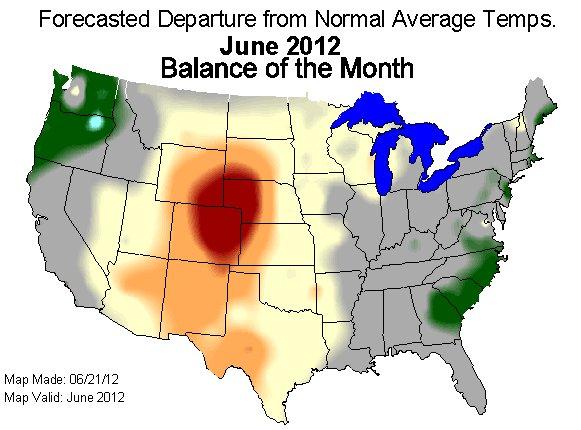
17 Our long range forecast model did extremely well last month predicting ABOVE NORMAL temperatures over most of the country, yet under stated the extreme warmth across the central Rockies, amd missed the BELOW NORMAL areas in OR, WA, GA, SC and NC. Our extended precipitation forecast for JUNE 2012 did fairly well also, and I was quite pleased with the verification of precipitation across the Pacific NW. These graphics depict our model forecasts for JUNE 2012 made at the end of MAY 2012: These graphics depict actual conditions occurring in JUNE 2012: The following graphics depict JUNE 2012 departure from normal temperatures compared to those of JUNE 2011 (this year to last year; LY to TY ):
 MO. PRECIP. (ins.) MO. SNOWFALL (ins.) OBS NOR DFN OBS NOR DFN (%) OBS NOR DFN Honolulu HI 77.9 79.4 1.5 0.07 0.30 23% 0.00 0.")
18 The following graphics depict JUNE 2012 departure from normal precipitation compared to JUNE 2011 (this year to last year; LY to TY ): The following presentation shows monthly statistics for our climate region hub cities : Regional City and State MO. TEMPS ( F) MO. PRECIP. (ins.) MO. SNOWFALL (ins.) OBS NOR DFN OBS NOR DFN (%) OBS NOR DFN Honolulu HI % Seattle WA % Portland OR % Spokane Intl WA % Pendleton OR % Santa Rosa CA % LA Airport CA % Redding CA % Sacramento CA % Fresno CA % Winnemucca NV % Tonopah NV % Phoenix AZ % Albuquerque NM % Salt Lake City UT % Grand Junction CO % OBS = Observed; DFN = Departure from Normal
19 Regional City and State MO. TEMPS ( F) MO. PRECIP. (ins.) MO. SNOWFALL (ins.) OBS NOR DFN OBS NOR DFN (%) OBS NOR DFN Great Falls MT % Casper WY % Denver CO % Grand Forks ND % Rapid City SD % Omaha NE % Kansas City MO % Oklahoma City OK % Lubbock TX % Dallas Ft. Worth TX % San Antonio TX % Minneapolis MN % Green Bay WI % Detroit MI % Regional City and State OBS = Observed; DFN = Departure from Normal MO. TEMPS ( F) MO. PRECIP. (ins.) MO. SNOWFALL (ins.) OBS NOR DFN OBS NOR DFN (%) OBS NOR DFN Buffalo NY % Burlington VT % Boston MA % Pittsburgh PA % Philadelphia PA % Baltimore MD % Chicago O'Hare IL % Indianapolis IN % Louisville KY % New Orleans LA % Raleigh Durham NC % Wilmington NC % Atlanta GA % Tallahassee FL % Orlando FL % OBS = Observed; DFN = Departure from Normal
20 Regional City and State OBS = Observed; DFN = Departure from Normal MO. TEMPS ( F) MO. PRECIP. (ins.) MO. SNOWFALL (ins.) OBS NOR DFN OBS NOR DFN (%) OBS NOR DFN Prince George BC % Edmonton AB % Saskatoon SK % Winnipeg MB % Kenora ON % Timmins ON % Muskoka ON % Toronto ON % Ottawa ON % Barrow AK % Nome AK % Fairbanks AK % Anchorage AK % Juneau AK % Regional City and State MO. TEMPS ( F) MO. PRECIP. (ins.) MO. SNOWFALL (ins.) OBS NOR DFN OBS NOR DFN (%) OBS NOR DFN Continental US % So. Canada % Alaska % Equally Weighted Inputs of Hub Cities ENSO neutral conditions have prevailed since the weak/moderate strength La Niña ended in April As of mid June, SST anomalies in the east central tropical Pacific are just slightly positive except for a small region close to the dateline where they are still very close to average. Since February, SSTs have been WARMER THAN NORMAL in the far eastern part of the tropical Pacific basin. While the strength of these positive anomalies has diminished in the last month or two, the area of somewhat above average SSTs has expanded westward to about 140W longitude. For May the SST anomaly in the NINO3.4 region was 0.05 C, indicative of neutral ENSO conditions, and for the February April season the anomaly was 0.34 C. Since December 2011, the IRI's definition of El Niño conditions began following that of NOAA/Climate Prediction Center, in which the SST anomaly in the NINO3.4 region (5S 5N; 170W 120W) exceeds 0.45 C. Similarly, for La Niña, the anomaly must be 0.45 C or less. The climatological probabilities for La Niña, neutral, and El Niño conditions vary seasonally, and are shown in a table at the bottom of this page for each 3 month season. The most recent weekly SST anomaly in the NINO3.4 region is 0.x C, indicating near average conditions in the tropical Pacific; this is barely warmer than the 0.05 C level observed in May.

21 The official diagnosis and outlook was issued earlier this month in the NOAA/Climate Prediction Center ENSO Diagnostic Discussion, produced jointly by CPC and IRI. It carried an El Niño watch, and gave a probability of exactly 50% for El Niño conditions developing during late northern summer or early fall. It also stated that neutral conditions are expected to persist at least into part of northern summer. Now, in the middle of June, a new set of model ENSO predictions is available as shown in the IRI/CPC ENSO prediction plume, discussed below. The current east central tropical Pacific SSTs are in ENSO neutral territory, and are just slightly in the warm direction in terms of SST and the basin wide sea level pressure pattern. Low level zonal winds and anomalous convection have been near average and have not yet swung toward an El Niño state. Subsurface temperatures across the equatorial Pacific have now risen to become mildly to moderately ABOVE NORMAL in the upper part of the ocean from just east of the date line eastward to 90W, and also in the western Pacific. A weakness in this subsurface warmth is found near the dateline. The thermocline depth along the equator is now above average across most of the tropical Pacific, an exception being a stretch of longitude near the dateline where the thermocline is just slightly shallower than average as a weak remnant of the La Niña that dissipated in early April, more than 2 months ago. As of mid June, some of the dynamical models and all of the statistical models predict ENSO neutral conditions for the Jun Aug season. However, nearly all models then indicate warming from their starting anomaly values (for Jun Aug) onward, so that for the subsequent seasons most dynamical models predict development of El Niño conditions. However, by contrast, most statistical models predict persistence of neutral conditions through the remainder of For the Jun Aug season, 69% of models indicate neutral ENSO conditions, while 31% indicate development of El Niño conditions. By late northern summer/autumn in Aug Oct, 46% indicate neutral conditions and 58% predict El Niño conditions. At lead times of 3 or more months into the future, statistical and dynamical models that incorporate information about the ocean's observed subsurface thermal structure generally exhibit higher predictive skill than those that do not. For the Sep Nov season, among models that do use subsurface temperature information, 36% predict ENSO neutral SSTs, and 64% predict El Niño conditions. For all models, the preference for El Niño conditions maximizes for the Oct Dec season (at 56%), and declines to levels below 50% for Nov Jan and later.
22


; too much cold in Southern Canada caused")
23 WeatherBank Forecast In late June, I reviewed the trend mapping pattern or comparisons for all years, using this period to isolate the trends: MAY 1st JUN 19th and found these anomalies of the current period across North America: All previous trends were reconsidered and all years were again reviewed 1962 and 1964 had promise, but were eliminated since their 06/20 Æ 07/15 was off current trend, and especially the 07/15 Æ 09/01 for 1964 was way off Those years still in the existing trend matching years are: and 2011 (even though trend was dissimilar out West); too much cold in Southern Canada caused me to eliminate year 2000.


24 Next I compared each year June 21st to July 15th, to isolate the developing trends : and then, the 2nd part of the summer, July 15th to Sept. 1st: I like all years There are, of course, pockets of geography where past actual DFN s don t match up perfectly but overall, these years are still good trend analogs. Lastly, various combinations of the remaining four trend years were applied, to best capture the existing trends; here is the target (balance of the month of June forecasted), followed by predictive trends running through next Spring using these same calibrations applied from JUNE:
25
: 1952 @ 20%, 2001 @ 40%, 2006 @ 20%, and 2011 @")
26 so we end with these inputs (not that far off or different than what was installed last month): 20%, 40%, 20%, and 20%
27 Here is the most current ECMWF model output: Probability of TEMPS exceeding NORMAL Probability of TEMPS exceeding UPPER THIRD (Tercile)
28 Probability of TEMPS exceeding NORMAL Probability of TEMPS exceeding UPPER THIRD (Tercile)

29 Probability of TEMPS exceeding NORMAL Probability of TEMPS exceeding UPPER THIRD (Tercile)

30 Probability of TEMPS exceeding NORMAL Probability of TEMPS exceeding UPPER THIRD (Tercile) ***** CAUTION STATEMENT ***** I have applied trends from significantly different weather periods to best capture SUMMER and FALL 2012; while this approach allows me to forecast Summer as desired, caution is urdged since these trends have a dissimilar ENSO pattern than that which is predicted moving into Winter , and thus confidence is LOW for DEC 2012 and beyond.

31 Thus, WeatherBank s forecast is as follows: JULY 2012 Monthly Temperature Departures JULY 2012 Monthly Precipitation Departures AUGUST 2012 Monthly Temperature Departures AUGUST 2012 Monthly Precipitation Departures SEPTEMBER 2012 Monthly Temp. Departures SEPTEMBER 2012 Monthly Precip. Departures
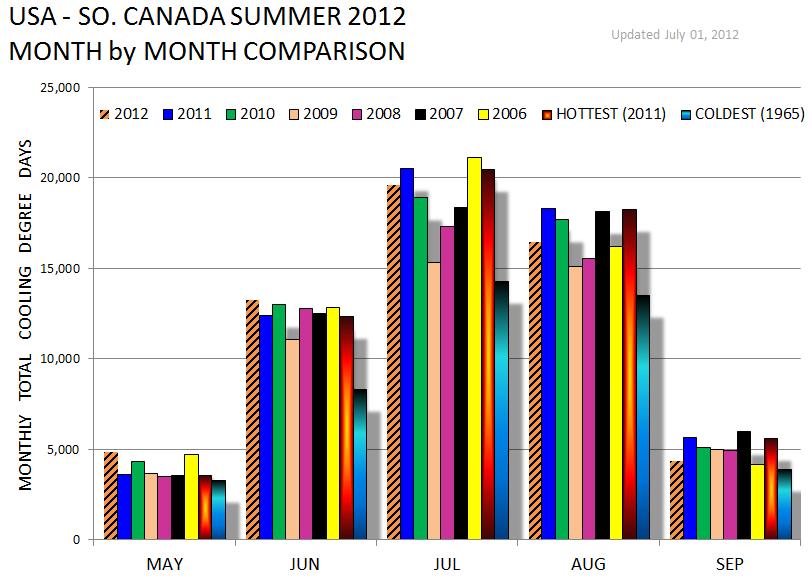
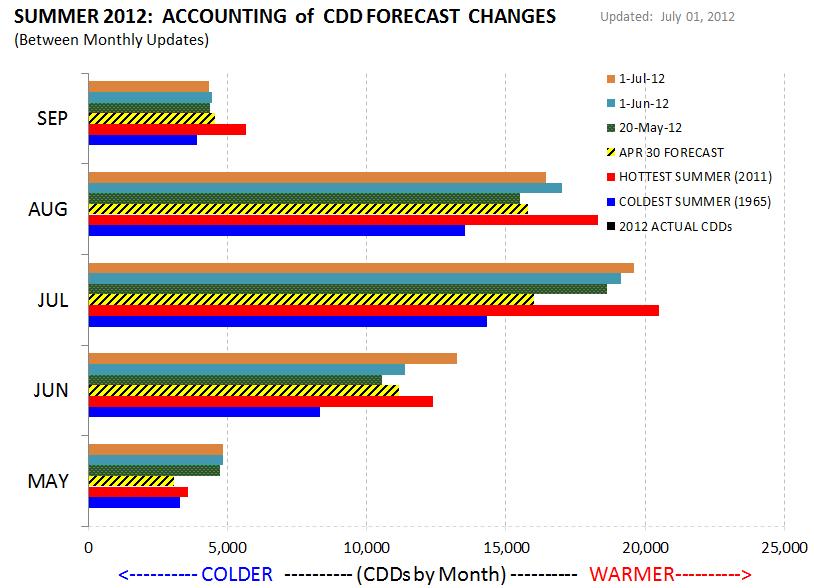
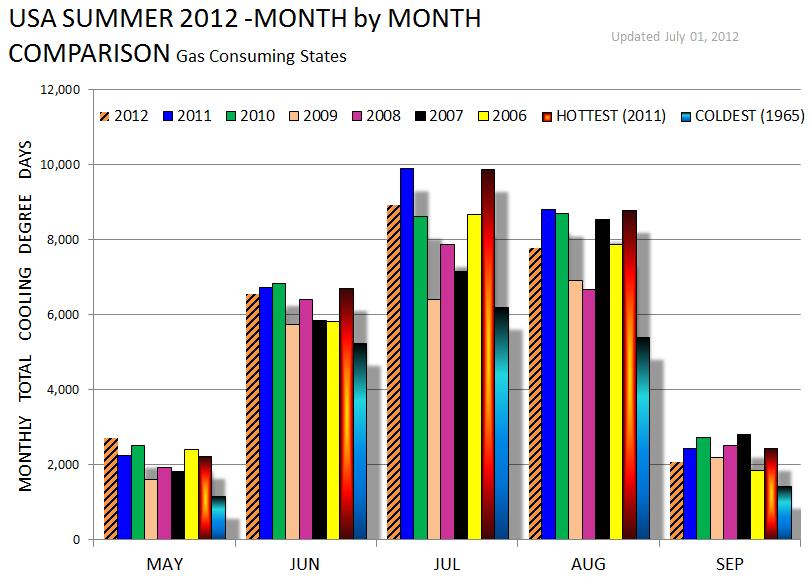
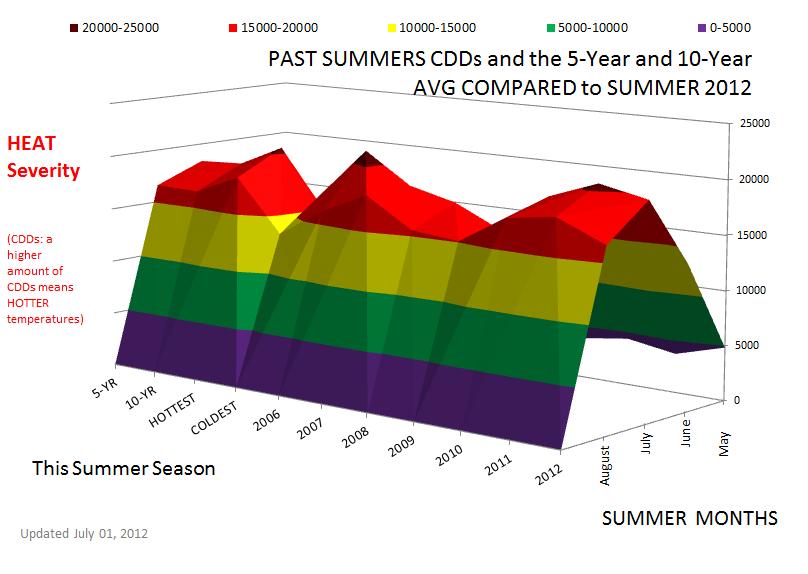
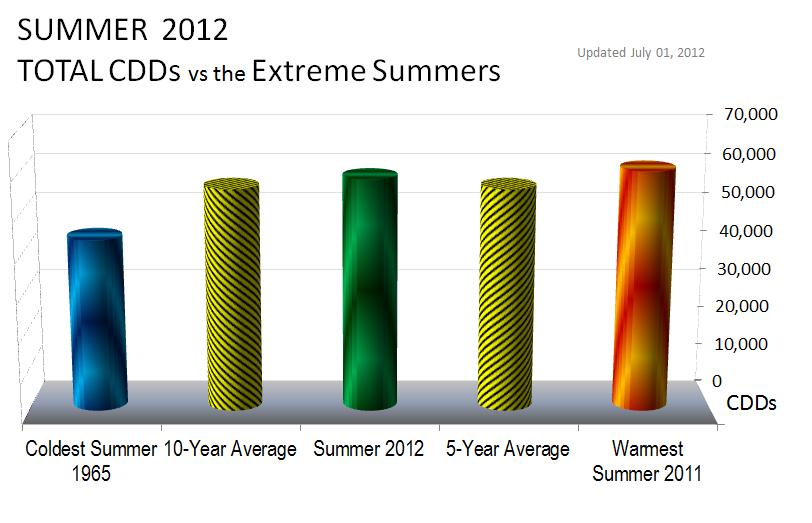
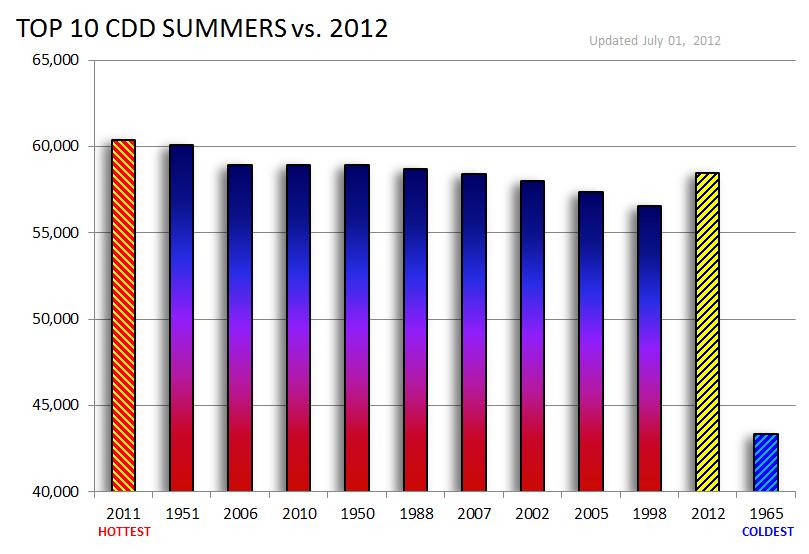
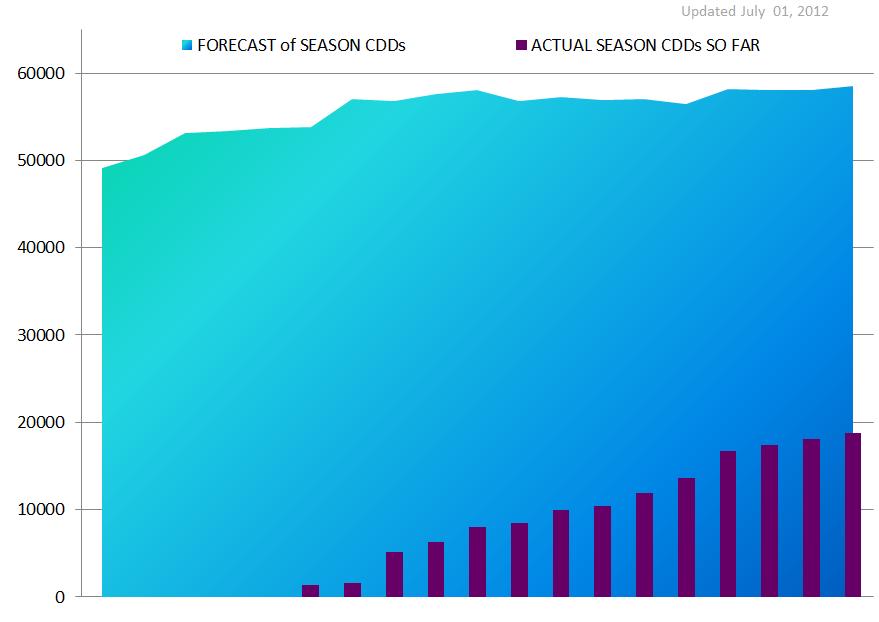
32 WeatherBank s 2012 Summer Forecast Monthly CCDs for SUMMER 2012 (out of 63 past summers from 1950, GCS = Gas Consuming States): Forecast Made May 1, 2012: Summer 2012 Full USA: 53,608 CDDs; 22 nd Hottest Summer 2012 GCS: 25,882 CDDs; 14 th Hottest Forecast Made June 4, 2012: Summer 2012 Full USA: 57,503 CDDs; 9 th Hottest Summer 2012 GCS: 27,433 CDDs; 7 th Hottest Forecast Made July 1, 2012: Summer 2012 Full USA: 58,473 CDDs; 7 th Hottest Summer 2012 GCS: 28,016 CDDs; 5 th Hottest Summer 2011: Summer 2010: Summer 2009: Summer 2008: Summer 2007: 5 Year Summer Average: 10 Year Summer Average: HOTTEST SUMMER since 1950: COLDEST SUMMER since 1950: 60,402 CDDs; #1 Hottest 58,910 CDDs; #4 Hottest 50,048 CDDs; #39 Hottest 53,934 CDDs; #20 Hottest 58,404 CDDs; #7 Hottest 55,380 CDDS 55,547 CDDs 2011, 60,402 CDDs 1965, 43,337 CDDs
33
34
35
36
37
38 Background Methodology for the WeatherBank LROM Using observed calendar day MAX and MIN temperatures at major cities across North America, WeatherBank generates daily Heating Degree Days (HDDs) and Daily Cooling Degree Days (CDDs). By comparing observations of HDDs in winter and CDDs during summer, one may obtain a real time description of how warm or cold the current season is. Basically, the hotter a location is in summer, or colder in winter, the more degree days that location earns. By adding all degree days from all locations, one can obtain a relative description of the current season. By comparing the current season to the degree days totals for past seasons, one obtains a ranking of the current season. WeatherBank's Long Range Outlook Model (LROM) fundamentally assumes that future weather patterns will be similar to a highly correlating, past weather pattern that was determine by trend composite. All similar weather trends of the past are compared to the current weather trend, then analyzed using a variety of tests. Global inputs such as MEI, average upper level flow patterns, etc., are also used. Correlation coefficients for each input years are generated, and used to define the relative strength of each year and how that trend could be used in the forecast process. Since mid August 2007, strong correlations have remained between the equally weighted (same calendar 13 week period called current, to the same 13 week period of all past years; no lag applied) time periods of the past.
Monthly Long Range Weather Commentary Issued: February 04, 2012 Steven A. Root, CCM, President/CEO
 Monthly Long Range Weather Commentary Issued: February 04, 2012 Steven A. Root, CCM, President/CEO sroot@weatherbank.com Severe thunderstorms spawned tornadoes northeast of Birmingham, Alabama on January
Every state in the nation experienced a record warm daily temperature during March.
 Monthly Long Range Weather Commentary Issued: April 05, 2012 Steven A. Root, CCM, President/CEO sroot@weatherbank.com March 2012 Record and near record breaking temperatures dominated the eastern two thirds
Monthly Long Range Weather Commentary Issued: March 06, 2012 Steven A. Root, CCM, President/CEO
 Monthly Long Range Weather Commentary Issued: March 06, 2012 Steven A. Root, CCM, President/CEO sroot@weatherbank.com Warmer than average temperatures dominated the northern and eastern regions of the
Monthly Long Range Weather Commentary Issued: July 18, 2014 Steven A. Root, CCM, President/CEO
 Monthly Long Range Weather Commentary Issued: July 18, 2014 Steven A. Root, CCM, President/CEO sroot@weatherbank.com JUNE 2014 REVIEW Climate Highlights The Month in Review The average temperature for
SEPTEMBER 2013 REVIEW
 Monthly Long Range Weather Commentary Issued: October 21, 2013 Steven A. Root, CCM, President/CEO sroot@weatherbank.com SEPTEMBER 2013 REVIEW Climate Highlights The Month in Review The average temperature
Monthly Long Range Weather Commentary Issued: May 15, 2014 Steven A. Root, CCM, President/CEO
 Monthly Long Range Weather Commentary Issued: May 15, 2014 Steven A. Root, CCM, President/CEO sroot@weatherbank.com APRIL 2014 REVIEW Climate Highlights The Month in Review The average temperature for
Monthly Long Range Weather Commentary Issued: APRIL 1, 2015 Steven A. Root, CCM, President/CEO
 Monthly Long Range Weather Commentary Issued: APRIL 1, 2015 Steven A. Root, CCM, President/CEO sroot@weatherbank.com FEBRUARY 2015 Climate Highlights The Month in Review The February contiguous U.S. temperature
Monthly Long Range Weather Commentary Issued: February 15, 2015 Steven A. Root, CCM, President/CEO
 Monthly Long Range Weather Commentary Issued: February 15, 2015 Steven A. Root, CCM, President/CEO sroot@weatherbank.com JANUARY 2015 Climate Highlights The Month in Review During January, the average
Monthly Long Range Weather Commentary Issued: APRIL 18, 2017 Steven A. Root, CCM, Chief Analytics Officer, Sr. VP,
 Monthly Long Range Weather Commentary Issued: APRIL 18, 2017 Steven A. Root, CCM, Chief Analytics Officer, Sr. VP, sroot@weatherbank.com MARCH 2017 Climate Highlights The Month in Review The average contiguous
Monthly Long Range Weather Commentary Issued: APRIL 25, 2016 Steven A. Root, CCM, Chief Analytics Officer, Sr. VP, sales
 Monthly Long Range Weather Commentary Issued: APRIL 25, 2016 Steven A. Root, CCM, Chief Analytics Officer, Sr. VP, sales sroot@weatherbank.com MARCH 2016 Climate Highlights The Month in Review The March
Monthly Long Range Weather Commentary Issued: SEPTEMBER 19, 2016 Steven A. Root, CCM, Chief Analytics Officer, Sr. VP,
 Monthly Long Range Weather Commentary Issued: SEPTEMBER 19, 2016 Steven A. Root, CCM, Chief Analytics Officer, Sr. VP, sroot@weatherbank.com SEPTEMBER 2016 Climate Highlights The Month in Review The contiguous
Monthly Long Range Weather Commentary Issued: NOVEMBER 16, 2015 Steven A. Root, CCM, Chief Analytics Officer, Sr. VP, sales
 Monthly Long Range Weather Commentary Issued: NOVEMBER 16, 2015 Steven A. Root, CCM, Chief Analytics Officer, Sr. VP, sales sroot@weatherbank.com OCTOBER 2015 Climate Highlights The Month in Review The
Weather and Climate Summary and Forecast March 2018 Report
 Weather and Climate Summary and Forecast March 2018 Report Gregory V. Jones Linfield College March 7, 2018 Summary: The ridge pattern that brought drier and warmer conditions from December through most
Monthly Long Range Weather Commentary Issued: SEPTEMBER 19, 2015 Steven A. Root, CCM, Chief Analytics Officer, Sr. VP, sales
 Monthly Long Range Weather Commentary Issued: SEPTEMBER 19, 2015 Steven A. Root, CCM, Chief Analytics Officer, Sr. VP, sales sroot@weatherbank.com AUGUST 2015 Climate Highlights The Month in Review The
National Wildland Significant Fire Potential Outlook
 National Wildland Significant Fire Potential Outlook National Interagency Fire Center Predictive Services Issued: September, 2007 Wildland Fire Outlook September through December 2007 Significant fire
Weather and Climate Summary and Forecast Winter
 Weather and Climate Summary and Forecast Winter 2016-17 Gregory V. Jones Southern Oregon University February 7, 2017 What a difference from last year at this time. Temperatures in January and February
Weather and Climate Summary and Forecast October 2018 Report
 Weather and Climate Summary and Forecast October 2018 Report Gregory V. Jones Linfield College October 4, 2018 Summary: Much of Washington, Oregon, coastal California and the Bay Area and delta region
Weather and Climate Summary and Forecast Fall/Winter 2016
 Weather and Climate Summary and Forecast Fall/Winter 2016 Gregory V. Jones Southern Oregon University November 5, 2016 After a year where we were seemingly off by a month in terms of temperatures (March
Weather and Climate Summary and Forecast January 2019 Report
 Weather and Climate Summary and Forecast January 2019 Report Gregory V. Jones Linfield College January 4, 2019 Summary: December was mild and dry over much of the west, while the east was much warmer than
Weather and Climate Summary and Forecast April 2018 Report
 Weather and Climate Summary and Forecast April 2018 Report Gregory V. Jones Linfield College April 4, 2018 Summary: A near Miracle March played out bringing cooler and wetter conditions to the majority
Weather and Climate Summary and Forecast February 2018 Report
 Weather and Climate Summary and Forecast February 2018 Report Gregory V. Jones Linfield College February 5, 2018 Summary: For the majority of the month of January the persistent ridge of high pressure
Weather and Climate Summary and Forecast Summer 2017
 Weather and Climate Summary and Forecast Summer 2017 Gregory V. Jones Southern Oregon University August 4, 2017 July largely held true to forecast, although it ended with the start of one of the most extreme
Weather and Climate Summary and Forecast Winter
 Weather and Climate Summary and Forecast Winter 2016-17 Gregory V. Jones Southern Oregon University December 5, 2016 Well after an October that felt more like November, we just finished a November that
Weather and Climate Summary and Forecast March 2019 Report
 Weather and Climate Summary and Forecast March 2019 Report Gregory V. Jones Linfield College March 2, 2019 Summary: Dramatic flip from a mild winter to a top five coldest February on record in many locations
Weather and Climate Summary and Forecast January 2018 Report
 Weather and Climate Summary and Forecast January 2018 Report Gregory V. Jones Linfield College January 5, 2018 Summary: A persistent ridge of high pressure over the west in December produced strong inversions
Weather and Climate Summary and Forecast October 2017 Report
 Weather and Climate Summary and Forecast October 2017 Report Gregory V. Jones Linfield College October 4, 2017 Summary: Typical variability in September temperatures with the onset of fall conditions evident
Weather and Climate Summary and Forecast Summer into Harvest 2016
 Weather and Climate Summary and Forecast Summer into Harvest 2016 Gregory V. Jones Southern Oregon University September 3, 2016 With school and football season starting a hint of fall is right on time
An ENSO-Neutral Winter
 An ENSO-Neutral Winter This issue of the Blue Water Outlook newsletter is devoted towards my thoughts on the long range outlook for winter. You will see that I take a comprehensive approach to this outlook
Weather and Climate Summary and Forecast Summer 2016
 Weather and Climate Summary and Forecast Summer 2016 Gregory V. Jones Southern Oregon University August 5, 2016 The month of July saw the continued flip, flop of the western US temperatures. It was warm
Weather and Climate Summary and Forecast August 2018 Report
 Weather and Climate Summary and Forecast August 2018 Report Gregory V. Jones Linfield College August 5, 2018 Summary: July 2018 will likely go down as one of the top five warmest July s on record for many
Midwest/Great Plains Climate-Drought Outlook September 20, 2018
 Midwest/Great Plains Climate-Drought Outlook September 20, 2018 Brian Fuchs National Drought Mitigation Center University of Nebraska-Lincoln School of Natural Resources September 20, 2018 General Information
Champaign-Urbana 1999 Annual Weather Summary
 Champaign-Urbana 1999 Annual Weather Summary ILLINOIS STATE WATER SURVEY 2204 Griffith Dr. Champaign, IL 61820 wxobsrvr@sws.uiuc.edu Maria Peters, Weather Observer A major snowstorm kicked off the new
Champaign-Urbana 2001 Annual Weather Summary
 Champaign-Urbana 2001 Annual Weather Summary ILLINOIS STATE WATER SURVEY 2204 Griffith Dr. Champaign, IL 61820 wxobsrvr@sws.uiuc.edu Maria Peters, Weather Observer January: After a cold and snowy December,
Weather and Climate Summary and Forecast November 2017 Report
 Weather and Climate Summary and Forecast November 2017 Report Gregory V. Jones Linfield College November 7, 2017 Summary: October was relatively cool and wet north, while warm and very dry south. Dry conditions
Climate Outlook through 2100 South Florida Ecological Services Office Vero Beach, FL September 9, 2014
 Climate Outlook through 2100 South Florida Ecological Services Office Vero Beach, FL September 9, 2014 Short Term Drought Map: Short-term (
MDA WEATHER SERVICES AG WEATHER OUTLOOK. Kyle Tapley-Senior Agricultural Meteorologist May 22, 2014 Chicago, IL
 MDA WEATHER SERVICES AG WEATHER OUTLOOK Kyle Tapley-Senior Agricultural Meteorologist May 22, 2014 Chicago, IL GLOBAL GRAIN NORTH AMERICA 2014 Agenda Spring Recap North America Forecast El Niño Discussion
Weather and Climate Summary and Forecast December 2017 Report
 Weather and Climate Summary and Forecast December 2017 Report Gregory V. Jones Linfield College December 5, 2017 Summary: November was relatively cool and wet from central California throughout most of
2015 Summer Forecast
 2015 Summer Forecast Inside This Forecast Summer 2014 Recap 2 Implications of El Niño and the PDO on the Upcoming Summer Summary of Global Indices & Oscillations Analog Year: The Midwest a battleground
Upper Missouri River Basin February 2018 Calendar Year Runoff Forecast February 6, 2018
 Upper Missouri River Basin February 2018 Calendar Year Runoff Forecast February 6, 2018 Calendar Year Runoff Forecast Explanation and Purpose of Forecast U.S. Army Corps of Engineers, Northwestern Division
Northwest Outlook October 2016
 Northwest Outlook October 2016 Rainfall Opportunities and Challenges Rainfall over the month of September presented some challenges for the fall harvest while other producers benefitted. Figure 1a shows
January 2011 Calendar Year Runoff Forecast
 January 2011 Calendar Year Runoff Forecast 2010 Runoff Year Calendar Year 2010 was the third highest year of runoff in the Missouri River Basin above Sioux City with 38.8 MAF, behind 1978 and 1997 which
U.S. Outlook For October and Winter Thursday, September 19, 2013
 About This report coincides with today s release of the monthly temperature and precipitation outlooks for the U.S. from the Climate Prediction Center (CPC). U.S. CPC October and Winter Outlook The CPC
The Pennsylvania Observer
 The Pennsylvania Observer January 5, 2016 December 2015 - Pennsylvania Weather Recap By: Arthur Person December is the first of the three coldest months of the year. Sometimes it can be naughty, and sometimes
KANSAS CLIMATE SUMMARY February 2015
 KANSAS CLIMATE SUMMARY February 2015 Extended Cold Despite some record warm readings at a few locations, February was characterized by colder than normal conditions. This was particularly true during the
ENSO Cycle: Recent Evolution, Current Status and Predictions. Update prepared by Climate Prediction Center / NCEP 24 September 2012
 ENSO Cycle: Recent Evolution, Current Status and Predictions Update prepared by Climate Prediction Center / NCEP 24 September 2012 Outline Overview Recent Evolution and Current Conditions Oceanic Niño
2015: A YEAR IN REVIEW F.S. ANSLOW
 2015: A YEAR IN REVIEW F.S. ANSLOW 1 INTRODUCTION Recently, three of the major centres for global climate monitoring determined with high confidence that 2015 was the warmest year on record, globally.
2012 Growing Season Weather Summary for North Dakota. Adnan Akyüz and Barbara A. Mullins Department of Soil Science October 30, 2012
 2012 Growing Season Weather Summary for North Dakota Adnan Akyüz and Barbara A. Mullins Department of Soil Science October 30, 2012 Introduction The 2012 growing season (the period from April through September)
ENSO Cycle: Recent Evolution, Current Status and Predictions. Update prepared by Climate Prediction Center / NCEP 23 April 2012
 ENSO Cycle: Recent Evolution, Current Status and Predictions Update prepared by Climate Prediction Center / NCEP 23 April 2012 Outline Overview Recent Evolution and Current Conditions Oceanic Niño Index
Climate Variability and El Niño
 Climate Variability and El Niño David F. Zierden Florida State Climatologist Center for Ocean Atmospheric Prediction Studies The Florida State University UF IFAS Extenstion IST January 17, 2017 The El
Upper Missouri River Basin December 2017 Calendar Year Runoff Forecast December 5, 2017
 Upper Missouri River Basin December 2017 Calendar Year Runoff Forecast December 5, 2017 Calendar Year Runoff Forecast Explanation and Purpose of Forecast U.S. Army Corps of Engineers, Northwestern Division
ENSO Cycle: Recent Evolution, Current Status and Predictions. Update prepared by Climate Prediction Center / NCEP 5 August 2013
 ENSO Cycle: Recent Evolution, Current Status and Predictions Update prepared by Climate Prediction Center / NCEP 5 August 2013 Outline Overview Recent Evolution and Current Conditions Oceanic Niño Index
ENSO Cycle: Recent Evolution, Current Status and Predictions. Update prepared by Climate Prediction Center / NCEP 11 November 2013
 ENSO Cycle: Recent Evolution, Current Status and Predictions Update prepared by Climate Prediction Center / NCEP 11 November 2013 Outline Overview Recent Evolution and Current Conditions Oceanic Niño Index
ALASKA REGION CLIMATE FORECAST BRIEFING. December 15, 2014 Rick Thoman NWS Alaska Region ESSD Climate Services
 ALASKA REGION CLIMATE FORECAST BRIEFING December 15, 2014 Rick Thoman NWS Alaska Region ESSD Climate Services Today Climate Forecast Basics Review of recent climate forecasts and conditions CPC Forecasts
NIDIS Intermountain West Drought Early Warning System February 12, 2019
 NIDIS Intermountain West Drought Early Warning System February 12, 2019 Precipitation The images above use daily precipitation statistics from NWS COOP, CoCoRaHS, and CoAgMet stations. From top to bottom,
ENSO: Recent Evolution, Current Status and Predictions. Update prepared by: Climate Prediction Center / NCEP 9 November 2015
 ENSO: Recent Evolution, Current Status and Predictions Update prepared by: Climate Prediction Center / NCEP 9 November 2015 Outline Summary Recent Evolution and Current Conditions Oceanic Niño Index (ONI)
Summer 2018 Southern Company Temperature/Precipitation Forecast
 Scott A. Yuknis High impact weather forecasts, climate assessment and prediction. 14 Boatwright s Loop Plymouth, MA 02360 Phone/Fax 508.927.4610 Cell: 508.813.3499 ClimateImpact@comcast.net Climate Impact
ENSO: Recent Evolution, Current Status and Predictions. Update prepared by: Climate Prediction Center / NCEP 30 October 2017
 ENSO: Recent Evolution, Current Status and Predictions Update prepared by: Climate Prediction Center / NCEP 30 October 2017 Outline Summary Recent Evolution and Current Conditions Oceanic Niño Index (ONI)
Colorado CoCoRaHS. Colorado CoCoRaHS. Because Every Drop Counts! November 2014 Volume 2, Issue 11
 U.S. PRECIPITATION (% OF AVERAGE) LOOKING BACK AT OCTOBER 2014 October was a fairly dry month for much of the nation with the exception of the Pacific Northwest, portions of New England and the Tennessee
2011 Year in Review TORNADOES
 2011 Year in Review The year 2011 had weather events that will be remembered for a long time. Two significant tornado outbreaks in April, widespread damage and power outages from Hurricane Irene in August
Becky Bolinger Water Availability Task Force November 13, 2018
 Colorado Climate Center WATF Climate Update Becky Bolinger Water Availability Task Force November 13, 2018 COLORADO CLIMATE CENTER Water Year 2018 Colorado s Climate in Review COLORADO CLIMATE CENTER
The Weather Wire. Contents: Summer 2018 Outlook. Summer 2018 Outlook Drought Monitor May Summary/Statistics June Preview Rainfall Totals
 The Weather Wire June 2018 Volume 25 Number 6 Contents: Summer 2018 Outlook Drought Monitor May Summary/Statistics June Preview Rainfall Totals Summer 2018 Outlook June 1 st marked the first day of meteorological
Winter Forecast. Allan Huffman RaleighWx
 Winter 2015-16 Forecast Allan Huffman RaleighWx Disclaimer Seasonal forecasting is difficult and you are always learning. I attempt to look at all factors I understand and have seen correlate in the past
UNITED STATES AND SOUTH AMERICA OUTLOOK (FULL REPORT) Wednesday, April 18, 2018
 Wednesday, April 18, 2018") T-storm Weather Summary Coolness continues over the next week in much of the central U.S., most likely producing the coldest April since 1907 in the Corn Belt, but followed by seasonable to mild weather
T-storm Weather Summary Coolness continues over the next week in much of the central U.S., most likely producing the coldest April since 1907 in the Corn Belt, but followed by seasonable to mild weather
Climate Outlook through 2100 South Florida Ecological Services Office Vero Beach, FL January 13, 2015
 Climate Outlook through 2100 South Florida Ecological Services Office Vero Beach, FL January 13, 2015 Short Term Drought Map: Short-term (
Seasonal Climate Outlook for South Asia (June to September) Issued in May 2014
 Issued in May 2014") Ministry of Earth Sciences Earth System Science Organization India Meteorological Department WMO Regional Climate Centre (Demonstration Phase) Pune, India Seasonal Climate Outlook for South Asia (June
Ministry of Earth Sciences Earth System Science Organization India Meteorological Department WMO Regional Climate Centre (Demonstration Phase) Pune, India Seasonal Climate Outlook for South Asia (June
Arizona Climate Summary February 2018 Summary of conditions for January 2018
 Arizona Climate Summary February 2018 Summary of conditions for January 2018 January 2018 Temperature and Precipitation Summary January 1 st 19 th : The new year began with a ridge of high pressure over
Presentation Overview. Southwestern Climate: Past, present and future. Global Energy Balance. What is climate?
 Southwestern Climate: Past, present and future Mike Crimmins Climate Science Extension Specialist Dept. of Soil, Water, & Env. Science & Arizona Cooperative Extension The University of Arizona Presentation
National Wildland Significant Fire Potential Outlook
 National Wildland Significant Fire Potential Outlook National Interagency Fire Center Predictive Services Issued: April 1, 2008 Next Issue: May 1, 2008 Wildland Fire Outlook April 2008 through July 2008
Precipitation. Standardized Precipitation Index. NIDIS Intermountain West Drought Early Warning System September 5, 2017
 9/6/2017 NIDIS Drought and Water Assessment NIDIS Intermountain West Drought Early Warning System September 5, 2017 Precipitation The images above use daily precipitation statistics from NWS COOP, CoCoRaHS,
Impacts of the April 2013 Mean trough over central North America
 Impacts of the April 2013 Mean trough over central North America By Richard H. Grumm National Weather Service State College, PA Abstract: The mean 500 hpa flow over North America featured a trough over
Champaign-Urbana 1998 Annual Weather Summary
 Champaign-Urbana 1998 Annual Weather Summary ILLINOIS STATE WATER SURVEY Audrey Bryan, Weather Observer 2204 Griffith Dr. Champaign, IL 61820 wxobsrvr@sparc.sws.uiuc.edu The development of the El Nìno
ACCUMULATED PRECIPITATION IN INCHES
 4 3 CUMULATIVE PRECIPITATION WATER YEAR 7 COLUMBIA BASIN ABOVE GRAND COULEE 18% of Normal 1971- Average ACCUMULATED PRECIPITATION IN INCHES 1 3 1 4 3 1 8 6 4 94% of Normal 17% of Normal 118% of Normal
May 2016 Volume 23 Number 5
 The Weather Wire May 2016 Volume 23 Number 5 Contents: Winter Summary Current Colorado and West-wide Snow Pack Drought Monitor April Summary/Statistics May Preview Snowfall Totals Winter Summary The Front
Nebraska experienced a wide
 Issue 1 August 2016 CLIMATE UPDATE A MONTHLY SUMMARY FROM THE neclimate.unl.edu August saw reprieve from dryness, cooler temps Overview Nebraska experienced a wide range of conditions across the state
2013 Summer Weather Outlook. Temperatures, Precipitation, Drought, Hurricanes and why we care
 2013 Summer Weather Outlook Temperatures, Precipitation, Drought, Hurricanes and why we care Role of the ERCOT Meteorologist Forecasts Develop temperature input for hourly load forecasts (next day, days
A summary of the weather year based on data from the Zumwalt weather station
 ZUMWALT PRAIRIE WEATHER 2016 A summary of the weather year based on data from the Zumwalt weather station Figure 1. An unusual summer storm on July 10, 2016 brought the second-largest precipitation day
South & South East Asian Region:
 Issued: 15 th December 2017 Valid Period: January June 2018 South & South East Asian Region: Indonesia Tobacco Regions 1 A] Current conditions: 1] El Niño-Southern Oscillation (ENSO) ENSO Alert System
ALASKA REGION CLIMATE FORECAST BRIEFING. January 23, 2015 Rick Thoman ESSD Climate Services
 ALASKA REGION CLIMATE FORECAST BRIEFING January 23, 2015 Rick Thoman ESSD Climate Services Today Climate Forecast Basics Review of recent climate forecasts and conditions CPC Forecasts and observations
Oregon Water Conditions Report April 17, 2017
 Oregon Water Conditions Report April 17, 2017 Mountain snowpack continues to maintain significant levels for mid-april. By late March, statewide snowpack had declined to 118 percent of normal after starting
The hydrologic service area (HSA) for this office covers Central Kentucky and South Central Indiana.
 for this office covers Central Kentucky and South Central Indiana.") January 2012 February 13, 2012 An X inside this box indicates that no flooding occurred within this hydrologic service area. January 2012 continued the string of wet months this winter. Rainfall was generally
January 2012 February 13, 2012 An X inside this box indicates that no flooding occurred within this hydrologic service area. January 2012 continued the string of wet months this winter. Rainfall was generally
The Pennsylvania Observer
 The Pennsylvania Observer October 1, 2015 September 2015 - Pennsylvania Weather Recap By: Quinn Lease The month of September will be remembered for its above normal temperatures and dry conditions that
Seasonal Outlook through September 2007
 Seasonal Outlook through September 2007 Klaus Wolter (15may) University of Colorado, CIRES & NOAA-ESRL Climate Analysis Branch klaus.wolter@noaa.gov http://www.cdc.noaa.gov/people/klaus.wolter/swcasts/
UPDATE OF REGIONAL WEATHER AND SMOKE HAZE (December 2017)
") UPDATE OF REGIONAL WEATHER AND SMOKE HAZE (December 2017) 1. Review of Regional Weather Conditions for November 2017 1.1 In November 2017, Southeast Asia experienced inter-monsoon conditions in the first
UPDATE OF REGIONAL WEATHER AND SMOKE HAZE (December 2017) 1. Review of Regional Weather Conditions for November 2017 1.1 In November 2017, Southeast Asia experienced inter-monsoon conditions in the first
The Pennsylvania Observer
 The Pennsylvania Observer April 2, 2010 March 2010 Pennsylvania Weather Recap Prepared by: Katelyn Johnson March did come in as a lion cub this year. The 1 st proved to be a calm day; however most of Pennsylvania
NIDIS Intermountain West Drought Early Warning System February 6, 2018
 NIDIS Intermountain West Drought Early Warning System February 6, 2018 Precipitation The images above use daily precipitation statistics from NWS COOP, CoCoRaHS, and CoAgMet stations. From top to bottom,
Table 1. August average temperatures and departures from normal ( F) for selected cities.
 for selected cities.") Climate Summary for Florida August 2016 Prepared by Lydia Stefanova and David Zierden Florida Climate Center, The Florida State University, Tallahassee, Florida Online at: http://climatecenter.fsu.edu/products-services/summaries
Climate Summary for Florida August 2016 Prepared by Lydia Stefanova and David Zierden Florida Climate Center, The Florida State University, Tallahassee, Florida Online at: http://climatecenter.fsu.edu/products-services/summaries
Colorado s 2003 Moisture Outlook
 Colorado s 2003 Moisture Outlook Nolan Doesken and Roger Pielke, Sr. Colorado Climate Center Prepared by Tara Green and Odie Bliss http://climate.atmos.colostate.edu How we got into this drought! Fort
Office of the Washington State Climatologist
 Office of the Washington State Climatologist May 2, 2014 April Event Summary April mean temperatures were near-normal with some tendency for the monthly anomalies to come in on the warmer side. Total April
Weather and Climate Summary and Forecast Summer 2016
 Weather and Climate Summary and Forecast Summer 2016 Gregory V. Jones Southern Oregon University June 6, 2016 May 2016 continued the warm trend for portions of the west, while providing some relief for
Colorado weather and climate update: a bit more than halfway through the water year (Or: What s going on with the weather?? )
") Colorado weather and climate update: a bit more than halfway through the water year (Or: What s going on with the weather?? ) Russ S. Schumacher Colorado State Climatologist Director, Colorado Climate
Colorado weather and climate update: a bit more than halfway through the water year (Or: What s going on with the weather?? ) Russ S. Schumacher Colorado State Climatologist Director, Colorado Climate
ALASKA REGION CLIMATE OUTLOOK BRIEFING. November 16, 2018 Rick Thoman Alaska Center for Climate Assessment and Policy
 ALASKA REGION CLIMATE OUTLOOK BRIEFING November 16, 2018 Rick Thoman Alaska Center for Climate Assessment and Policy Today s Outline Feature of the month: Southeast Drought Update Climate Forecast Basics
Highlight: Support for a dry climate increasing.
 Scott A. Yuknis High impact weather forecasts, climate assessment and prediction. 14 Boatwright s Loop Plymouth, MA 02360 Phone/Fax 508.927.4610 Cell: 508.813.3499 ClimateImpact@comcast.net Climate Impact
January 25, Summary
 January 25, 2013 Summary Precipitation since the December 17, 2012, Drought Update has been slightly below average in parts of central and northern Illinois and above average in southern Illinois. Soil
KANSAS CLIMATE SUMMARY January 2018
 KANSAS CLIMATE SUMMARY January 2018 Some welcome moisture After an extended period with little to no moisture, parts of Kansas recorded some significant precipitation. At Tribune, a small snow event on
Colorado CoCoRaHS. Colorado CoCoRaHS. Because Every Drop Counts! October 2014 Volume 2, Issue 10
 U.S. PRECIPITATION (% OF AVERAGE) LOOKING BACK AT SEPTEMBER 2014 September was dry for much of the nation with a few exceptions; one of those being the central Rockies. In Colorado, it was wetter-than-average
Seasonal Climate Forecast August October 2013 Verification (Issued: November 17, 2013)
") Seasonal Climate Forecast August October 2013 Verification (Issued: November 17, 2013) Note: This product is published by the Oregon Department of Agriculture (ODA), in cooperation with the Oregon Department
Seasonal Climate Forecast August October 2013 Verification (Issued: November 17, 2013) Note: This product is published by the Oregon Department of Agriculture (ODA), in cooperation with the Oregon Department
ENSO Cycle: Recent Evolution, Current Status and Predictions. Update prepared by Climate Prediction Center / NCEP 25 February 2013
 ENSO Cycle: Recent Evolution, Current Status and Predictions Update prepared by Climate Prediction Center / NCEP 25 February 2013 Outline Overview Recent Evolution and Current Conditions Oceanic Niño Index
Upper Missouri River Basin January 2018 Calendar Year Runoff Forecast January 3, 2018
 Calendar Year Runoff Forecast Upper Missouri River Basin January 2018 Calendar Year Runoff Forecast January 3, 2018 Explanation and Purpose of Forecast U.S. Army Corps of Engineers, Northwestern Division
Climate Impacts to Southwest Water Sector. Dr. Dave DuBois New Mexico State Climatologist
 Climate Impacts to Southwest Water Sector Dr. Dave DuBois New Mexico State Climatologist Presented at EPA Extreme Events and Climate Adaptation Planning Workshop June 3, 2015 Water Year Precip. % of Average
KANSAS CLIMATE SUMMARY August 2015
 KANSAS CLIMATE SUMMARY August 2015 Cool and Dry August was drier than normal in most of the state. State-wide average precipitation was 2.80 inches or 85 percent of normal. The Northeast division of the