Every state in the nation experienced a record warm daily temperature during March.
|
|
|
- Sharleen Thornton
- 5 years ago
- Views:
Transcription
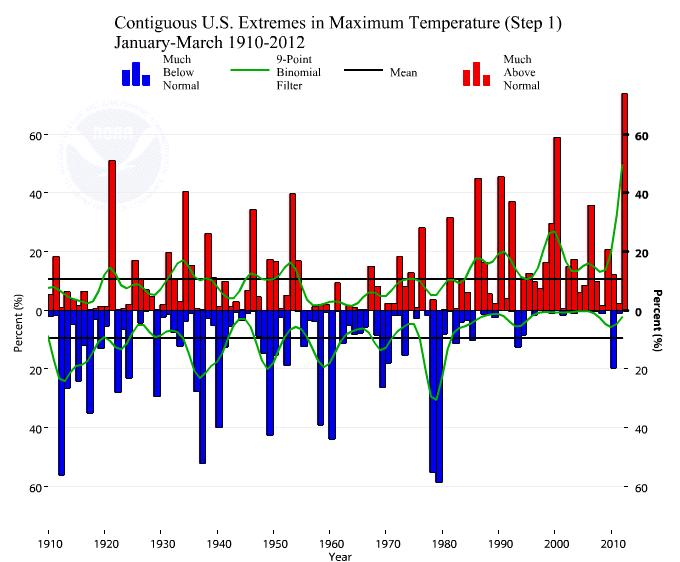
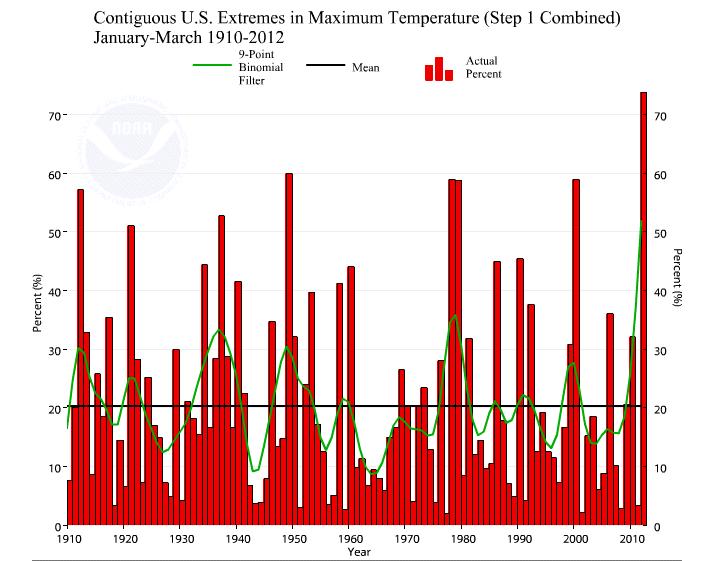
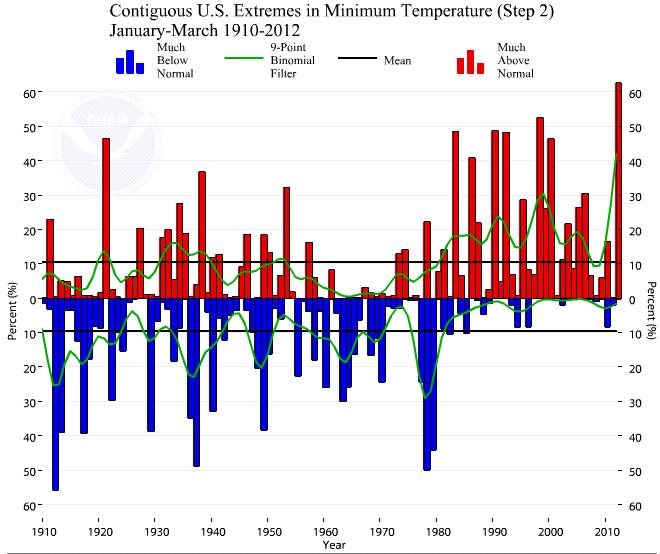
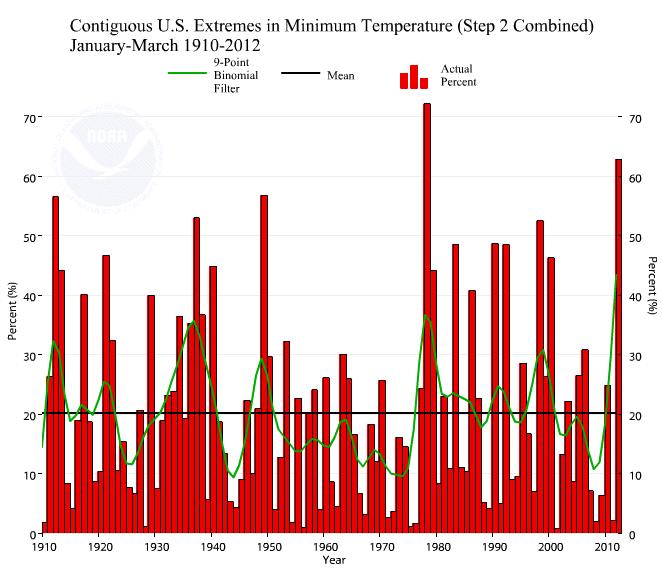
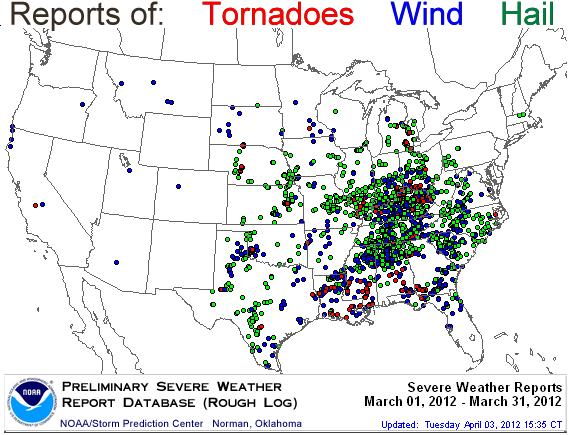
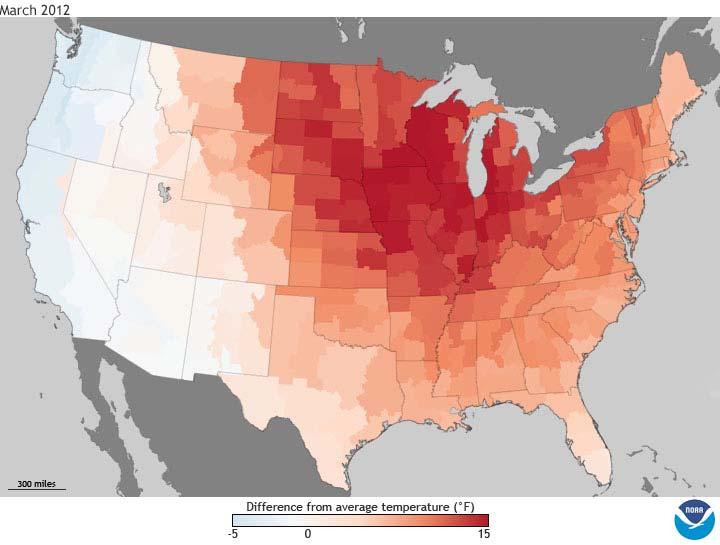
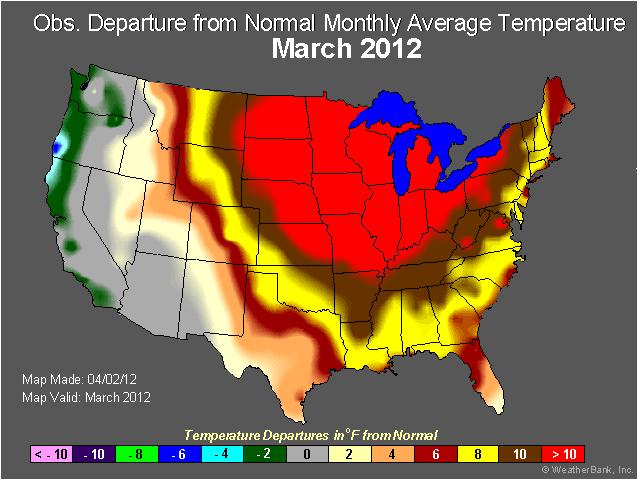
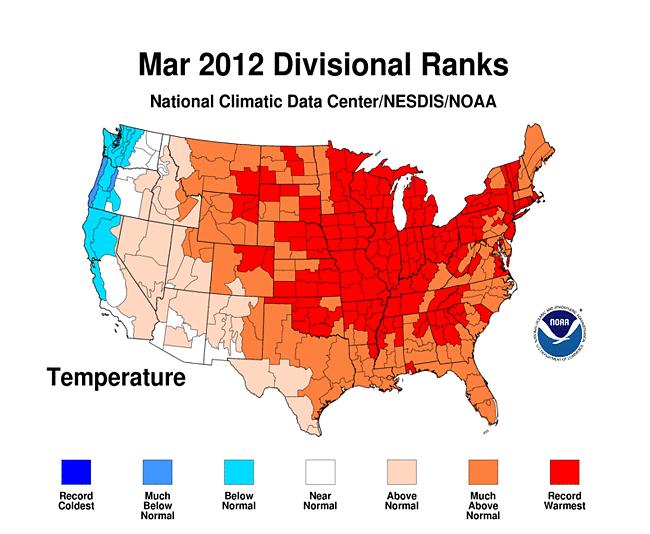
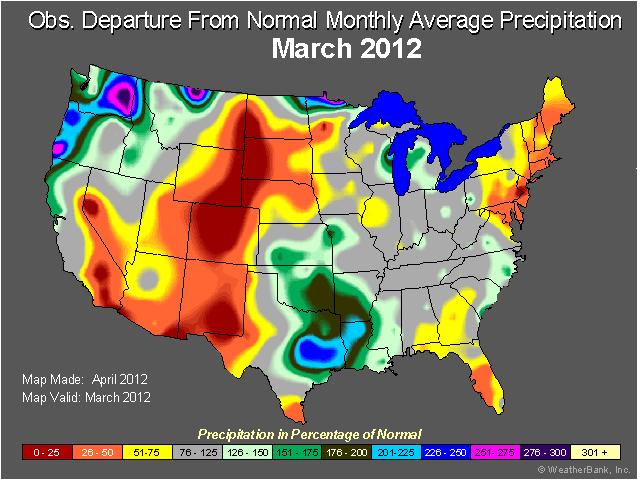
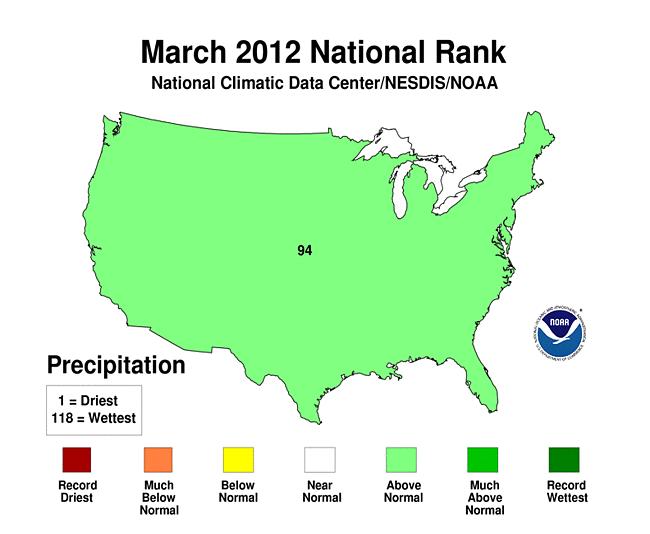
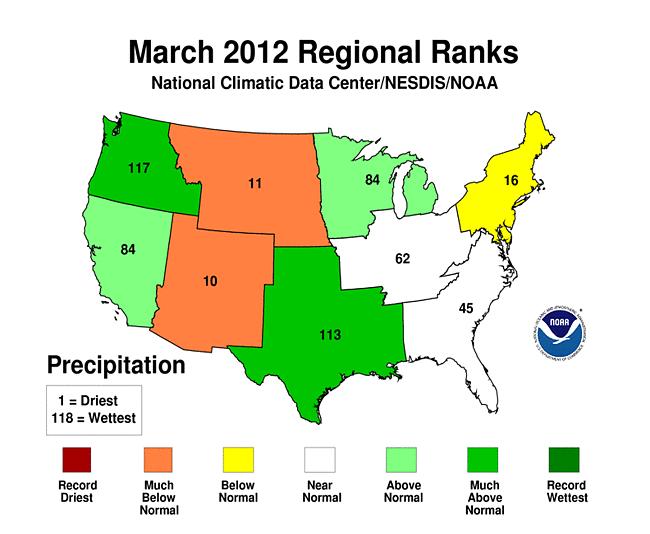
1 Monthly Long Range Weather Commentary Issued: April 05, 2012 Steven A. Root, CCM, President/CEO March 2012 Record and near record breaking temperatures dominated the eastern two thirds of the nation and contributed to the warmest March on record for the contiguous United States, a record keeping period that dates back to The average temperature of 51.1 F was 8.6 F ABOVE the 20th century average for March and 0.5 F warmer than the previous warmest March in Of the more than 1,400 months that have passed since the U.S. record began, only one month, January 2006 (8.5 F), has seen a similar departures from its average temperature than March A persistent weather pattern during the month led to 25 states east of the Rockies having their warmest March on record. An additional 15 states had monthly temperatures ranking among their ten warmest. That same pattern brought cooler than average conditions to the West Coast states of WA, OR, and CA. Every state in the nation experienced a record warm daily temperature during March. According to preliminary data, there were 15,272 warm temperature records broken (7,755 daytime records, 7,517 nighttime records). Hundreds of locations across the country broke their all time March records. There were 21 instances of the nighttime temperatures being as warm, or warmer, than the existing record daytime temperature for a given date. The nationally averaged precipitation total was 2.73 inches, which is 0.33 inch ABOVE AVERAGE. The Pacific Northwest and the Southern Plains were much WETTER than AVERAGE during March while DRIER than AVERAGE conditions were observed in the interior West, Northeast, and FL. CO had its driest March on record. According to the U.S. Drought Monitor, as of April 3rd, 36.8 percent of the contiguous U.S. was in drought, a decrease from 38.7 percent at the end of February. Above average precipitation across the Southern Plains improved long term drought conditions across TX, OK, and KS. The warmer than average conditions across the eastern U.S. also created an environment favorable for severe thunderstorms and tornadoes. According to NOAA's Storm Prediction Center, there were 223 preliminary tornado reports during March, a month that averages 80 tornadoes. The majority of the tornadoes occurred during the March 2 3 outbreak across the Ohio Valley and Southeast, which caused 40 fatalities and damages exceeding 1.5 billion U.S. dollars. The U.S. Climate Extremes Index (USCEI), an index that tracks the highest and lowest 10 percent of extremes in temperature, precipitation, drought and tropical cyclones across the contiguous U.S., was a record 41 percent during March. The extent of extremes in warm maximum (71 percent) and warm minimum (70 percent) temperatures was at or near record levels across the nation. A record extent of extremes in both maximum and minimum temperatures covered all of the Northeast, Upper Midwest, Ohio Valley and Southeast regions during the month. On March 9th, a cut off low pressure system impacted the Hawaiian Islands, bringing heavy rainfall and severe thunderstorms. A rare EF 0 tornado hit the towns of Lanikai and Kailua on Oahu, causing minor damage. A separate storm dropped a hail stone measuring 4.25 inches long, 2.25 inches tall, and 2 inches wide, the largest hailstone on record for the state.
2
3
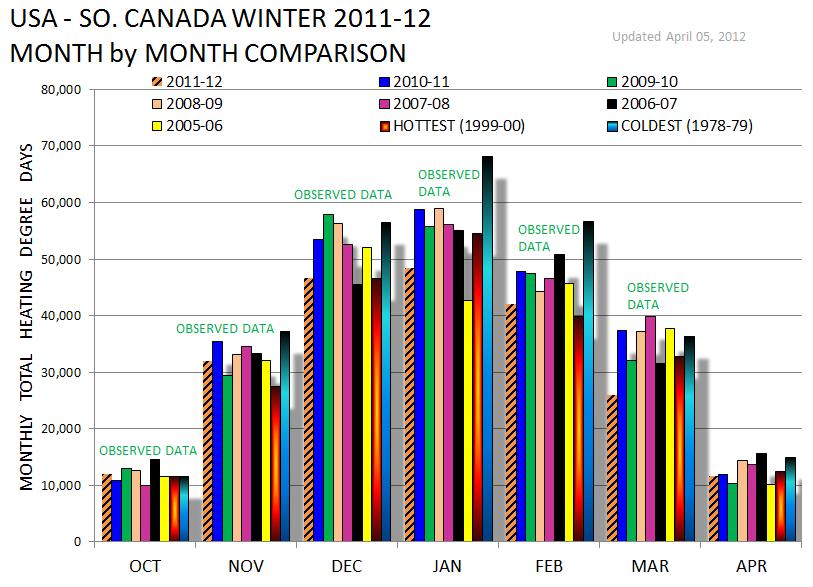
4 Year to Date (January March) The first three months of 2012 were also record warm for the contiguous United States with an average temperature of 42.0 F, which is 6.0 F ABOVE the long term average. For the January March period, 25 states east of the Rockies had three month average temperatures which were the warmest on record, and an additional 16 states had temperatures for the first quarter of 2012 ranking among their ten warmest. Numerous cities had a record warm January March, including Chicago, Boston, and Washington, D.C. No state in the Lower 48 had 3 month temperatures BELOW average. Alaskan temperatures during March, which are not included in the contiguous U.S. average value, ranked as the tenth coolest on record, contributing to Alaska having its ninth coolest January March period. The Alaskan year to date temperature was 5.2 F BELOW average. The nationally averaged precipitation total for January March was 0.29 inch below the long term average. States across the Pacific Northwest and Southern Plains were wetter than average, while the Intermountain West, parts of the Ohio Valley, and the entire Eastern Seaboard were drier than average. For the January to March (year to date) period, the USCEI was 39 percent, nearly twice the long term average and the highest value on record for the period. The predominant factor in this elevated value was the large area of the contiguous U.S. experiencing ongoing extremes in warm maximum and minimum temperatures. Warm temperature extremes during the first three months of 2012 had a large impact across the country, with 74 percent of the country experiencing extremes in warm maximum temperatures and 63 percent by extremes in warm minimum temperatures. Record extent of both warm maximum and minimum temperatures dominated across most of the Northeast, Upper Midwest, Ohio Valley, Northern Rockies and Plains, Southeast and South regions. Half of the Southeast region experienced extremes caused by drought and a record 27 percent of the South region experienced extremes caused by heavy 1 day precipitation events. Cold Season (October 2011 March 2012) The cold season, which is defined as October 2011 through March 2012 and an important period for national heating needs, was the second warmest on record for the contiguous U.S. with a nationallyaveraged temperature 3.8 F above average. Only the cold season of was warmer. Twenty one states across the Midwest and Northeast, areas of the country with high seasonal heating demands, were record warm for the six month period. For the cold season (October 2011 March 2012), the USCEI ranked second highest on record with 38 percent of the contiguous U.S. impacted by a combination of extremes, primarily from warm temperatures and ongoing regional drought and wet spells. A record 100 percent of the Northeast and Upper Midwest regions were impacted by extremes in both warm maximum and minimum temperatures during this season. The Ohio Valley and Southeast regions had between 90 percent and 100 percent coverage in extreme temperatures. 12 Month Period (April 2011 March 2012) The 12 month period (April 2011 March 2012), which includes the second hottest summer (June August) and fourth warmest winter (December February), was the warmest such period for the contiguous United States. Twenty eight states were record warm for the 12 month period, and an additional eleven states had April March temperatures ranking among their ten warmest. Oregon and Washington were the only states cooler than average for the period. The 12 month running average temperature for the contiguous U.S. was 55.4 F, which is 2.6 F above the 20th century average.
5
6
7
8
9
 is located well")

10 The following graphic shows the upper level storm track, measured at approximately 18,000 feet above sea level, averaged for MARCH 2012: Notice that the main core of the jet (5,300 to 5,500 meter heights, light GREEN and Dark BLUE) is located well north, well into central and northern Canada, nearly identical to the February mean position. As a result, no cold air intrusions were allowed to enter the continental USA, equating to wide spread warmth and large areas with ABOVE NORMAL temperatures.
: As stated")

11 This displacement of the main jet stream core during MARCH 2012 is quite evident in the departure from normal positioning (above), again reinforcing the ABOVE NORMAL temperatures observed nationwide during March, versus the main jet core during a normal March (below): As stated above, and according to the U.S. Drought Monitor, as of April 3rd, 36.8 percent of the contiguous U.S. was in drought, a decrease from 38.7 percent at the end of February. Above average precipitation across the Southern Plains improved long term drought conditions across TX, OK, and KS.


12 Our long range forecast model did very well last month in suggesting ABOVE NORMAL temperatures, although as with all models participating in predicting MARCH 2012, we came way underneath the extremes observed missing the extreme departures by 8 16 F. When applying analog mapping, of course, it is impossible to hit all time extremes. Our extended precipitation forecast for MARCH 2012 was very good as well, isolating the BELOW NORMAL precipitation from the SW USA to the northern plains. These graphics depict our model forecasts for MARCH 2012 made at the end of FEBRUARY 2012:


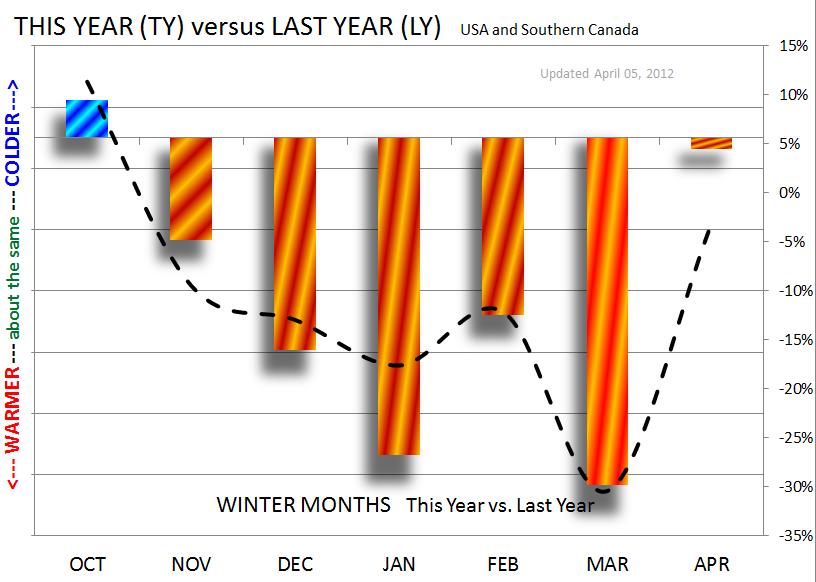
13 These graphics depict actual conditions occurring in MARCH 2012: The following graphics depict MARCH 2012 departure from normal temperatures compared to those of MARCH 2011 (this year to last year; LY to TY ): The following graphics depict MARCH 2012 departure from normal precipitation compared to MARCH 2011 (this year to last year; LY to TY ):
14 Here are our regional climatic hub center weather station verifications for MARCH 2012: Regional City and State MO. TEMPS ( F) MO. PRECIP. (ins.) MO. SNOWFALL (ins.) OBS NOR DFN OBS NOR DFN (%) OBS NOR DFN Honolulu HI % Seattle WA % % Portland OR % % Spokane Intl WA % % Pendleton OR % % Santa Rosa CA % LA Airport CA % Redding CA % Sacramento CA % Fresno CA % Winnemucca NV % % Tonopah NV % Phoenix AZ % Albuquerque NM % % Salt Lake City UT % % Grand Junction CO % % OBS = Observed, DFN = Departure from NORMAL Regional City and State MO. TEMPS ( F) MO. PRECIP. (ins.) MO. SNOWFALL (ins.) OBS NOR DFN OBS NOR DFN (%) OBS NOR DFN Great Falls MT % % Casper WY % % Denver CO % Grand Forks ND % % Rapid City SD % % Omaha NE % Kansas City MO % % Oklahoma City OK % Lubbock TX % Dallas Ft. Worth TX % San Antonio TX % Minneapolis MN % % Green Bay WI % % Detroit MI % %
15 Regional City and State MO. TEMPS ( F) MO. PRECIP. (ins.) MO. SNOWFALL (ins.) OBS NOR DFN OBS NOR DFN (%) OBS NOR DFN Buffalo NY % % Burlington VT % % Boston MA % % Pittsburgh PA % % Philadelphia PA % Baltimore MD % Chicago O'Hare IL % Indianapolis IN % % Louisville KY % % New Orleans LA % Raleigh Durham NC % Wilmington NC % Atlanta GA % Tallahassee FL % Orlando FL % OBS = Observed, DFN = Departure from NORMAL Regional City and State MO. TEMPS ( F) MO. PRECIP. (ins.) MO. SNOWFALL (ins.) OBS NOR DFN OBS NOR DFN (%) OBS NOR DFN Prince George BC % % Edmonton AB % % Saskatoon SK % % Winnipeg MB % % Kenora ON % % Timmins ON % % Muskoka ON % % Toronto ON % % Ottawa ON % % Barrow AK % % Nome AK % % Fairbanks AK % % Anchorage AK % % Juneau AK % Regional City and State OBS = Observed, DFN = Departure from NORMAL MO. TEMPS ( F) MO. PRECIP. (ins.) MO. SNOWFALL (ins.) OBS NOR DFN OBS NOR DFN (%) OBS NOR DFN Continental US % % So. Canada % % Alaska % %

16 Weak La Niña conditions emerged in early August 2011 became weak/moderate strength during northern autumn 2011, stayed at that level through most of northern winter, and returned to a weak level beginning in mid February As of mid March 2012, SST anomalies remain in weak La Niña territory in the central and east central equatorial Pacific, but have become warmer than average in the eastern part of the basin. For February the SST anomaly in the NINO3.4 region was 0.69 C, indicative of weak La Niña conditions, and for the December February season the anomaly was 0.94 C. The current east central tropical Pacific SSTs have continued to be below average and at a level indicative of La Niña, but have been warming toward the 0.45 threshold that would mark reentry to neutral conditions. Subsurface temperatures across the equatorial Pacific have weakened to near average during late February and early March, both because of weakening of the cold pool beneath the surface in the east central tropical Pacific and the development of above average water temperatures near and at the surface in the eastern portion. The currently weak La Niña condition is expected to dissipate during late March or early April as the coupled system returns to neutral and the west to east SST anomaly gradient from just west of the dateline to near the South American coast weakens due to the expected dissipation of enhanced low level easterlies west of the dateline and weakening of the current westerly anomalies associated with the above average SST in the eastern part of the basin. As of mid March, most of the dynamical and statistical models predict below average, but ENSO neutral, conditions for the Mar May season, while only a few continue to show weak La Niña condition. All models indicate warming from their starting anomaly values. For the Mar May season, 21% of the models indicate La Niña conditions, and 79% indicate neutral conditions. For Apr Jun, these figures become 8% and 92%, respectively. Jumping ahead to Jul Aug Sep, 73% indicate neutral conditions and 27% predict El Niño conditions. At lead times of 4 or more months into the future, statistical and dynamical models that incorporate information about the ocean's observed subsurface thermal structure generally exhibit higher predictive skill than those that do not. Among models that do use subsurface temperature information, 76% predict ENSO neutral SSTs for the Jul Sep 2012 season, none predict La Niña conditions, and 24% predict El Niño conditions.
17 Predicted ENSO Values and all (multiple) NWS Model Variance
 trends were added; 1991 and 1999 most of these years were")
18 WeatherBank Forecast In late MARCH, I reviewed the trend mapping pattern or comparisons for all years, using this period to isolate the trends: FEB 1 st MAR 30 th which appears as follows: A number of years defined by earlier analysis, such as 1953, 1954, 1961, 1977 and 2005, were all reviewed again, and two new (close in comparison) trends were added; 1991 and 1999 most of these years were later dropped from further analysis due to being out of range, although I held onto 1961 and 1977, as being close: Recall, since early MARCH, our model had been operating on using: 12.5%, 12.5%, 12.5%, 25.0%, and 37.5%.


19 This grouping appeared as: At this point, ONLY 1981 and 2000 seemed to adequately recognized 2012 s extreme temperature departures so only these were installed. Calibration of these years for FEB 1 MARCH 30 th, looks like:


20 which matches actual conditions very well: Thus, 1980 and 2000 were installed as 50% 50% as the new trend mapping, giving rise to these departures for APRIL, MAY and JUNE: April 2012

21 May 2012 June 2012 Thus, WeatherBank s forecast is as follows: APRIL 2012 Monthly Temperature Departures APRIL 2012 Monthly Precipitation Departures


22 MAY 2012 Monthly Temperature Departures MAY 2012 Monthly Precipitation Departures JUNE 2012 Monthly Temperature Departures JUNE 2012 Monthly Precipitation Departures
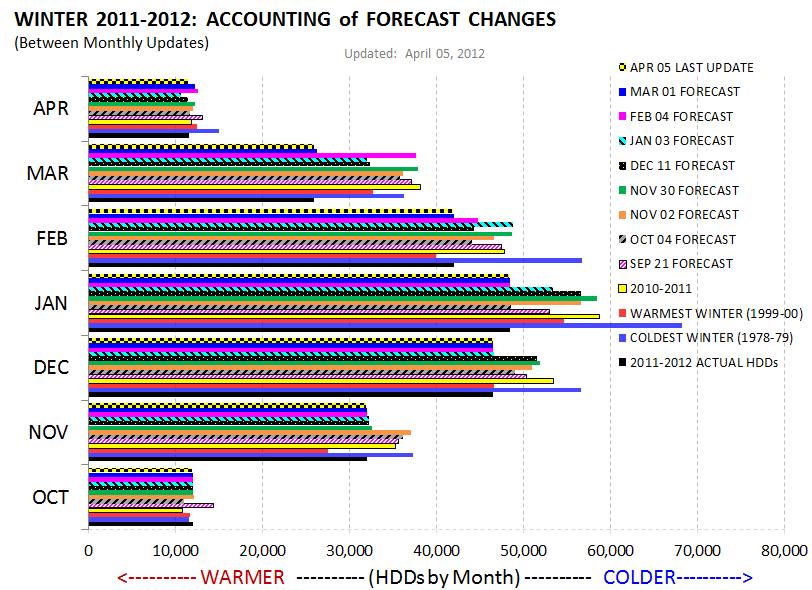
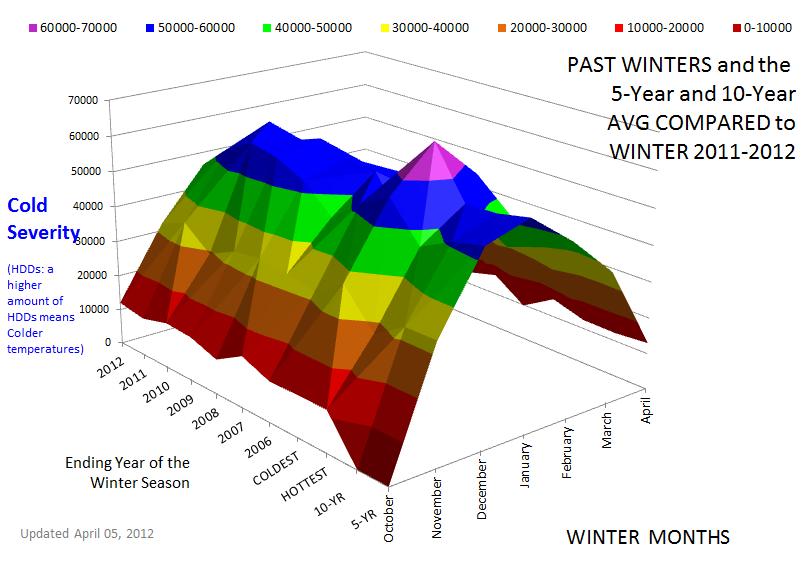
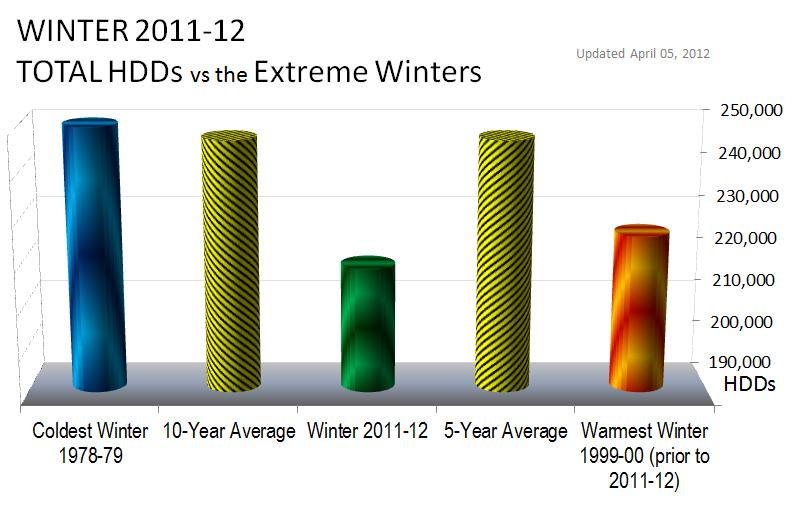
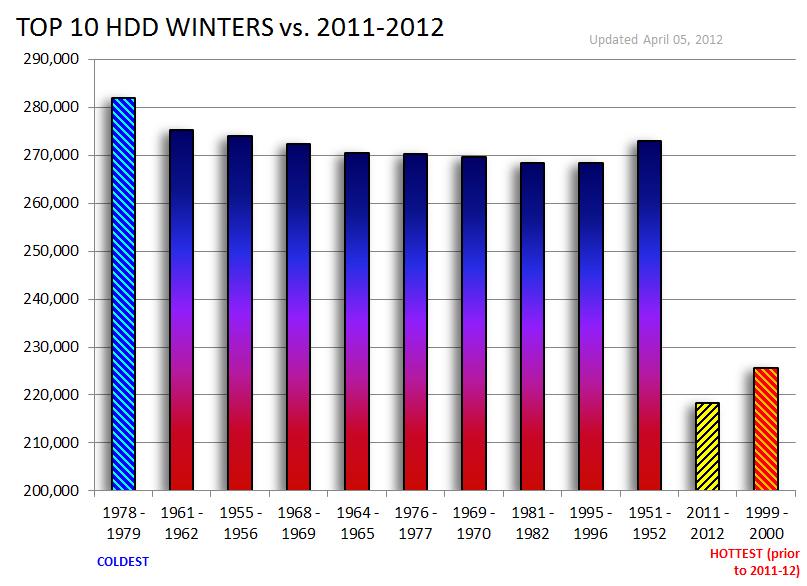
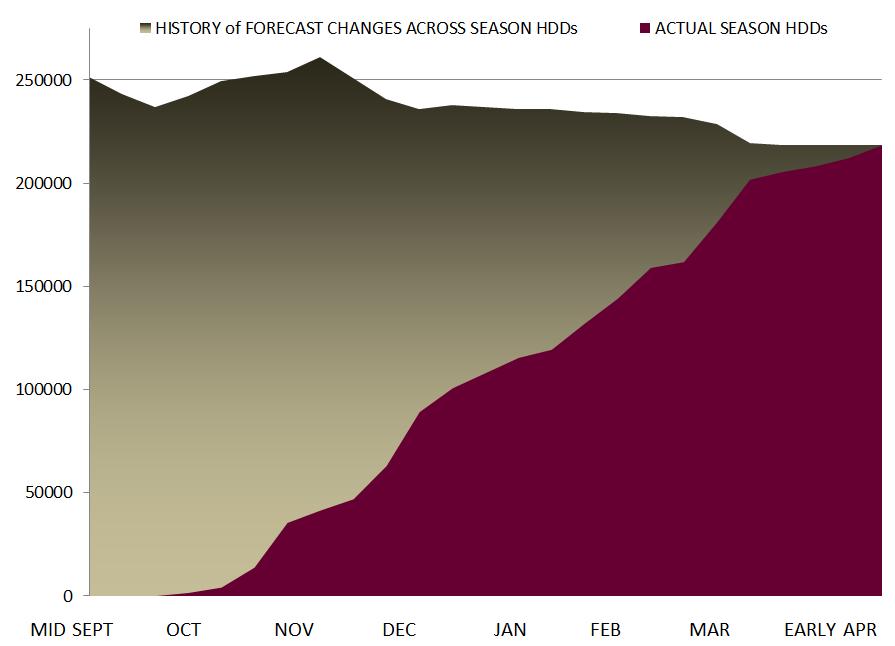
23 WeatherBank s Winter Forecast Forecast Monthly Numerical Ratings for WINTER (out of 62 past winters from ): Forecast Made Oct. 2, 2011: o Winter Full USA: 236,781 HDDs; 57 th Coldest; o Winter GCS: 67,767 HDDs; 56 th Coldest; (GCS = Gas Consuming States) Forecast Made Oct. 31, 2011: o Winter Full USA: 251,773 HDDs; 42 nd Coldest; o Winter GCS: 74,756 HDDs; 33 rd Coldest; (GCS = Gas Consuming States) Forecast Made Dec. 11, 2011: o Winter Full USA: 240,908 HDDs; 57 TH Coldest; o Winter GCS: 67,162 HDDs; 60 TH Coldest; (GCS = Gas Consuming States) Forecast Made Jan. 03, 2012: o Winter Full USA: 238,039 HDDs; 57 TH Coldest; o Winter GCS: 69,310 HDDs; 56 TH Coldest; (GCS = Gas Consuming States) Forecast Made Feb. 1, 2012: o Winter Full USA: 233,868 HDDs; 59 TH Coldest; o Winter GCS: 66,716 HDDs; 58 TH Coldest; (GCS = Gas Consuming States) Forecast Made March 4, 2012: o Winter Full USA: 227,596 HDDs; 61 st Coldest; o Winter GCS: 64,163 HDDs; 62 nd Coldest; (GCS = Gas Consuming States) Forecast Made April 1, 2012: o Winter Full USA: 218,380 HDDs; 62 nd Coldest; o Winter GCS: 60,372 HDDs; 62 nd Coldest; (GCS = Gas Consuming States) Winter : 256,166 HDDs; Winter : 245,800 HDDs; Winter : 257,204 HDDs; Winter : 253,625 HDDs; Winter : 246,650 HDDs; 5-Year Winter Average: 251,889 HDDs 10-Year Winter Average: 247,137 HDDs WARMEST WINTER since : ,753 HDDs (not counting ) COLDEST WINTER since : ,056 HDDs
24
25
26
27
28
29 Background Methodology for the WeatherBank LROM Using observed calendar day MAX and MIN temperatures at major cities across North America, WeatherBank generates daily Heating Degree Days (HDDs) and Daily Cooling Degree Days (CDDs). By comparing observations of HDDs in winter and CDDs during summer, one may obtain a real time description of how warm or cold the current season is. Basically, the hotter a location is in summer, or colder in winter, the more degree days that location earns. By adding all degree days from all locations, one can obtain a relative description of the current season. By comparing the current season to the degree days totals for past seasons, one obtains a ranking of the current season. WeatherBank's Long Range Outlook Model (LROM) fundamentally assumes that future weather patterns will be similar to a highly correlating, past weather pattern that was determine by trend mapping. All similar weather trends of the past are compared to the current weather trend, then analyzed using a variety of tests. Global inputs such as MEI, average upper level flow patterns, etc., are also used. Correlation coefficients for each input years are generated, and used to define the relative strength of each year and how that trend could be used in the forecast process. Since mid August 2007, strong correlations have remained between the equally weighted (same calendar 13 week period called current, to the same 13 week period of all past years; no lag applied) time periods of the past.
Monthly Long Range Weather Commentary Issued: February 04, 2012 Steven A. Root, CCM, President/CEO
 Monthly Long Range Weather Commentary Issued: February 04, 2012 Steven A. Root, CCM, President/CEO sroot@weatherbank.com Severe thunderstorms spawned tornadoes northeast of Birmingham, Alabama on January
Monthly Long Range Weather Commentary Issued: March 06, 2012 Steven A. Root, CCM, President/CEO
 Monthly Long Range Weather Commentary Issued: March 06, 2012 Steven A. Root, CCM, President/CEO sroot@weatherbank.com Warmer than average temperatures dominated the northern and eastern regions of the
Monthly Long Range Weather Commentary Issued: July 18, 2014 Steven A. Root, CCM, President/CEO
 Monthly Long Range Weather Commentary Issued: July 18, 2014 Steven A. Root, CCM, President/CEO sroot@weatherbank.com JUNE 2014 REVIEW Climate Highlights The Month in Review The average temperature for
SEPTEMBER 2013 REVIEW
 Monthly Long Range Weather Commentary Issued: October 21, 2013 Steven A. Root, CCM, President/CEO sroot@weatherbank.com SEPTEMBER 2013 REVIEW Climate Highlights The Month in Review The average temperature
Monthly Long Range Weather Commentary Issued: APRIL 1, 2015 Steven A. Root, CCM, President/CEO
 Monthly Long Range Weather Commentary Issued: APRIL 1, 2015 Steven A. Root, CCM, President/CEO sroot@weatherbank.com FEBRUARY 2015 Climate Highlights The Month in Review The February contiguous U.S. temperature
Monthly Long Range Weather Commentary Issued: APRIL 18, 2017 Steven A. Root, CCM, Chief Analytics Officer, Sr. VP,
 Monthly Long Range Weather Commentary Issued: APRIL 18, 2017 Steven A. Root, CCM, Chief Analytics Officer, Sr. VP, sroot@weatherbank.com MARCH 2017 Climate Highlights The Month in Review The average contiguous
Monthly Long Range Weather Commentary Issued: May 15, 2014 Steven A. Root, CCM, President/CEO
 Monthly Long Range Weather Commentary Issued: May 15, 2014 Steven A. Root, CCM, President/CEO sroot@weatherbank.com APRIL 2014 REVIEW Climate Highlights The Month in Review The average temperature for
Monthly Long Range Weather Commentary Issued: SEPTEMBER 19, 2016 Steven A. Root, CCM, Chief Analytics Officer, Sr. VP,
 Monthly Long Range Weather Commentary Issued: SEPTEMBER 19, 2016 Steven A. Root, CCM, Chief Analytics Officer, Sr. VP, sroot@weatherbank.com SEPTEMBER 2016 Climate Highlights The Month in Review The contiguous
Monthly Long Range Weather Commentary Issued: February 15, 2015 Steven A. Root, CCM, President/CEO
 Monthly Long Range Weather Commentary Issued: February 15, 2015 Steven A. Root, CCM, President/CEO sroot@weatherbank.com JANUARY 2015 Climate Highlights The Month in Review During January, the average
Monthly Long Range Weather Commentary Issued: APRIL 25, 2016 Steven A. Root, CCM, Chief Analytics Officer, Sr. VP, sales
 Monthly Long Range Weather Commentary Issued: APRIL 25, 2016 Steven A. Root, CCM, Chief Analytics Officer, Sr. VP, sales sroot@weatherbank.com MARCH 2016 Climate Highlights The Month in Review The March
Monthly Long Range Weather Commentary Issued: NOVEMBER 16, 2015 Steven A. Root, CCM, Chief Analytics Officer, Sr. VP, sales
 Monthly Long Range Weather Commentary Issued: NOVEMBER 16, 2015 Steven A. Root, CCM, Chief Analytics Officer, Sr. VP, sales sroot@weatherbank.com OCTOBER 2015 Climate Highlights The Month in Review The
Monthly Long Range Weather Commentary Issued: July 9, 2012 Steven A. Root, CCM, President/CEO JUNE 2012
 Monthly Long Range Weather Commentary Issued: July 9, 2012 Steven A. Root, CCM, President/CEO sroot@weatherbank.com JUNE 2012 June Background The average temperature for the contiguous United States during
Monthly Long Range Weather Commentary Issued: SEPTEMBER 19, 2015 Steven A. Root, CCM, Chief Analytics Officer, Sr. VP, sales
 Monthly Long Range Weather Commentary Issued: SEPTEMBER 19, 2015 Steven A. Root, CCM, Chief Analytics Officer, Sr. VP, sales sroot@weatherbank.com AUGUST 2015 Climate Highlights The Month in Review The
Weather and Climate Summary and Forecast Winter
 Weather and Climate Summary and Forecast Winter 2016-17 Gregory V. Jones Southern Oregon University February 7, 2017 What a difference from last year at this time. Temperatures in January and February
Weather and Climate Summary and Forecast Summer 2017
 Weather and Climate Summary and Forecast Summer 2017 Gregory V. Jones Southern Oregon University August 4, 2017 July largely held true to forecast, although it ended with the start of one of the most extreme
Champaign-Urbana 1999 Annual Weather Summary
 Champaign-Urbana 1999 Annual Weather Summary ILLINOIS STATE WATER SURVEY 2204 Griffith Dr. Champaign, IL 61820 wxobsrvr@sws.uiuc.edu Maria Peters, Weather Observer A major snowstorm kicked off the new
Weather and Climate Summary and Forecast March 2018 Report
 Weather and Climate Summary and Forecast March 2018 Report Gregory V. Jones Linfield College March 7, 2018 Summary: The ridge pattern that brought drier and warmer conditions from December through most
Weather and Climate Summary and Forecast January 2018 Report
 Weather and Climate Summary and Forecast January 2018 Report Gregory V. Jones Linfield College January 5, 2018 Summary: A persistent ridge of high pressure over the west in December produced strong inversions
Weather and Climate Summary and Forecast Winter
 Weather and Climate Summary and Forecast Winter 2016-17 Gregory V. Jones Southern Oregon University December 5, 2016 Well after an October that felt more like November, we just finished a November that
Weather and Climate Summary and Forecast April 2018 Report
 Weather and Climate Summary and Forecast April 2018 Report Gregory V. Jones Linfield College April 4, 2018 Summary: A near Miracle March played out bringing cooler and wetter conditions to the majority
Weather and Climate Summary and Forecast January 2019 Report
 Weather and Climate Summary and Forecast January 2019 Report Gregory V. Jones Linfield College January 4, 2019 Summary: December was mild and dry over much of the west, while the east was much warmer than
Weather and Climate Summary and Forecast Fall/Winter 2016
 Weather and Climate Summary and Forecast Fall/Winter 2016 Gregory V. Jones Southern Oregon University November 5, 2016 After a year where we were seemingly off by a month in terms of temperatures (March
Weather and Climate Summary and Forecast February 2018 Report
 Weather and Climate Summary and Forecast February 2018 Report Gregory V. Jones Linfield College February 5, 2018 Summary: For the majority of the month of January the persistent ridge of high pressure
Champaign-Urbana 2001 Annual Weather Summary
 Champaign-Urbana 2001 Annual Weather Summary ILLINOIS STATE WATER SURVEY 2204 Griffith Dr. Champaign, IL 61820 wxobsrvr@sws.uiuc.edu Maria Peters, Weather Observer January: After a cold and snowy December,
Weather and Climate Summary and Forecast October 2017 Report
 Weather and Climate Summary and Forecast October 2017 Report Gregory V. Jones Linfield College October 4, 2017 Summary: Typical variability in September temperatures with the onset of fall conditions evident
Weather and Climate Summary and Forecast December 2017 Report
 Weather and Climate Summary and Forecast December 2017 Report Gregory V. Jones Linfield College December 5, 2017 Summary: November was relatively cool and wet from central California throughout most of
Champaign-Urbana 1998 Annual Weather Summary
 Champaign-Urbana 1998 Annual Weather Summary ILLINOIS STATE WATER SURVEY Audrey Bryan, Weather Observer 2204 Griffith Dr. Champaign, IL 61820 wxobsrvr@sparc.sws.uiuc.edu The development of the El Nìno
Weather and Climate Summary and Forecast November 2017 Report
 Weather and Climate Summary and Forecast November 2017 Report Gregory V. Jones Linfield College November 7, 2017 Summary: October was relatively cool and wet north, while warm and very dry south. Dry conditions
Weather and Climate Summary and Forecast March 2019 Report
 Weather and Climate Summary and Forecast March 2019 Report Gregory V. Jones Linfield College March 2, 2019 Summary: Dramatic flip from a mild winter to a top five coldest February on record in many locations
Weather and Climate Summary and Forecast Summer into Harvest 2016
 Weather and Climate Summary and Forecast Summer into Harvest 2016 Gregory V. Jones Southern Oregon University September 3, 2016 With school and football season starting a hint of fall is right on time
Weather and Climate Summary and Forecast Summer 2016
 Weather and Climate Summary and Forecast Summer 2016 Gregory V. Jones Southern Oregon University June 6, 2016 May 2016 continued the warm trend for portions of the west, while providing some relief for
Weather and Climate Summary and Forecast August 2018 Report
 Weather and Climate Summary and Forecast August 2018 Report Gregory V. Jones Linfield College August 5, 2018 Summary: July 2018 will likely go down as one of the top five warmest July s on record for many
Winter Forecast. Allan Huffman RaleighWx
 Winter 2015-16 Forecast Allan Huffman RaleighWx Disclaimer Seasonal forecasting is difficult and you are always learning. I attempt to look at all factors I understand and have seen correlate in the past
Weather and Climate Summary and Forecast October 2018 Report
 Weather and Climate Summary and Forecast October 2018 Report Gregory V. Jones Linfield College October 4, 2018 Summary: Much of Washington, Oregon, coastal California and the Bay Area and delta region
Weather and Climate Summary and Forecast Summer 2016
 Weather and Climate Summary and Forecast Summer 2016 Gregory V. Jones Southern Oregon University August 5, 2016 The month of July saw the continued flip, flop of the western US temperatures. It was warm
National Wildland Significant Fire Potential Outlook
 National Wildland Significant Fire Potential Outlook National Interagency Fire Center Predictive Services Issued: September, 2007 Wildland Fire Outlook September through December 2007 Significant fire
Climate Variability and El Niño
 Climate Variability and El Niño David F. Zierden Florida State Climatologist Center for Ocean Atmospheric Prediction Studies The Florida State University UF IFAS Extenstion IST January 17, 2017 The El
The Pennsylvania Observer
 The Pennsylvania Observer January 5, 2016 December 2015 - Pennsylvania Weather Recap By: Arthur Person December is the first of the three coldest months of the year. Sometimes it can be naughty, and sometimes
2011 Year in Review TORNADOES
 2011 Year in Review The year 2011 had weather events that will be remembered for a long time. Two significant tornado outbreaks in April, widespread damage and power outages from Hurricane Irene in August
Northwest Outlook October 2016
 Northwest Outlook October 2016 Rainfall Opportunities and Challenges Rainfall over the month of September presented some challenges for the fall harvest while other producers benefitted. Figure 1a shows
ACCUMULATED PRECIPITATION IN INCHES
 4 3 CUMULATIVE PRECIPITATION WATER YEAR 7 COLUMBIA BASIN ABOVE GRAND COULEE 18% of Normal 1971- Average ACCUMULATED PRECIPITATION IN INCHES 1 3 1 4 3 1 8 6 4 94% of Normal 17% of Normal 118% of Normal
2015 Summer Forecast
 2015 Summer Forecast Inside This Forecast Summer 2014 Recap 2 Implications of El Niño and the PDO on the Upcoming Summer Summary of Global Indices & Oscillations Analog Year: The Midwest a battleground
ENSO UPDATE By Joseph D Aleo, CCM
 ENSO UPDATE By Joseph D Aleo, CCM El Nino is still hanging on but likely not for very long. Warmer than normal water can still be seen along the equator in the tropical Pacific. It is even warmer in the
Winter Forecast. Allan Huffman RaleighWx
 Winter 2014-15 Forecast Allan Huffman RaleighWx Winter 2014-15 Combination of weak/moderate El Nino/+PDO/-QBO and well above average snow cover and snow cover increase this Fall in Siberia point to a winter
Seasonal Climate Outlook for South Asia (June to September) Issued in May 2014
 Issued in May 2014") Ministry of Earth Sciences Earth System Science Organization India Meteorological Department WMO Regional Climate Centre (Demonstration Phase) Pune, India Seasonal Climate Outlook for South Asia (June
Ministry of Earth Sciences Earth System Science Organization India Meteorological Department WMO Regional Climate Centre (Demonstration Phase) Pune, India Seasonal Climate Outlook for South Asia (June
Impacts of the April 2013 Mean trough over central North America
 Impacts of the April 2013 Mean trough over central North America By Richard H. Grumm National Weather Service State College, PA Abstract: The mean 500 hpa flow over North America featured a trough over
The Pennsylvania Observer
 The Pennsylvania Observer May 31, 2012 May 2012 - Pennsylvania Weather Recap By: Paul Knight The majority of the fifth month had temperatures averaging well above seasonal levels with two distinct hot
What Is the Weather Like in Different Regions of the United States?
 Learning Set 1 What Is Weather, and How Is It Measured and Described? 1.3 Explore What Is the Weather Like in Different Regions of the United States? trends: patterns or tendencies you can see over a broad
Here s what a weak El Nino usually brings to the nation with temperatures:
 Time again for my annual Winter Weather Outlook. Here's just a small part of the items I considered this year and how I think they will play out with our winter of 2018-2019. El Nino / La Nina: When looking
2015: A YEAR IN REVIEW F.S. ANSLOW
 2015: A YEAR IN REVIEW F.S. ANSLOW 1 INTRODUCTION Recently, three of the major centres for global climate monitoring determined with high confidence that 2015 was the warmest year on record, globally.
The Pennsylvania Observer
 The Pennsylvania Observer October 1, 2015 September 2015 - Pennsylvania Weather Recap By: Quinn Lease The month of September will be remembered for its above normal temperatures and dry conditions that
MDA WEATHER SERVICES AG WEATHER OUTLOOK. Kyle Tapley-Senior Agricultural Meteorologist May 22, 2014 Chicago, IL
 MDA WEATHER SERVICES AG WEATHER OUTLOOK Kyle Tapley-Senior Agricultural Meteorologist May 22, 2014 Chicago, IL GLOBAL GRAIN NORTH AMERICA 2014 Agenda Spring Recap North America Forecast El Niño Discussion
Climate Outlook through 2100 South Florida Ecological Services Office Vero Beach, FL January 13, 2015
 Climate Outlook through 2100 South Florida Ecological Services Office Vero Beach, FL January 13, 2015 Short Term Drought Map: Short-term (
J8.4 TRENDS OF U.S. SNOWFALL AND SNOW COVER IN A WARMING WORLD,
 J8.4 TRENDS OF U.S. SNOWFALL AND SNOW COVER IN A WARMING WORLD, 1948-2008 Richard R. Heim Jr. * NOAA National Climatic Data Center, Asheville, North Carolina 1. Introduction The Intergovernmental Panel
Verification Of January HDD Forecasts
 Verification Of January HDD Forecasts W2020 / Average HDD stands for Heating Degree Day. A Heating Degree Day is zero if the average temperature is 65 degrees. An HDD of -30 would mean an average temperature
2013 Summer Weather Outlook. Temperatures, Precipitation, Drought, Hurricanes and why we care
 2013 Summer Weather Outlook Temperatures, Precipitation, Drought, Hurricanes and why we care Role of the ERCOT Meteorologist Forecasts Develop temperature input for hourly load forecasts (next day, days
New Zealand Climate Update No 223, January 2018 Current climate December 2017
 New Zealand Climate Update No 223, January 2018 Current climate December 2017 December 2017 was characterised by higher than normal sea level pressure over New Zealand and the surrounding seas. This pressure
UPDATE OF REGIONAL WEATHER AND SMOKE HAZE (December 2017)
") UPDATE OF REGIONAL WEATHER AND SMOKE HAZE (December 2017) 1. Review of Regional Weather Conditions for November 2017 1.1 In November 2017, Southeast Asia experienced inter-monsoon conditions in the first
UPDATE OF REGIONAL WEATHER AND SMOKE HAZE (December 2017) 1. Review of Regional Weather Conditions for November 2017 1.1 In November 2017, Southeast Asia experienced inter-monsoon conditions in the first
Sierra Weather and Climate Update
 Sierra Weather and Climate Update 2014-15 Kelly Redmond Western Regional Climate Center Desert Research Institute Reno Nevada Yosemite Hydroclimate Workshop Yosemite Valley, 2015 October 8-9 Percent of
Minnesota s Climatic Conditions, Outlook, and Impacts on Agriculture. Today. 1. The weather and climate of 2017 to date
 Minnesota s Climatic Conditions, Outlook, and Impacts on Agriculture Kenny Blumenfeld, State Climatology Office Crop Insurance Conference, Sep 13, 2017 Today 1. The weather and climate of 2017 to date
Climate Outlook through 2100 South Florida Ecological Services Office Vero Beach, FL September 9, 2014
 Climate Outlook through 2100 South Florida Ecological Services Office Vero Beach, FL September 9, 2014 Short Term Drought Map: Short-term (
Summer 2018 Southern Company Temperature/Precipitation Forecast
 Scott A. Yuknis High impact weather forecasts, climate assessment and prediction. 14 Boatwright s Loop Plymouth, MA 02360 Phone/Fax 508.927.4610 Cell: 508.813.3499 ClimateImpact@comcast.net Climate Impact
KANSAS CLIMATE SUMMARY February 2015
 KANSAS CLIMATE SUMMARY February 2015 Extended Cold Despite some record warm readings at a few locations, February was characterized by colder than normal conditions. This was particularly true during the
2012 Growing Season Weather Summary for North Dakota. Adnan Akyüz and Barbara A. Mullins Department of Soil Science October 30, 2012
 2012 Growing Season Weather Summary for North Dakota Adnan Akyüz and Barbara A. Mullins Department of Soil Science October 30, 2012 Introduction The 2012 growing season (the period from April through September)
Colorado CoCoRaHS. Colorado CoCoRaHS. Because Every Drop Counts! November 2014 Volume 2, Issue 11
 U.S. PRECIPITATION (% OF AVERAGE) LOOKING BACK AT OCTOBER 2014 October was a fairly dry month for much of the nation with the exception of the Pacific Northwest, portions of New England and the Tennessee
Presentation Overview. Southwestern Climate: Past, present and future. Global Energy Balance. What is climate?
 Southwestern Climate: Past, present and future Mike Crimmins Climate Science Extension Specialist Dept. of Soil, Water, & Env. Science & Arizona Cooperative Extension The University of Arizona Presentation
Midwest/Great Plains Climate-Drought Outlook September 20, 2018
 Midwest/Great Plains Climate-Drought Outlook September 20, 2018 Brian Fuchs National Drought Mitigation Center University of Nebraska-Lincoln School of Natural Resources September 20, 2018 General Information
Nebraska experienced a wide
 Issue 1 August 2016 CLIMATE UPDATE A MONTHLY SUMMARY FROM THE neclimate.unl.edu August saw reprieve from dryness, cooler temps Overview Nebraska experienced a wide range of conditions across the state
Percentage of normal rainfall for April 2018 Departure from average air temperature for April 2018
 New Zealand Climate Update No 227, May 2018 Current climate April 2018 Overall, April 2018 was characterised by lower pressure than normal over and to the southeast of New Zealand. Unlike the first three
ALASKA REGION CLIMATE FORECAST BRIEFING. December 15, 2014 Rick Thoman NWS Alaska Region ESSD Climate Services
 ALASKA REGION CLIMATE FORECAST BRIEFING December 15, 2014 Rick Thoman NWS Alaska Region ESSD Climate Services Today Climate Forecast Basics Review of recent climate forecasts and conditions CPC Forecasts
Pacific Decadal Oscillation ( PDO ):
:") Time again for my annual Winter Weather Outlook. Here's just a small part of the items I considered this year and how I think they will play out with our winter of 2015-2016. El Nino / La Nina: When looking
Time again for my annual Winter Weather Outlook. Here's just a small part of the items I considered this year and how I think they will play out with our winter of 2015-2016. El Nino / La Nina: When looking
ACCUMULATED PRECIPITATION IN INCHES
 CUMULATIVE PRECIPITATION WATER YEAR COLUMBIA BASIN ABOVE GRAND COULEE 84% of Normal 1971- Average ACCUMULATED PRECIPITATION IN INCHES 8 6 82% of Normal 85% of Normal 82% of Normal SNAKE RIVER BASIN ABOVE
NATIONAL WEATHER SERVICE
 January 2016 February 9, 2016 This was a dry month across the HSA despite one large and several smaller snowfalls. Most locations ended up 1-2 inches below normal for the month. The driest locations at
ENSO Cycle: Recent Evolution, Current Status and Predictions. Update prepared by Climate Prediction Center / NCEP 23 April 2012
 ENSO Cycle: Recent Evolution, Current Status and Predictions Update prepared by Climate Prediction Center / NCEP 23 April 2012 Outline Overview Recent Evolution and Current Conditions Oceanic Niño Index
New Zealand Climate Update No 226, April 2018 Current climate March 2018
 New Zealand Climate Update No 226, April 2018 Current climate March 2018 March 2018 was characterised by significantly higher pressure than normal to the east of New Zealand. This pressure pattern, in
The Weather Wire. Contents: Summer 2018 Outlook. Summer 2018 Outlook Drought Monitor May Summary/Statistics June Preview Rainfall Totals
 The Weather Wire June 2018 Volume 25 Number 6 Contents: Summer 2018 Outlook Drought Monitor May Summary/Statistics June Preview Rainfall Totals Summer 2018 Outlook June 1 st marked the first day of meteorological
California 120 Day Precipitation Outlook Issued Tom Dunklee Global Climate Center
 California 120 Day Precipitation Outlook Issued 11-01-2008 Tom Dunklee Global Climate Center This is my second updated outlook for precipitation patterns and amounts for the next 4 s of the current rainy
Upper Missouri River Basin February 2018 Calendar Year Runoff Forecast February 6, 2018
 Upper Missouri River Basin February 2018 Calendar Year Runoff Forecast February 6, 2018 Calendar Year Runoff Forecast Explanation and Purpose of Forecast U.S. Army Corps of Engineers, Northwestern Division
Weather and Climate of the Rogue Valley By Gregory V. Jones, Ph.D., Southern Oregon University
 Weather and Climate of the Rogue Valley By Gregory V. Jones, Ph.D., Southern Oregon University The Rogue Valley region is one of many intermountain valley areas along the west coast of the United States.
NatGasWeather.com Daily Report
 NatGasWeather.com Daily Report Issue Time: 5:15 pm EST Sunday, February 28 th, 2016 for Monday, Feb 29 th 7-Day Weather Summary (February 28 th March 5 th ): High pressure will dominate much of the US
Office of the Washington State Climatologist
 Office of the Washington State Climatologist May 3, 2013 April Event Summary Average April temperatures were below normal for a majority of the state. Total precipitation was above normal for western and
U.S. Outlook For October and Winter Thursday, September 19, 2013
 About This report coincides with today s release of the monthly temperature and precipitation outlooks for the U.S. from the Climate Prediction Center (CPC). U.S. CPC October and Winter Outlook The CPC
UPDATE OF REGIONAL WEATHER AND SMOKE HAZE (February 2018)
") UPDATE OF REGIONAL WEATHER AND SMOKE HAZE (February 2018) 1. Review of Regional Weather Conditions for January 2018 1.1 The prevailing Northeast monsoon conditions over Southeast Asia strengthened in January
UPDATE OF REGIONAL WEATHER AND SMOKE HAZE (February 2018) 1. Review of Regional Weather Conditions for January 2018 1.1 The prevailing Northeast monsoon conditions over Southeast Asia strengthened in January
Colorado s 2003 Moisture Outlook
 Colorado s 2003 Moisture Outlook Nolan Doesken and Roger Pielke, Sr. Colorado Climate Center Prepared by Tara Green and Odie Bliss http://climate.atmos.colostate.edu How we got into this drought! Fort
UNITED STATES AND SOUTH AMERICA OUTLOOK (FULL REPORT) Wednesday, April 18, 2018
 Wednesday, April 18, 2018") T-storm Weather Summary Coolness continues over the next week in much of the central U.S., most likely producing the coldest April since 1907 in the Corn Belt, but followed by seasonable to mild weather
T-storm Weather Summary Coolness continues over the next week in much of the central U.S., most likely producing the coldest April since 1907 in the Corn Belt, but followed by seasonable to mild weather
Climate Impacts to Southwest Water Sector. Dr. Dave DuBois New Mexico State Climatologist
 Climate Impacts to Southwest Water Sector Dr. Dave DuBois New Mexico State Climatologist Presented at EPA Extreme Events and Climate Adaptation Planning Workshop June 3, 2015 Water Year Precip. % of Average
ENSO Cycle: Recent Evolution, Current Status and Predictions. Update prepared by Climate Prediction Center / NCEP July 26, 2004
 ENSO Cycle: Recent Evolution, Current Status and Predictions Update prepared by Climate Prediction Center / NCEP July 26, 2004 Outline Overview Recent Evolution and Current Conditions Oceanic NiZo Index
Champaign-Urbana 2000 Annual Weather Summary
 Champaign-Urbana 2000 Annual Weather Summary ILLINOIS STATE WATER SURVEY 2204 Griffith Dr. Champaign, IL 61820 wxobsrvr@sws.uiuc.edu Maria Peters, Weather Observer January: January started on a mild note,
INVISIBLE WATER COSTS
 Every Drop Every Counts... Drop Counts... INVISIBLE WATER COSTS Corn - 108.1 gallons per pound How much water it takes to produce... Apple - 18.5 gallons to grow Beef - 1,581 gallons per pound Oats - 122.7
An ENSO-Neutral Winter
 An ENSO-Neutral Winter This issue of the Blue Water Outlook newsletter is devoted towards my thoughts on the long range outlook for winter. You will see that I take a comprehensive approach to this outlook
JEFF JOHNSON S Winter Weather Outlook
 JEFF JOHNSON S 2017-2018 Winter Weather Outlook TABLE OF CONTENTS ABOUT THE AUTHOR Components of the seasonal outlook... 2 ENSO state/ocean temperatures... 3 Sub-seasonal outlooks... 4 Forecast models...
Midwest and Great Plains Climate and Drought Update
 Midwest and Great Plains Climate and Drought Update June 20,2013 Laura Edwards Climate Field Specialist Laura.edwards@sdstate.edu 605-626-2870 2012 Board of Regents, South Dakota State University General
Climate Prediction Center National Centers for Environmental Prediction
 NOAA s Climate Prediction Center Monthly and Seasonal Forecast Operations Wassila M. Thiaw Climate Prediction Center National Centers for Environmental Prediction Acknowlegement: Mathew Rosencrans, Arun
The Pennsylvania Observer
 The Pennsylvania Observer April 2, 2009 March 2009 Pennsylvania Weather Recap Prepared by Curt Harpster For the month of March the saying, In like a lion and out like a lamb really fit the pattern quite
Office of the Washington State Climatologist
 Office of the Washington State Climatologist May 2, 2014 April Event Summary April mean temperatures were near-normal with some tendency for the monthly anomalies to come in on the warmer side. Total April
Weekly Weather Briefing. NWS Albuquerque. Tuesday Soaker. NWS Albuquerque August 25, Weekly Weather Briefing
 Weekly Weather Briefing Weekly Weather Briefing Tuesday Soaker August 25, 2014 August 2014 vs. 2013 Precipitation Percent of Average August 1-24, 2014 August 2013 Weekly Weather Briefing ABQ **Preliminary**
The hydrologic service area (HSA) for this office covers Central Kentucky and South Central Indiana.
 for this office covers Central Kentucky and South Central Indiana.") January 2012 February 13, 2012 An X inside this box indicates that no flooding occurred within this hydrologic service area. January 2012 continued the string of wet months this winter. Rainfall was generally
January 2012 February 13, 2012 An X inside this box indicates that no flooding occurred within this hydrologic service area. January 2012 continued the string of wet months this winter. Rainfall was generally
Local Ctimatotogical Data Summary White Hall, Illinois
 SWS Miscellaneous Publication 98-5 STATE OF ILLINOIS DEPARTMENT OF ENERGY AND NATURAL RESOURCES Local Ctimatotogical Data Summary White Hall, Illinois 1901-1990 by Audrey A. Bryan and Wayne Armstrong Illinois
ENSO Cycle: Recent Evolution, Current Status and Predictions. Update prepared by Climate Prediction Center / NCEP 5 August 2013
 ENSO Cycle: Recent Evolution, Current Status and Predictions Update prepared by Climate Prediction Center / NCEP 5 August 2013 Outline Overview Recent Evolution and Current Conditions Oceanic Niño Index
The Pennsylvania Observer
 The Pennsylvania Observer April 2, 2010 March 2010 Pennsylvania Weather Recap Prepared by: Katelyn Johnson March did come in as a lion cub this year. The 1 st proved to be a calm day; however most of Pennsylvania