Monthly Long Range Weather Commentary Issued: February 04, 2012 Steven A. Root, CCM, President/CEO
|
|
|
- Christian Hunter
- 5 years ago
- Views:
Transcription
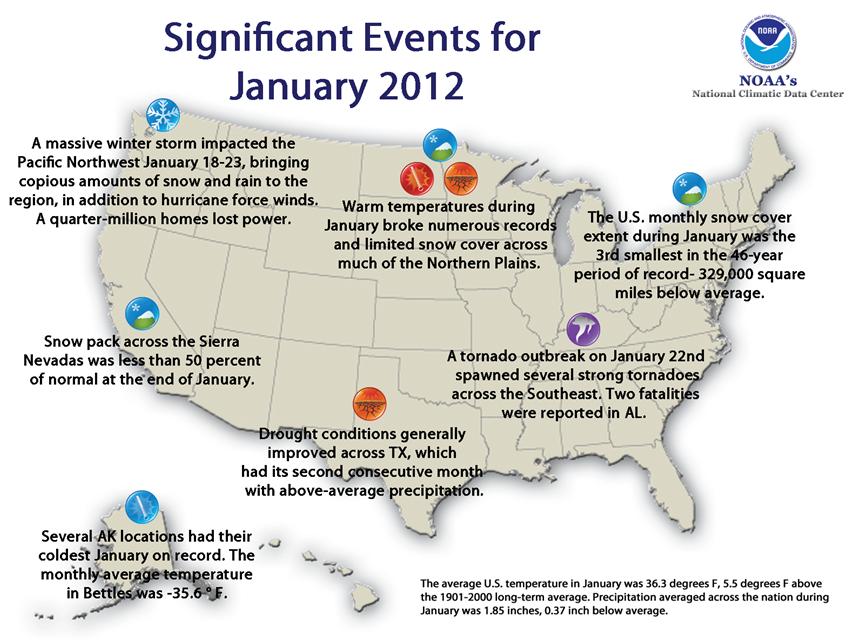
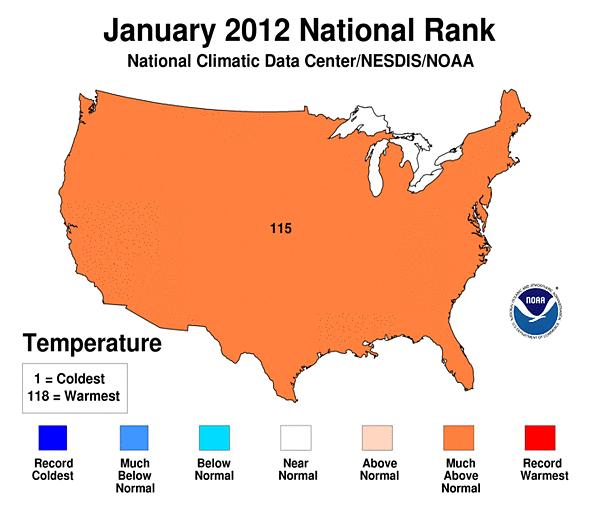
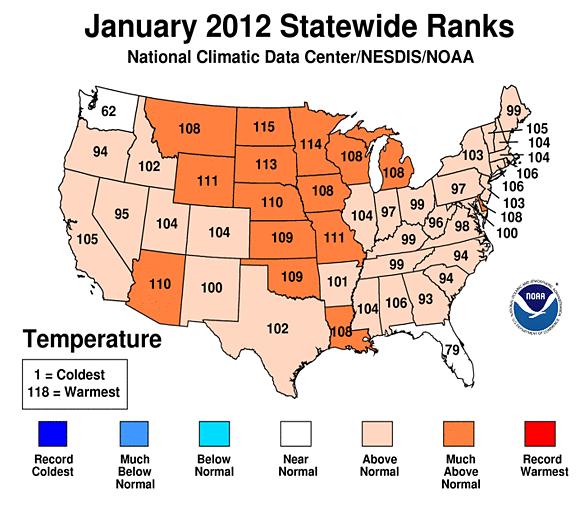
1 Monthly Long Range Weather Commentary Issued: February 04, 2012 Steven A. Root, CCM, President/CEO Severe thunderstorms spawned tornadoes northeast of Birmingham, Alabama on January 23rd, killing two people and injuring over 100 others. Damage was extensive as homes were destroyed, and trees and power lines were downed. By the next day, the National Weather Service confirmed two tornado paths across north central Tuscaloosa County and was working to confirm reports in other regions. The storm also produced tornadoes and dangerous conditions in Arkansas on the 22nd. No deaths were reported in that state. Several powerful storms earlier in the month also affected several states and injured dozens of people, including Texas, North Carolina, Ohio, Tennessee, Indiana, Kentucky, and Mississippi. In total, NOAA's Storm Prediction Center reported 97 preliminary tornado reports across the U.S. for the month, making January 2012 one of the top 10 busiest Januaries, with records dating back to The average contiguous U.S. temperature in January was 36.3 F, 5.5 F above the long term average the fourth warmest January on record, and the warmest since Precipitation, averaged across the nation, was 1.85 inches. This was 0.37 inch below the long term average, with variability between regions. This monthly analysis is based on records dating back to ABOVE NORMAL temperatures were widespread across the contiguous United States during January. Nine states AZ, KS, MN, MO, NE, ND, OK, SD, and WY had January temperatures ranking among their ten warmest. FL and WA were the only states with temperatures NEAR NORMAL, and no state was COLDER THAN NORMAL.
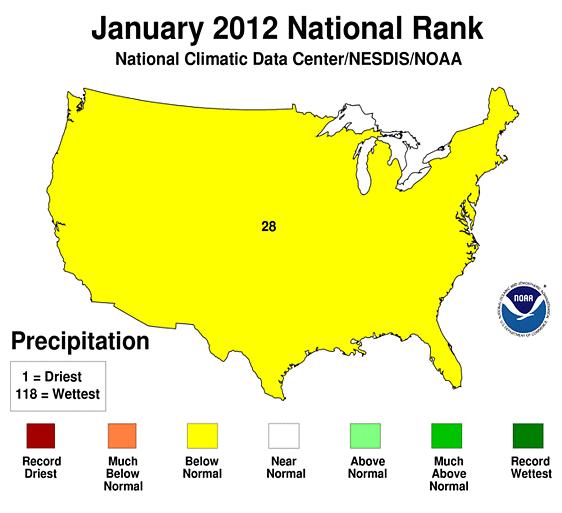
2 Many locations across the Northern Plains exceeded all time warm January maximum temperature records during the month, including Minot, North Dakota, which reached 61 F on January 5th. This surpassed the previous record of 59 F for the city, set on January 28th, In contrast to the contiguous United States being much warmer than average, several towns across Alaska had their coldest average January temperatures on record Nome ( 16.6 F), Bethel ( 17.3 F) McGrath ( 28.5 F), and Bettles ( 35.6 F). Precipitation totals were mixed across the United States during January. The Southern Plains and the Great Lakes were WETTER THAN NORMAL for the month, with Texas having ABOVE NORMAL precipitation for the second month in a row. Texas had not experienced two consecutive months with above average precipitation since January February BELOW NORMAL precipitation was observed for the Central Plains, where KS had its third driest January, and NE its eighth. The Southeast was also DRIER THAN NORMAL, where Florida had its eighth driest January on record. Many locations along Florida s Atlantic coast, which usually average over 2.5 inches of precipitation during January, had little to no precipitation during the month. Cities across the Northern Plains, Midwest, and Northeast had BELOW NORMAL snowfall during the month a result of warmer and drier than average conditions. According to the Rutgers Global Snow Lab, the average snow extent during January was 1.0 million square miles, which was 329,000 square miles BELOW the average. This marks the 3rd smallest January snow cover extent in the 46 year period of record. According to the U.S. Drought Monitor, as of January 31st, 2012, about 3.3 percent of the contiguous U.S. was experiencing the worst category of drought, called D4 or exceptional drought, about the same as the beginning of the month. However, the percent area of the U.S. experiencing drought of any severity increased from 31.9 percent at the beginning of January to 37.9 percent at the end of the month. Most of the drought expansion occurred across the Upper Midwest and the western states. The United States Climate Extremes Index (USCEI) and Regional Climate Extremes Index (RCEI) are sensitive to extremes in temperature, rainfall, dry streaks, drought, and tropical cyclones on the national and regional scale, respectively. During January, the USCEI was above average, driven by a large extent in warm maximum temperatures. The percent area of the U.S. experiencing extremes in warm maximum temperatures was 56 percent, which is the second highest value on record. Regionally, the West North Central, South, and West regions ranked 3rd or 4th highest for the extent of warm maximum temperature extremes. The first two months of the winter season, December and January, have been much warmer than average for the contiguous United States. This two month period was the fourth WARMEST on record with a season to date temperature 3.8 degrees F ABOVE NORMAL. Much of the warmth was anchored across the northern and eastern United States. Minnesota was record warm for the period, with a temperature 10.1 degrees F ABOVE NORMAL. A total of twenty two states from Montana to Maine had December 2011 January 2012 temperatures ranking among their ten warmest. Despite a large winter storm which impacted the western U.S. during January, much of the region was DRIER THAN NORMAL. CA had its fourth driest December January period, and MT had its sixth. WETTER THAN NORMAL conditions were observed in a string of states from NM to NY, with TX having its eleventh wettest December January period.
3
4
5


6 The following graphic shows the upper level storm track, measured at approximately 18,000 feet above sea level, averaged for JANUARY 2012:
, as the following graphic shows:")

7 No wonder why most of the USA had ABOVE NORMAL temperatures during JANUARY 2012, with the main storm track displaced well north (compared to average), as the following graphic shows: As stated above, the percent area of the U.S. experiencing drought of any severity increased from 31.9 percent at the beginning of January to 37.9 percent at the end of the month, as per:


8 Our long range forecast model did extremely well last month, more than adequately identifying the exaggerated warmth across the mid continent; precipitation forecasts did well also, isolating drier than normal conditions from NM to the Great Lakes, yet under stating moisture across the Pacific NW. These graphics depict our model forecasts for JANUARY 2012 made at the end of DECEMBER 2011: These graphics depict actual conditions occurring in JANUARY 2012:
: Regional City and State Here are our regional climatic hub center weather station verifications for")

9 The following graphics depict JANUARY 2012 departure from normal temperatures compared to those of JANUARY 2011 (this year to last year; LY to TY ): The following graphics depict JANUARY 2012 departure from normal precipitation compared to JANUARY 2011 (this year to last year; LY to TY ): Regional City and State Here are our regional climatic hub center weather station verifications for JANUARY 2012: MO. TEMPS ( F) MO. PRECIP. (ins.) MO. SNOWFALL (ins.) OBS NOR DFN OBS NOR DFN (%) OBS NOR DFN Honolulu HI % Seattle WA % % Portland OR % Spokane Intl WA % % Pendleton OR % % Santa Rosa CA % LA Airport CA % Redding CA % Sacramento CA % Fresno CA % Winnemucca NV % % Tonopah NV % % Phoenix AZ % Albuquerque NM % % Salt Lake City UT % % Grand Junction CO % % NOR = Normal, and DFN = Departure from Normal
10 Regional City and State MO. TEMPS ( F) MO. PRECIP. (ins.) MO. SNOWFALL (ins.) OBS NOR DFN OBS NOR DFN (%) OBS NOR DFN Great Falls MT % % Casper WY % % Denver CO % % Grand Forks ND % % Rapid City SD % % Omaha NE % % Kansas City MO % % Oklahoma City OK % Lubbock TX % Dallas Ft. Worth TX % San Antonio TX % Minneapolis MN % % Green Bay WI % % Detroit MI % % Regional City and State MO. TEMPS ( F) MO. PRECIP. (ins.) MO. SNOWFALL (ins.) OBS NOR DFN OBS NOR DFN (%) OBS NOR DFN Buffalo NY % % Burlington VT % % Boston MA % % Pittsburgh PA % % Philadelphia PA % % Baltimore MD % % Chicago O'Hare IL % % Indianapolis IN % % Louisville KY % % New Orleans LA % Raleigh Durham NC % Wilmington NC % Atlanta GA % Tallahassee FL % Orlando FL % NOR = Normal, and DFN = Departure from Normal
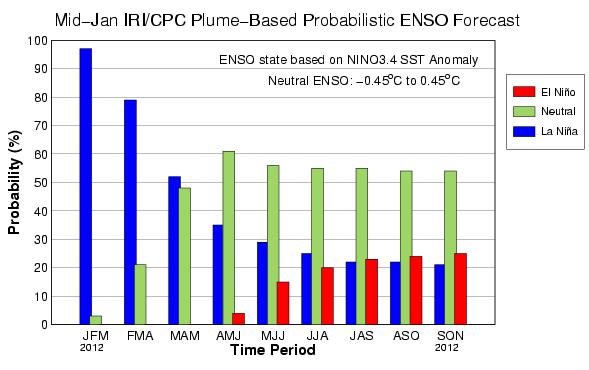
11 MO. TEMPS ( F) MO. PRECIP. (ins.) MO. SNOWFALL (ins.) DFN OBS NOR DFN OBS NOR (%) OBS NOR DFN Prince George BC % % Edmonton AB % % Saskatoon SK % % Winnipeg MB % % Kenora ON % % Timmins ON % % Muskoka ON % % Toronto ON % % Ottawa ON % % Barrow AK % % Nome AK % % Fairbanks AK % % Anchorage AK % % Juneau AK % % Regional City and State Regional City and State NOR = Normal, and DFN = Departure from Normal MO. TEMPS ( F) MO. PRECIP. (ins.) MO. SNOWFALL (ins.) OBS NOR DFN OBS NOR DFN (%) OBS NOR DFN Continental US % % So. Canada % % Alaska % % Equally Weighted Inputs of All Regional Cities Weak La Niña conditions emerged in early August 2011, and grew to weak/moderate strength during northern autumn As of mid January 2012, SST anomalies remain in weak to moderate La Niña territory in the central and eastern equatorial Pacific. For December the SST anomaly in the NINO3.4 region was 1.04 C, indicative of weak to moderate La Niña conditions, and for the October December season the anomaly was 1.02 C. The most recent weekly SST anomaly in the NINO3.4 region is 1.0 C, indicating weak to moderate La Niña conditions in the tropical Pacific; this is about the same as the 1.04 C level observed in December. The current La Niña SSTs have continued to be below average, and subsurface temperatures across the equatorial Pacific imply a strong likelihood of maintaining at weak to moderate La Niña conditions in the short term, with a good chance for continuing at approximately the current weak to moderate strength for another month or more before beginning to weaken in late February and March. As of mid January, most of the dynamical and statistical models predict La Niña conditions for the JAN MAR season, with weakening beginning toward the end of that period and continuing into the subsequent seasons in early 2012.
12 For the JAN MAR season, 92% of the models indicate La Niña conditions, and 8% indicate neutral conditions. For FEB APR, these figures become 77% and 23%, respectively. At lead times of 4 or more months into the future, statistical and dynamical models that incorporate information about the ocean's observed subsurface thermal structure generally exhibit higher predictive skill than those that do not. Among models that do use subsurface temperature information, 70% predict ENSO neutral SSTs for the MAY JUL 2012 season, 25% predict La Niña conditions, and 5% predict El Niño conditions. Caution is advised in interpreting the distribution of model predictions as the actual probabilities. At longer leads, the skill of the models degrades, and skill uncertainty must be convolved with the uncertainties from initial conditions and differing model physics, leading to more climatological probabilities in the long lead ENSO Outlook than might be suggested by the suite of models. Furthermore, the expected skill of one model versus another has not been established using uniform validation procedures, which may cause a difference in the true probability distribution from that taken verbatim from the raw model predictions. Predicted ENSO Values and all (multiple) NWS Model Variance
13

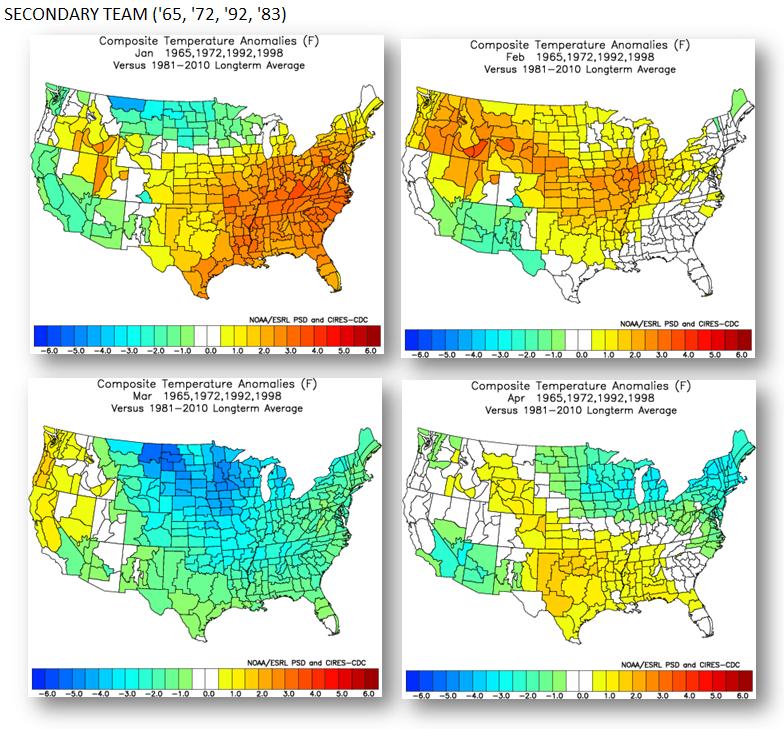
14 WeatherBank Forecast In late January, I reviewed all years for seeking matching analogs, and found three groups which I pooled, as follows:
15
 with equal")
16 Notice: PRIMARY Team '53, '58, '80, '83, '95, '02, '06; and SECONDARY TEAM '65, '72, '92, '98 then After comparing ALL YEARS with those JAN's best matching JAN 2012, these years: Had a GOOD MATCH: '53, '95, '98, 02, '06 These had a FAIR MATCH: '58, '65, '83, '92 And these had an OKAY/POOR MATCH: '72, '80; As a result, I installed the PRIMARY Team ('53, '80, '83, '95, '02, '06) with equal weights.

17 Thus our forecast for FEBRUARY and beyond for TEMPERATURE is:

18 Thus our forecast for FEBRUARY and beyond for PRECIPITATION is:


19 FEBRUARY 2012 Monthly Temperature Departures FEBRUARY 2012 Monthly Precipitation Departures MARCH 2012 Monthly Temperature Departures MARCH 2012 Monthly Precipitation Departures APRIL 2012 Monthly Temperature Departures APRIL 2012 Monthly Precipitation Departures
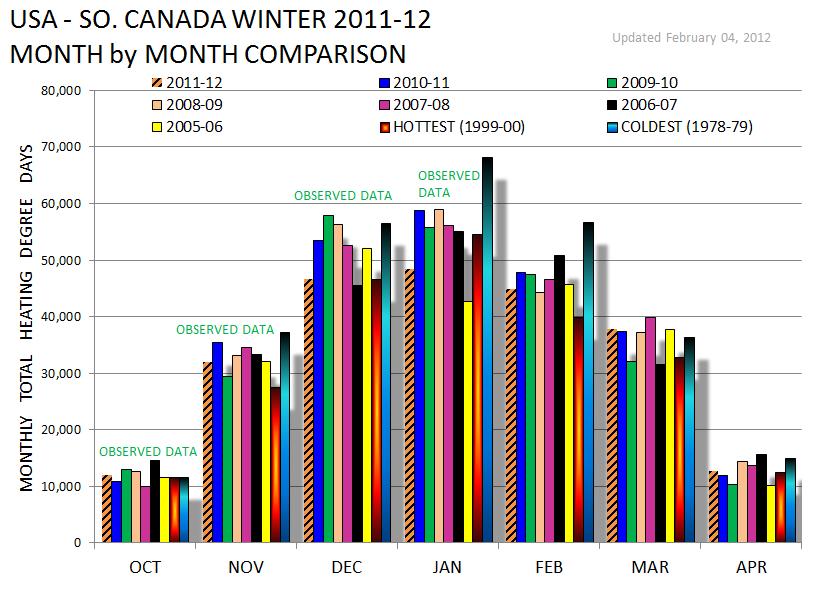
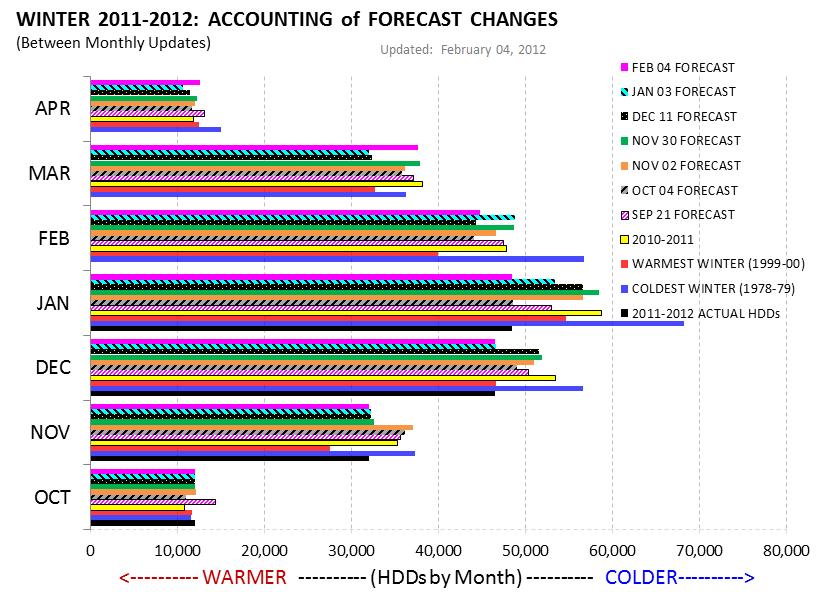
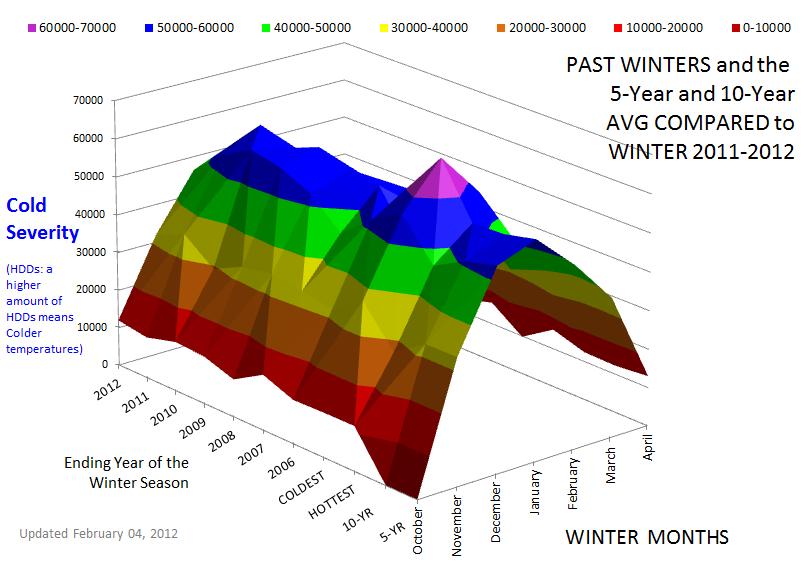
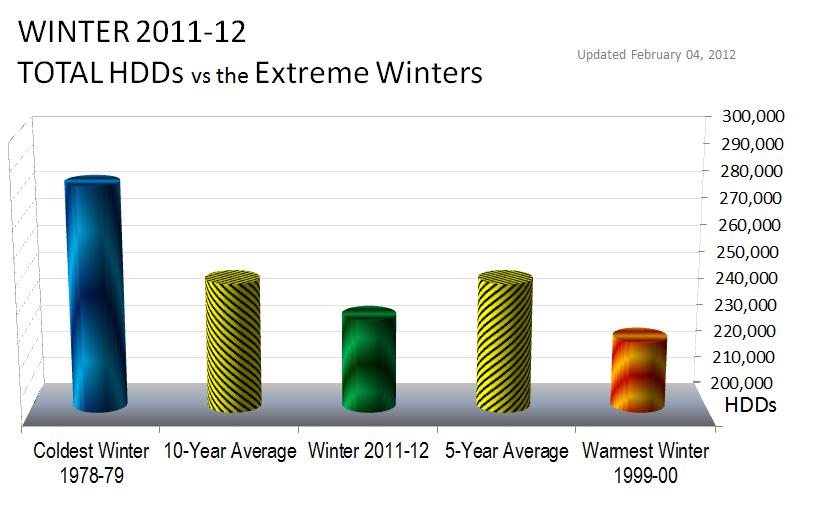
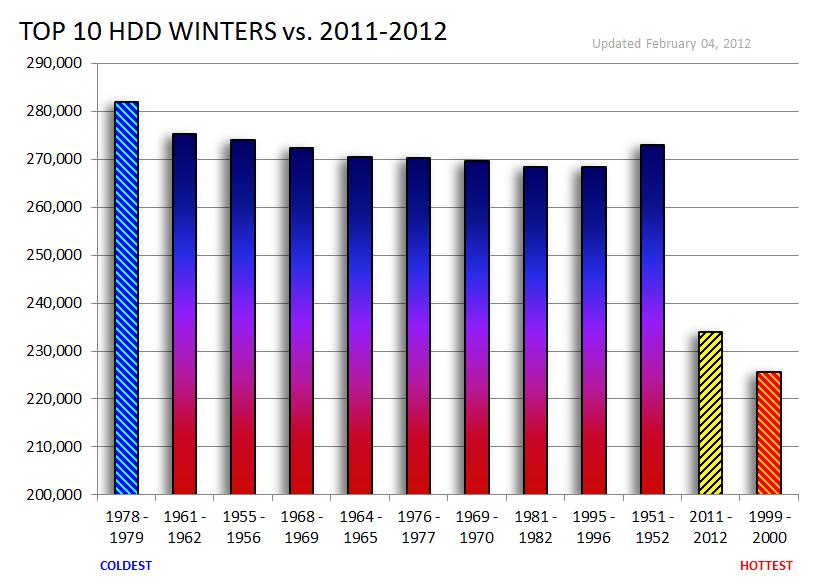
20 WeatherBank s Winter Forecast Forecast Monthly Numerical Ratings for WINTER (out of 62 past winters from ): Forecast Made Oct. 2, 2011: o Winter Full USA: 236,781 HDDs; 57 th Coldest; o Winter GCS: 67,767 HDDs; 56 th Coldest; (GCS = Gas Consuming States) Forecast Made Oct. 31, 2011: o Winter Full USA: 251,773 HDDs; 42 nd Coldest; o Winter GCS: 74,756 HDDs; 33 rd Coldest; (GCS = Gas Consuming States) Forecast Made Dec. 11, 2011: o Winter Full USA: 240,908 HDDs; 57 TH Coldest; o Winter GCS: 67,162 HDDs; 60 TH Coldest; (GCS = Gas Consuming States) Forecast Made Jan. 03, 2012: o Winter Full USA: 238,039 HDDs; 57 TH Coldest; o Winter GCS: 69,310 HDDs; 56 TH Coldest; (GCS = Gas Consuming States) Forecast Made Feb. 1, 2012: o Winter Full USA: 233,868 HDDs; 59 TH Coldest; o Winter GCS: 66,716 HDDs; 58 TH Coldest; (GCS = Gas Consuming States) Winter : 256,166 HDDs; Winter : 245,800 HDDs; Winter : 257,204 HDDs; Winter : 253,625 HDDs; Winter : 246,650 HDDs; 5-Year Winter Average: 251,889 HDDs 10-Year Winter Average: 247,137 HDDs WARMEST WINTER since : ,753 HDDs COLDEST WINTER since : ,056 HDDs
21
22
23
24
25 Background Methodology for the WeatherBank LROM Using observed calendar day MAX and MIN temperatures at major cities across North America, WeatherBank generates daily Heating Degree Days (HDDs) and Daily Cooling Degree Days (CDDs). By comparing observations of HDDs in winter and CDDs during summer, one may obtain a real time description of how warm or cold the current season is. Basically, the hotter a location is in summer, or colder in winter, the more degree days that location earns. By adding all degree days from all locations, one can obtain a relative description of the current season. By comparing the current season to the degree days totals for past seasons, one obtains a ranking of the current season. WeatherBank's Long Range Outlook Model (LROM) fundamentally assumes that future weather patterns will be similar to a highly correlating, past weather pattern that was determine by trend mapping. All similar weather trends of the past are compared to the current weather trend, then analyzed using a variety of tests. Global inputs such as MEI, average upper level flow patterns, etc., are also used. Correlation coefficients for each input years are generated, and used to define the relative strength of each year and how that trend could be used in the forecast process. Since mid August 2007, strong correlations have remained between the equally weighted (same calendar 13 week period called current, to the same 13 week period of all past years; no lag applied) time periods of the past.
Every state in the nation experienced a record warm daily temperature during March.
 Monthly Long Range Weather Commentary Issued: April 05, 2012 Steven A. Root, CCM, President/CEO sroot@weatherbank.com March 2012 Record and near record breaking temperatures dominated the eastern two thirds
Monthly Long Range Weather Commentary Issued: March 06, 2012 Steven A. Root, CCM, President/CEO
 Monthly Long Range Weather Commentary Issued: March 06, 2012 Steven A. Root, CCM, President/CEO sroot@weatherbank.com Warmer than average temperatures dominated the northern and eastern regions of the
Monthly Long Range Weather Commentary Issued: July 18, 2014 Steven A. Root, CCM, President/CEO
 Monthly Long Range Weather Commentary Issued: July 18, 2014 Steven A. Root, CCM, President/CEO sroot@weatherbank.com JUNE 2014 REVIEW Climate Highlights The Month in Review The average temperature for
SEPTEMBER 2013 REVIEW
 Monthly Long Range Weather Commentary Issued: October 21, 2013 Steven A. Root, CCM, President/CEO sroot@weatherbank.com SEPTEMBER 2013 REVIEW Climate Highlights The Month in Review The average temperature
Monthly Long Range Weather Commentary Issued: May 15, 2014 Steven A. Root, CCM, President/CEO
 Monthly Long Range Weather Commentary Issued: May 15, 2014 Steven A. Root, CCM, President/CEO sroot@weatherbank.com APRIL 2014 REVIEW Climate Highlights The Month in Review The average temperature for
Monthly Long Range Weather Commentary Issued: APRIL 1, 2015 Steven A. Root, CCM, President/CEO
 Monthly Long Range Weather Commentary Issued: APRIL 1, 2015 Steven A. Root, CCM, President/CEO sroot@weatherbank.com FEBRUARY 2015 Climate Highlights The Month in Review The February contiguous U.S. temperature
Monthly Long Range Weather Commentary Issued: APRIL 25, 2016 Steven A. Root, CCM, Chief Analytics Officer, Sr. VP, sales
 Monthly Long Range Weather Commentary Issued: APRIL 25, 2016 Steven A. Root, CCM, Chief Analytics Officer, Sr. VP, sales sroot@weatherbank.com MARCH 2016 Climate Highlights The Month in Review The March
Monthly Long Range Weather Commentary Issued: February 15, 2015 Steven A. Root, CCM, President/CEO
 Monthly Long Range Weather Commentary Issued: February 15, 2015 Steven A. Root, CCM, President/CEO sroot@weatherbank.com JANUARY 2015 Climate Highlights The Month in Review During January, the average
Monthly Long Range Weather Commentary Issued: SEPTEMBER 19, 2016 Steven A. Root, CCM, Chief Analytics Officer, Sr. VP,
 Monthly Long Range Weather Commentary Issued: SEPTEMBER 19, 2016 Steven A. Root, CCM, Chief Analytics Officer, Sr. VP, sroot@weatherbank.com SEPTEMBER 2016 Climate Highlights The Month in Review The contiguous
Monthly Long Range Weather Commentary Issued: APRIL 18, 2017 Steven A. Root, CCM, Chief Analytics Officer, Sr. VP,
 Monthly Long Range Weather Commentary Issued: APRIL 18, 2017 Steven A. Root, CCM, Chief Analytics Officer, Sr. VP, sroot@weatherbank.com MARCH 2017 Climate Highlights The Month in Review The average contiguous
Monthly Long Range Weather Commentary Issued: July 9, 2012 Steven A. Root, CCM, President/CEO JUNE 2012
 Monthly Long Range Weather Commentary Issued: July 9, 2012 Steven A. Root, CCM, President/CEO sroot@weatherbank.com JUNE 2012 June Background The average temperature for the contiguous United States during
Monthly Long Range Weather Commentary Issued: NOVEMBER 16, 2015 Steven A. Root, CCM, Chief Analytics Officer, Sr. VP, sales
 Monthly Long Range Weather Commentary Issued: NOVEMBER 16, 2015 Steven A. Root, CCM, Chief Analytics Officer, Sr. VP, sales sroot@weatherbank.com OCTOBER 2015 Climate Highlights The Month in Review The
Monthly Long Range Weather Commentary Issued: SEPTEMBER 19, 2015 Steven A. Root, CCM, Chief Analytics Officer, Sr. VP, sales
 Monthly Long Range Weather Commentary Issued: SEPTEMBER 19, 2015 Steven A. Root, CCM, Chief Analytics Officer, Sr. VP, sales sroot@weatherbank.com AUGUST 2015 Climate Highlights The Month in Review The
Climate Variability and El Niño
 Climate Variability and El Niño David F. Zierden Florida State Climatologist Center for Ocean Atmospheric Prediction Studies The Florida State University UF IFAS Extenstion IST January 17, 2017 The El
Weather and Climate Summary and Forecast Winter
 Weather and Climate Summary and Forecast Winter 2016-17 Gregory V. Jones Southern Oregon University February 7, 2017 What a difference from last year at this time. Temperatures in January and February
Weather and Climate Summary and Forecast March 2018 Report
 Weather and Climate Summary and Forecast March 2018 Report Gregory V. Jones Linfield College March 7, 2018 Summary: The ridge pattern that brought drier and warmer conditions from December through most
Weather and Climate Summary and Forecast February 2018 Report
 Weather and Climate Summary and Forecast February 2018 Report Gregory V. Jones Linfield College February 5, 2018 Summary: For the majority of the month of January the persistent ridge of high pressure
Champaign-Urbana 1999 Annual Weather Summary
 Champaign-Urbana 1999 Annual Weather Summary ILLINOIS STATE WATER SURVEY 2204 Griffith Dr. Champaign, IL 61820 wxobsrvr@sws.uiuc.edu Maria Peters, Weather Observer A major snowstorm kicked off the new
Weather and Climate Summary and Forecast January 2019 Report
 Weather and Climate Summary and Forecast January 2019 Report Gregory V. Jones Linfield College January 4, 2019 Summary: December was mild and dry over much of the west, while the east was much warmer than
Weather and Climate Summary and Forecast October 2018 Report
 Weather and Climate Summary and Forecast October 2018 Report Gregory V. Jones Linfield College October 4, 2018 Summary: Much of Washington, Oregon, coastal California and the Bay Area and delta region
Weather and Climate Summary and Forecast Fall/Winter 2016
 Weather and Climate Summary and Forecast Fall/Winter 2016 Gregory V. Jones Southern Oregon University November 5, 2016 After a year where we were seemingly off by a month in terms of temperatures (March
Midwest/Great Plains Climate-Drought Outlook September 20, 2018
 Midwest/Great Plains Climate-Drought Outlook September 20, 2018 Brian Fuchs National Drought Mitigation Center University of Nebraska-Lincoln School of Natural Resources September 20, 2018 General Information
Weather and Climate Summary and Forecast November 2017 Report
 Weather and Climate Summary and Forecast November 2017 Report Gregory V. Jones Linfield College November 7, 2017 Summary: October was relatively cool and wet north, while warm and very dry south. Dry conditions
Champaign-Urbana 1998 Annual Weather Summary
 Champaign-Urbana 1998 Annual Weather Summary ILLINOIS STATE WATER SURVEY Audrey Bryan, Weather Observer 2204 Griffith Dr. Champaign, IL 61820 wxobsrvr@sparc.sws.uiuc.edu The development of the El Nìno
Champaign-Urbana 2001 Annual Weather Summary
 Champaign-Urbana 2001 Annual Weather Summary ILLINOIS STATE WATER SURVEY 2204 Griffith Dr. Champaign, IL 61820 wxobsrvr@sws.uiuc.edu Maria Peters, Weather Observer January: After a cold and snowy December,
National Wildland Significant Fire Potential Outlook
 National Wildland Significant Fire Potential Outlook National Interagency Fire Center Predictive Services Issued: September, 2007 Wildland Fire Outlook September through December 2007 Significant fire
Weather and Climate Summary and Forecast Winter
 Weather and Climate Summary and Forecast Winter 2016-17 Gregory V. Jones Southern Oregon University December 5, 2016 Well after an October that felt more like November, we just finished a November that
ALASKA REGION CLIMATE FORECAST BRIEFING. December 15, 2014 Rick Thoman NWS Alaska Region ESSD Climate Services
 ALASKA REGION CLIMATE FORECAST BRIEFING December 15, 2014 Rick Thoman NWS Alaska Region ESSD Climate Services Today Climate Forecast Basics Review of recent climate forecasts and conditions CPC Forecasts
Weather and Climate Summary and Forecast August 2018 Report
 Weather and Climate Summary and Forecast August 2018 Report Gregory V. Jones Linfield College August 5, 2018 Summary: July 2018 will likely go down as one of the top five warmest July s on record for many
U.S. Outlook For October and Winter Thursday, September 19, 2013
 About This report coincides with today s release of the monthly temperature and precipitation outlooks for the U.S. from the Climate Prediction Center (CPC). U.S. CPC October and Winter Outlook The CPC
Weather and Climate Summary and Forecast April 2018 Report
 Weather and Climate Summary and Forecast April 2018 Report Gregory V. Jones Linfield College April 4, 2018 Summary: A near Miracle March played out bringing cooler and wetter conditions to the majority
Weather and Climate Summary and Forecast January 2018 Report
 Weather and Climate Summary and Forecast January 2018 Report Gregory V. Jones Linfield College January 5, 2018 Summary: A persistent ridge of high pressure over the west in December produced strong inversions
Weather and Climate Summary and Forecast December 2017 Report
 Weather and Climate Summary and Forecast December 2017 Report Gregory V. Jones Linfield College December 5, 2017 Summary: November was relatively cool and wet from central California throughout most of
Weather and Climate Summary and Forecast Summer into Harvest 2016
 Weather and Climate Summary and Forecast Summer into Harvest 2016 Gregory V. Jones Southern Oregon University September 3, 2016 With school and football season starting a hint of fall is right on time
Weather and Climate Summary and Forecast Summer 2017
 Weather and Climate Summary and Forecast Summer 2017 Gregory V. Jones Southern Oregon University August 4, 2017 July largely held true to forecast, although it ended with the start of one of the most extreme
MDA WEATHER SERVICES AG WEATHER OUTLOOK. Kyle Tapley-Senior Agricultural Meteorologist May 22, 2014 Chicago, IL
 MDA WEATHER SERVICES AG WEATHER OUTLOOK Kyle Tapley-Senior Agricultural Meteorologist May 22, 2014 Chicago, IL GLOBAL GRAIN NORTH AMERICA 2014 Agenda Spring Recap North America Forecast El Niño Discussion
Weather and Climate Summary and Forecast Summer 2016
 Weather and Climate Summary and Forecast Summer 2016 Gregory V. Jones Southern Oregon University August 5, 2016 The month of July saw the continued flip, flop of the western US temperatures. It was warm
Weather and Climate Summary and Forecast Summer 2016
 Weather and Climate Summary and Forecast Summer 2016 Gregory V. Jones Southern Oregon University June 6, 2016 May 2016 continued the warm trend for portions of the west, while providing some relief for
Weather and Climate Summary and Forecast March 2019 Report
 Weather and Climate Summary and Forecast March 2019 Report Gregory V. Jones Linfield College March 2, 2019 Summary: Dramatic flip from a mild winter to a top five coldest February on record in many locations
2011 Year in Review TORNADOES
 2011 Year in Review The year 2011 had weather events that will be remembered for a long time. Two significant tornado outbreaks in April, widespread damage and power outages from Hurricane Irene in August
What Is the Weather Like in Different Regions of the United States?
 Learning Set 1 What Is Weather, and How Is It Measured and Described? 1.3 Explore What Is the Weather Like in Different Regions of the United States? trends: patterns or tendencies you can see over a broad
Summer 2018 Southern Company Temperature/Precipitation Forecast
 Scott A. Yuknis High impact weather forecasts, climate assessment and prediction. 14 Boatwright s Loop Plymouth, MA 02360 Phone/Fax 508.927.4610 Cell: 508.813.3499 ClimateImpact@comcast.net Climate Impact
Impacts of the April 2013 Mean trough over central North America
 Impacts of the April 2013 Mean trough over central North America By Richard H. Grumm National Weather Service State College, PA Abstract: The mean 500 hpa flow over North America featured a trough over
Summary of Natural Hazard Statistics for 2008 in the United States
 Summary of Natural Hazard Statistics for 2008 in the United States This National Weather Service (NWS) report summarizes fatalities, injuries and damages caused by severe weather in 2008. The NWS Office
Seasonal Climate Watch February to June 2018
 Seasonal Climate Watch February to June 2018 Date issued: Jan 26, 2018 1. Overview The El Niño-Southern Oscillation (ENSO) is expected to remain in a weak La Niña phase through to early autumn (Feb-Mar-Apr).
Alaska Statewide Climate Summary June 2018
 Alaska Statewide Climate Summary June 2018 The following report provides an overview of temperature and precipitation for June 2018. The report is based on preliminary data from selected weather stations
Climate Outlook through 2100 South Florida Ecological Services Office Vero Beach, FL September 9, 2014
 Climate Outlook through 2100 South Florida Ecological Services Office Vero Beach, FL September 9, 2014 Short Term Drought Map: Short-term (
Weather and Climate Summary and Forecast October 2017 Report
 Weather and Climate Summary and Forecast October 2017 Report Gregory V. Jones Linfield College October 4, 2017 Summary: Typical variability in September temperatures with the onset of fall conditions evident
The Pennsylvania Observer
 The Pennsylvania Observer April 2, 2010 March 2010 Pennsylvania Weather Recap Prepared by: Katelyn Johnson March did come in as a lion cub this year. The 1 st proved to be a calm day; however most of Pennsylvania
Winter Forecast. Allan Huffman RaleighWx
 Winter 2015-16 Forecast Allan Huffman RaleighWx Disclaimer Seasonal forecasting is difficult and you are always learning. I attempt to look at all factors I understand and have seen correlate in the past
Climate Outlook through 2100 South Florida Ecological Services Office Vero Beach, FL January 13, 2015
 Climate Outlook through 2100 South Florida Ecological Services Office Vero Beach, FL January 13, 2015 Short Term Drought Map: Short-term (
Colorado CoCoRaHS. Colorado CoCoRaHS. Because Every Drop Counts! November 2014 Volume 2, Issue 11
 U.S. PRECIPITATION (% OF AVERAGE) LOOKING BACK AT OCTOBER 2014 October was a fairly dry month for much of the nation with the exception of the Pacific Northwest, portions of New England and the Tennessee
Seasonal Climate Outlook for South Asia (June to September) Issued in May 2014
 Issued in May 2014") Ministry of Earth Sciences Earth System Science Organization India Meteorological Department WMO Regional Climate Centre (Demonstration Phase) Pune, India Seasonal Climate Outlook for South Asia (June
Ministry of Earth Sciences Earth System Science Organization India Meteorological Department WMO Regional Climate Centre (Demonstration Phase) Pune, India Seasonal Climate Outlook for South Asia (June
Pacific Decadal Oscillation ( PDO ):
:") Time again for my annual Winter Weather Outlook. Here's just a small part of the items I considered this year and how I think they will play out with our winter of 2015-2016. El Nino / La Nina: When looking
Time again for my annual Winter Weather Outlook. Here's just a small part of the items I considered this year and how I think they will play out with our winter of 2015-2016. El Nino / La Nina: When looking
State of the Climate National Overview January 2012
 1 of 14 1/5/2013 6:39 AM DOC > NOAA > NESDIS > NCDC Search Field: Climate Monitoring State of the Climate National Overview Help State of the Climate National Overview January 2012 National Oceanic and
Great Plains and Midwest Climate Outlook February 18, 2016
 Great Plains and Midwest Climate Outlook February 18, 2016 Dr. Jim Angel State Climatologist Illinois State Water Survey University of Illinois jimangel@illinois.edu General Information Providing climate
2012 Growing Season Weather Summary for North Dakota. Adnan Akyüz and Barbara A. Mullins Department of Soil Science October 30, 2012
 2012 Growing Season Weather Summary for North Dakota Adnan Akyüz and Barbara A. Mullins Department of Soil Science October 30, 2012 Introduction The 2012 growing season (the period from April through September)
Midwest and Great Plains Climate and Drought Update
 Midwest and Great Plains Climate and Drought Update June 20,2013 Laura Edwards Climate Field Specialist Laura.edwards@sdstate.edu 605-626-2870 2012 Board of Regents, South Dakota State University General
The Weather Wire. Contents: Summer 2018 Outlook. Summer 2018 Outlook Drought Monitor May Summary/Statistics June Preview Rainfall Totals
 The Weather Wire June 2018 Volume 25 Number 6 Contents: Summer 2018 Outlook Drought Monitor May Summary/Statistics June Preview Rainfall Totals Summer 2018 Outlook June 1 st marked the first day of meteorological
Weather Outlook: 2015 Growing Season
 Weather Outlook: 2015 Growing Season Leon F. Osborne Chester Fritz Distinguished Professor Regional Weather Information Center University of North Dakota Grand Forks, North Dakota Why Should We Be Concerned?
An ENSO-Neutral Winter
 An ENSO-Neutral Winter This issue of the Blue Water Outlook newsletter is devoted towards my thoughts on the long range outlook for winter. You will see that I take a comprehensive approach to this outlook
Alaska Statewide Climate Summary February 2019
 Alaska Statewide Climate Summary February 2019 The following report provides an overview of the February 2019 weather. The report is based on preliminary data from selected weather stations throughout
The Climate of Payne County
 The Climate of Payne County Payne County is part of the Central Great Plains in the west, encompassing some of the best agricultural land in Oklahoma. Payne County is also part of the Crosstimbers in the
2015 Summer Forecast
 2015 Summer Forecast Inside This Forecast Summer 2014 Recap 2 Implications of El Niño and the PDO on the Upcoming Summer Summary of Global Indices & Oscillations Analog Year: The Midwest a battleground
Upper Missouri River Basin February 2018 Calendar Year Runoff Forecast February 6, 2018
 Upper Missouri River Basin February 2018 Calendar Year Runoff Forecast February 6, 2018 Calendar Year Runoff Forecast Explanation and Purpose of Forecast U.S. Army Corps of Engineers, Northwestern Division
Sierra Weather and Climate Update
 Sierra Weather and Climate Update 2014-15 Kelly Redmond Western Regional Climate Center Desert Research Institute Reno Nevada Yosemite Hydroclimate Workshop Yosemite Valley, 2015 October 8-9 Percent of
KANSAS CLIMATE SUMMARY February 2015
 KANSAS CLIMATE SUMMARY February 2015 Extended Cold Despite some record warm readings at a few locations, February was characterized by colder than normal conditions. This was particularly true during the
The Climate of Grady County
 The Climate of Grady County Grady County is part of the Central Great Plains, encompassing some of the best agricultural land in Oklahoma. Average annual precipitation ranges from about 33 inches in northern
The Pennsylvania Observer
 The Pennsylvania Observer January 5, 2016 December 2015 - Pennsylvania Weather Recap By: Arthur Person December is the first of the three coldest months of the year. Sometimes it can be naughty, and sometimes
Extreme Rainfall in the Southeast U.S.
 Extreme Rainfall in the Southeast U.S. David F. Zierden Florida State Climatologist Center for Ocean Atmospheric Prediction Studies The Florida State University March 7, 2016 Causes of Extreme Rainfall
Winter Forecast. Allan Huffman RaleighWx
 Winter 2014-15 Forecast Allan Huffman RaleighWx Winter 2014-15 Combination of weak/moderate El Nino/+PDO/-QBO and well above average snow cover and snow cover increase this Fall in Siberia point to a winter
Presentation Overview. Southwestern Climate: Past, present and future. Global Energy Balance. What is climate?
 Southwestern Climate: Past, present and future Mike Crimmins Climate Science Extension Specialist Dept. of Soil, Water, & Env. Science & Arizona Cooperative Extension The University of Arizona Presentation
Champaign-Urbana 2000 Annual Weather Summary
 Champaign-Urbana 2000 Annual Weather Summary ILLINOIS STATE WATER SURVEY 2204 Griffith Dr. Champaign, IL 61820 wxobsrvr@sws.uiuc.edu Maria Peters, Weather Observer January: January started on a mild note,
UNITED STATES AND SOUTH AMERICA OUTLOOK (FULL REPORT) Wednesday, April 18, 2018
 Wednesday, April 18, 2018") T-storm Weather Summary Coolness continues over the next week in much of the central U.S., most likely producing the coldest April since 1907 in the Corn Belt, but followed by seasonable to mild weather
T-storm Weather Summary Coolness continues over the next week in much of the central U.S., most likely producing the coldest April since 1907 in the Corn Belt, but followed by seasonable to mild weather
Here s what a weak El Nino usually brings to the nation with temperatures:
 Time again for my annual Winter Weather Outlook. Here's just a small part of the items I considered this year and how I think they will play out with our winter of 2018-2019. El Nino / La Nina: When looking
Table 1. August average temperatures and departures from normal ( F) for selected cities.
 for selected cities.") Climate Summary for Florida August 2016 Prepared by Lydia Stefanova and David Zierden Florida Climate Center, The Florida State University, Tallahassee, Florida Online at: http://climatecenter.fsu.edu/products-services/summaries
Climate Summary for Florida August 2016 Prepared by Lydia Stefanova and David Zierden Florida Climate Center, The Florida State University, Tallahassee, Florida Online at: http://climatecenter.fsu.edu/products-services/summaries
The Climate of Texas County
 The Climate of Texas County Texas County is part of the Western High Plains in the north and west and the Southwestern Tablelands in the east. The Western High Plains are characterized by abundant cropland
Upper Missouri River Basin December 2017 Calendar Year Runoff Forecast December 5, 2017
 Upper Missouri River Basin December 2017 Calendar Year Runoff Forecast December 5, 2017 Calendar Year Runoff Forecast Explanation and Purpose of Forecast U.S. Army Corps of Engineers, Northwestern Division
KANSAS CLIMATE SUMMARY April 2017
 KANSAS CLIMATE SUMMARY April 2017 Epic Blizzard While much of the month was warmer than normal, the last week brought a return to cold, wintery weather in the western third of the state, and cold rainy
The Climate of Marshall County
 The Climate of Marshall County Marshall County is part of the Crosstimbers. This region is a transition region from the Central Great Plains to the more irregular terrain of southeastern Oklahoma. Average
Fire Weather Drivers, Seasonal Outlook and Climate Change. Steven McGibbony, Severe Weather Manager Victoria Region Friday 9 October 2015
 Fire Weather Drivers, Seasonal Outlook and Climate Change Steven McGibbony, Severe Weather Manager Victoria Region Friday 9 October 2015 Outline Weather and Fire Risk Environmental conditions leading to
INVISIBLE WATER COSTS
 Every Drop Every Counts... Drop Counts... INVISIBLE WATER COSTS Corn - 108.1 gallons per pound How much water it takes to produce... Apple - 18.5 gallons to grow Beef - 1,581 gallons per pound Oats - 122.7
Alaska Statewide Climate Summary December 2018
 Alaska Statewide Climate Summary December 2018 The following report provides an overview of the December 2018 weather. The report is based on preliminary data from selected weather stations throughout
Will it be a Good Ski Season? Correlation between El Niño and U.S. Weather
 Will it be a Good Ski Season? Correlation between El Niño and U.S. Weather Lillian Petersen 1 Abstract This study investigates the correlation between El Niño and the weather across the U.S. El Niño is
Climate Prediction Center National Centers for Environmental Prediction
 NOAA s Climate Prediction Center Monthly and Seasonal Forecast Operations Wassila M. Thiaw Climate Prediction Center National Centers for Environmental Prediction Acknowlegement: Mathew Rosencrans, Arun
The Pennsylvania Observer
 The Pennsylvania Observer October 1, 2015 September 2015 - Pennsylvania Weather Recap By: Quinn Lease The month of September will be remembered for its above normal temperatures and dry conditions that
ALASKA REGION CLIMATE OUTLOOK BRIEFING. November 16, 2018 Rick Thoman Alaska Center for Climate Assessment and Policy
 ALASKA REGION CLIMATE OUTLOOK BRIEFING November 16, 2018 Rick Thoman Alaska Center for Climate Assessment and Policy Today s Outline Feature of the month: Southeast Drought Update Climate Forecast Basics
North Central U.S. Climate Summary & Outlook May 19, 2016
 North Central U.S. Climate Summary & Outlook May 19, 2016 Golf course Lincoln, NE Image courtesy Terry Sohl Hailstones Lincoln, NE Image courtesy Andrew Ozaki EF1 tornado Lincoln, NE May 9 Photo by Bill
Great Plains & Midwest Climate Outlook June 18, 2015
 Great Plains & Midwest Climate Outlook June 18, 2015 Pat Guinan Extension/State Climatologist University of Missouri guinanp@missouri.edu 573-882-5908 Saturated Soybeans, Monroe County, MO Yellow Corn,
The Climate of Bryan County
 The Climate of Bryan County Bryan County is part of the Crosstimbers throughout most of the county. The extreme eastern portions of Bryan County are part of the Cypress Swamp and Forest. Average annual
Seasonal Climate Watch January to May 2016
 Seasonal Climate Watch January to May 2016 Date: Dec 17, 2015 1. Advisory Most models are showing the continuation of a strong El-Niño episode towards the latesummer season with the expectation to start
January 2011 Calendar Year Runoff Forecast
 January 2011 Calendar Year Runoff Forecast 2010 Runoff Year Calendar Year 2010 was the third highest year of runoff in the Missouri River Basin above Sioux City with 38.8 MAF, behind 1978 and 1997 which
El Niño Update Impacts on Florida
 Current Issues in Emergency Management (CIEM) Sessions 1 &2 October 12 th and 26 th, 2006 Florida Division of Emergency Management Tallahassee, Florida El Niño Update Impacts on Florida Bart Hagemeyer
North Carolina Climate January 2012
 North Carolina Climate January 2012 Online: http://www.nc-climate.ncsu.edu/office/newsletters North Carolina Climate, the monthly newsletter of the State Climate Office of NC, covers information on experimental
Becky Bolinger Water Availability Task Force November 13, 2018
 Colorado Climate Center WATF Climate Update Becky Bolinger Water Availability Task Force November 13, 2018 COLORADO CLIMATE CENTER Water Year 2018 Colorado s Climate in Review COLORADO CLIMATE CENTER
SOUTHERN CLIMATE MONITOR
 SOUTHERN CLIMATE MONITOR MARCH 2011 VOLUME 1, ISSUE 3 IN THIS ISSUE: Page 2 to 4 Severe Thunderstorm Climatology in the SCIPP Region Page 4 Drought Update Page 5 Southern U.S. Precipitation Summary for
The Climate of Haskell County
 The Climate of Haskell County Haskell County is part of the Hardwood Forest. The Hardwood Forest is characterized by its irregular landscape and the largest lake in Oklahoma, Lake Eufaula. Average annual
Minnesota s Climatic Conditions, Outlook, and Impacts on Agriculture. Today. 1. The weather and climate of 2017 to date
 Minnesota s Climatic Conditions, Outlook, and Impacts on Agriculture Kenny Blumenfeld, State Climatology Office Crop Insurance Conference, Sep 13, 2017 Today 1. The weather and climate of 2017 to date
ACCUMULATED PRECIPITATION IN INCHES
 4 3 CUMULATIVE PRECIPITATION WATER YEAR 7 COLUMBIA BASIN ABOVE GRAND COULEE 18% of Normal 1971- Average ACCUMULATED PRECIPITATION IN INCHES 1 3 1 4 3 1 8 6 4 94% of Normal 17% of Normal 118% of Normal
NatGasWeather.com Daily Report
 NatGasWeather.com Daily Report Issue Time: 5:15 pm EST Sunday, February 28 th, 2016 for Monday, Feb 29 th 7-Day Weather Summary (February 28 th March 5 th ): High pressure will dominate much of the US