Mapping tidal wetlands and their losses on the U.S. West Coast: new methods, new insights
|
|
|
- Eunice Owens
- 5 years ago
- Views:
Transcription


1 Mapping tidal wetlands and their losses on the U.S. West Coast: new methods, new insights Assoc. of State Wetland Managers Members Webinar January 31, 2018 Presented by: Laura Brophy Director, Estuary Technical Group Institute for Applied Ecology and Marine Resource Management Program, College of Earth, Ocean and Atmospheric Sciences Oregon State University Corvallis, Oregon, USA
2 Mapping tidal wetlands and their losses on the U.S. West Coast: new methods, new insights Co-authors: Correigh Greene and Hiroo Imaki, NOAA Fisheries, Seattle, WA Van Hare and Brett Holycross, Pacific States Marine Fisheries Commission, Portland, OR Andy Lanier, Tanya Haddad, and Randy Dana, Oregon Coastal Management Program, Dept. of Land Conservation and Development, Salem, OR Walter Heady, The Nature Conservancy Kevin O'Connor, Moss Landing Marine Labs

3 Who is IAE / ETG? IAE: Small independent non-profit Corvallis, Oregon Mission: conserve native species and habitats through restoration, research and education. The Estuary Technical Group within IAE provides: Scientific decision support for estuary management Resources for strategic planning and prioritization, including climate change adaptation On-the-ground wetland monitoring and research
4 Take-home messages 1. For planning estuary conservation and restoration, we needed new maps of estuary extent -- and have now built them for the West Coast. 2. Elevation-based maps are the way to go: high-accuracy, and best for planning purposes. 3. Using the new extent maps, we mapped tidal wetland losses. They are high in general (85% for the West Coast) but vary considerably by estuary. 4. All of these new maps are available online: (West Coast maps) (most West Coast maps) (Oregon maps)
5 What are tidal wetlands? Wetlands with hydrology influenced by the tides


6 Tidal wetland types: Unvegetated: e.g. mudflats, sand flats Photo courtesy of NOAA's National Ocean Service


7 Vegetated tidal wetlands: 1. Low intertidal (seagrasses, algae beds) 2. Upper intertidal (tidal marsh, tidal swamp) Photo courtesy of the Partnership for Coastal Watersheds

8 Landscape array of tidal wetland classes Illustration courtesy of J. Good, OSU Extension Service
9 Why do we care about tidal wetlands?
10 Ecological functions of tidal wetlands Wildlife habitat Water quality Flood/storm protection Climate change mitigation (carbon sequestration)


11 Mammals Other fish & shellfish Salmon Rearing Shelter Osmotic transition Wildlife habitat Birds Amphibians

12 Climate change mitigation and carbon sequestration Wetland soils store lots of carbon (organic matter) Plants trap incoming sediment and store carbon in their roots and tops Stored carbon is kept out in soil and of the atmosphere, reducing global warming PNW Blue Carbon Working Group

13 What is the context for our mapping project? The team was convened by PMEP PMEP works to protect, enhance, and restore ecological processes and habitats within estuaries and nearshore marine environments, to sustain healthy native fish communities and the people that depend on them. Website:
14 What is the context for our mapping project? Goal of this mapping project: Develop a spatial framework to support West Coast fish habitat assessments More info: assessment-reports/
15 Why are we mapping West Coast estuaries? Provide improved spatial data on estuary habitats to support fish assessments, including: Evaluation of condition/impacts Identification and prioritization of restoration and conservation opportunities
16 What s our general approach? Map full spatial extent of estuaries Including all tidal wetlands to head of tide Including freshwater tidal zone Definition of tidal wetland = inundation due to tidal forces at least once a year
17 What s our general approach? Map current and historical tidal wetlands: Historical wetland mapping informs restoration planning Historical = just before European settlement
 maps? Existing maps (e.g. NWI, C-CAP) have very different purposes; for our purposes, they have major data gaps and/or inaccuracies Field studies demonstrate the need for new")
18 Why not use existing (digital) maps? Existing maps (e.g. NWI, C-CAP) have very different purposes; for our purposes, they have major data gaps and/or inaccuracies Field studies demonstrate the need for new data Up to half of current/former tidal wetlands missing Problem is greatest in mid/upper estuaries Critical mass of new field and remote data to support improved mapping
19 Methods for improved mapping How can we efficiently model the full extent of the estuary (ocean to head of tide)? Downslope (seaward) boundary: Water depth (bathymetry) -- for estuary extent Downslope edge of vegetation, visible in aerial photos -- for emergent, shrub, forested wetlands Upslope (landward) boundary: Challenging! Starting point: accepted definition (inundation due to tidal forces at least once a year)
20 Mapping the upslope boundary Determine water level elevation that defines upper boundary (annual inundation) Map the areas below this elevation on the landscape
21 Upslope limit of tidal wetlands? In our area, NOAA publishes no datums between MHHW and Highest Measured Tide Annual inundation falls between MHHW & HMT Ultimately, a modeling exercise Hydrodynamic models? Not for the whole West Coast
22 Updating Oregon's estuarine wetland habitat maps: Modernizing the foundation for coastal resource management Products released Oct. 2014: Andy Lanier 1, Laura Brophy 2, Tanya Haddad 1, Laura Mattison 1 1 Oregon Coastal Management Program, Department of Land Conservation and Development, Salem, OR 2 Estuary Technical Group, Institute for Applied Ecology, Corvallis, OR

23 The solution: NOAA extreme water level analysis Meters above MHHW Annual exceedance probability
24 Two possible choices: Meters above or below Mean Sea Level 50% exceedance = 3.12 m (10.2 ft) NAVD88 99% exceedance = 2.83 m (9.3 ft) NAVD88
25 Choosing a probability level to map tidal wetlands: Compare to field data across entire outer coast of Oregon

26 Compare to field data across entire Oregon coast Example: Coquille River estuary, S OR Coast Coquille River estuary

27 Compare to field data across entire Oregon coast Example: Coquille River estuary, South OR Coast Ni-les tun Tidal Marsh Restoration Site Bandon Marsh Reference site Green dots = groundwater wells

28 Compare to field data across entire Oregon coast Example: Coquille River estuary, South OR Coast Which exceedance contour best matches the known tidal wetland boundary, based on field data? BM T3 GW (high marsh) BM T5 GW (forested tidal)
29 Compare to field data across entire Oregon coast Example: Coquille River estuary, South OR Coast Marked sample points are local tide Which exceedance gauges; all contour showed best tidal influence. matches the known tidal wetland boundary, based on field data? 99% exc. = 8.6 ft 50% exc. = 9.6 ft BM T3 GW (high marsh) BM T5 GW (forested tidal)

30 Compare to field data across entire Oregon coast Example: Coquille River estuary, South OR Coast 99% exc. = 8.6 ft
31 Compare to field data across entire Oregon coast Example: Coquille River estuary, South OR Coast 50% exc. = 9.6 ft

32 Compare to field data across entire Oregon coast Example: Coquille River estuary, South OR Coast 50% exc. = 9.6 ft: BEST CHOICE because it includes all the tidal sample points. 99% exceedance would exclude two.
33 PMEP West Coast Current and Historical Estuary Extent - OR Similar ground-truthing was conducted across the entire Oregon coast using a variety of field data; the 50% exceedance contour was confirmed as an appropriate boundary for the extent of tidal influence.

34 50% exceedance elevations were interpolated between 4 NOAA tide stations on the OR coast
35 then for the whole West Coast (21 NOAA stations)
36 then for the whole West Coast (21 NOAA stations) Note: 50% exceedance elevations for the Columbia River Estuary differ from outer coast NOAA stations; mapping used water level models from the U.S. Army Corps of Engineers.
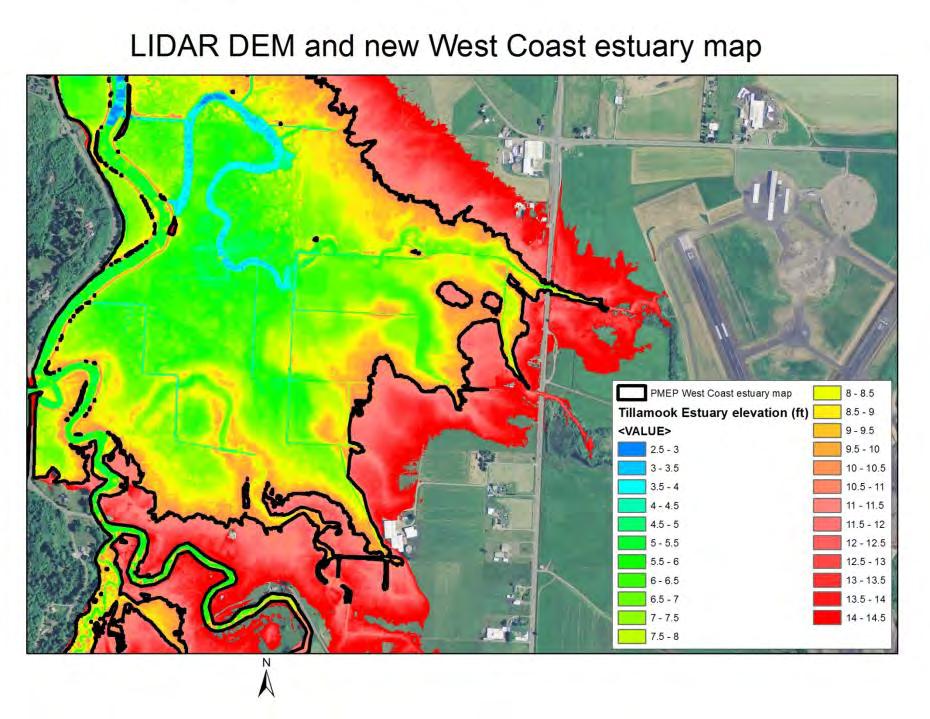
37 Mapping the upslope boundary Now we have a water level elevation that defines the upslope estuary boundary Need to find the location of the estuary boundary in the landscape to generate maps. How? Using VDatum, intersect the 50% exceedance surface with LIDAR Digital Elevation Model
38 Tillamook Bay Estuary, Oregon

39 Tillamook Bay Estuary, Oregon
40
41 The result: PMEP West Coast Current and Historical Estuary Extent

42 The result: PMEP West Coast Current and Historical Estuary Extent
43 PMEP West Coast Current and Historical Estuary Extent - WA
44 PMEP West Coast Current and Historical Estuary Extent - OR
45 PMEP West Coast Current and Historical Estuary Extent - CA

46 PMEP West Coast Current and Historical Estuary Extent - OR Coquille River Estuary

47 National Wetland Inventory tidal wetlands, Coquille River Estuary, OR The new maps greatly enhance our vision of West Coast estuaries, past and current

48 PMEP Current and Historical Estuary Extent, Coquille River Estuary, OR The new maps greatly enhance our vision of West Coast estuaries, past and current
49 PMEP West Coast Current and Historical Estuary Extent - CA San Francisco Bay Estuary and SF Bay Delta (Sacramento San Joaquin Delta)

50 San Francisco Bay Estuary and the Bay Delta
51 National Wetland Inventory tidal wetlands, North San Francisco Bay and Bay Delta, CA
52 PMEP Current and Historical Estuary Extent, North San Francisco Bay and Bay Delta, CA
53 Data validation and review Initial ground-truthing relative to Oregon CMECS data (mapping completed in 2014) Two expert review webinars, plus expert input to web map Comparison to historical wetland mapping: San Francisco Estuary Institute (SFEI) historical ecology studies Puget Sound Nearshore Ecosystem Restoration Project (PSNERP) historical wetlands
54 Results of review Very close match between data sources CA: matches historical ecology data from SFEI WA: matches historic wetlands layer from PSNERP OR: matches results of independent OCMP effort

55 PMEP West Coast Current and Historical Estuary Extent - CA San Francisco Bay Estuary and SF Bay Delta (Sacramento San Joaquin Delta)
56 PMEP Current and Historical Estuary Extent, North San Francisco Bay and Bay Delta, CA Suisun/Grizzly Bay

57 Suisun/Grizzly Bay and Suisun Marsh Pink: Historical tidal wetlands from Sacramento-San Joaquin Delta Historical Ecology Study (SFEI 2014)
 vs.")
58 Suisun/Grizzly Bay and Suisun Marsh New PMEP West Coast Current and Historical Estuary Extent (blue) vs. SFEI historical tidal wetlands (pink): match within m

59 PMEP West Coast Current and Historical Estuary Extent Snohomish River Estuary

60 Snohomish River Estuary, WA Pink: Historical wetlands from Puget Sound Nearshore Ecosystem Restoration Project (PSNERP)
 vs.")
61 Snohomish River Estuary, WA New PMEP West Coast Current and Historical Estuary Extent (blue) vs. PSNERP historical wetlands (pink): match within m in tidal areas

62 Results of review For Oregon, the same methods were used by both efforts (PMEP and OCMP). We compared the PMEP data to the OCMP data to ensure methods worked correctly. PMEP s final map products use the Oregon spatial data, since these have been extensively reviewed.
63 Conclusions The new maps of West Coast Current and Historical Estuary Extent: Greatly improve and expand our understanding of West Coast estuaries and the habitat they provide Provide consistent, comprehensive coverage Have been positively reviewed by experts Closely match historical wetland maps Provide a solid base layer for West-coast-scale analysis of wetland classification, losses, restoration and conservation opportunities
64 Take-home messages 1. For planning estuary conservation and restoration, we needed new maps of estuary extent -- and have now built them for the West Coast. 2. Elevation-based maps are the way to go: high-accuracy, and best for planning purposes. 3. Using the new extent maps, we mapped tidal wetland losses. They are high in general (85% for the West Coast) but vary considerably by estuary. 4. All of these new maps are available online: (West Coast maps) (most West Coast maps) (Oregon maps)
65 Next analysis steps Major steps: 1. Classification of habitats (CMECS) 2. Tidal wetland loss assessment 3. Web map interface development 4. Data integration to assist PMEP fish habitat assessments
66 Next analysis steps Major steps: 1. Classification of habitats (CMECS) 2. Mapping of disconnected areas ( lost ) 3. Web map interface development 4. Data integration to assist PMEP fish habitat assessments
67 Habitat classification: Why? Resource managers need to know where different kinds of wetlands are found Land use planning and regulatory processes are based on wetland classification Different kinds of wetlands provide different ecosystem functions and services. Examples: Emergent tidal wetlands in SF Bay support the endangered California clapper rail. Willow wetlands provide excellent songbird habitat. Vegetated tidal wetlands capture sediment and store carbon.
 It provides a consistent structure for ecosystem characterization")
68 Habitat classification: Why CMECS? Coastal and Marine Ecological Classification Standard It s a national standard (endorsed by the Federal Geographic Data Committee) It provides a consistent structure for ecosystem characterization and mapping Because it s consistent, it allows comparison of status and trends across space and time Activities that require consistent data use CMECS, such as policy development, restoration planning, and fisheries management It s required for projects where federal funds are used!

69 Major components of CMECS Illustration from
70 Upper few levels of CMECS hierarchy Illustration courtesy of Oregon Coastal Management Program
71 Upper few levels of CMECS hierarchy Where to start? Illustration courtesy of Oregon Coastal Management Program
72 CMECS classification: Where to start? What data are most needed for effective resource management? What data are available West Coast-wide? Illustration courtesy of Oregon Coastal Management Program
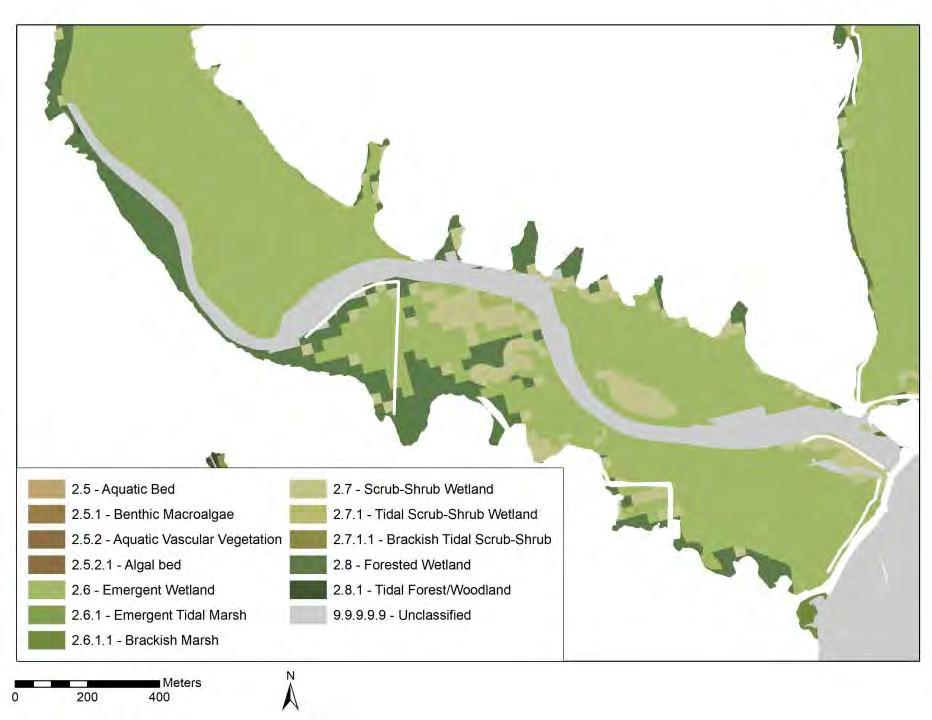
73 CMECS classification: Where to start? Biotic Component contains the familiar classes of emergent, scrub-shrub and forested wetlands. Most regulatory and conservation programs use this classification heavily. Data are available coastwide. Illustration courtesy of Oregon Coastal Management Program
74 CMECS classification: Where to start? Physiographic Setting describes estuary type (e.g. riverine, bay, lagoonal). Estuary type relates very closely to many estuary characteristics and functions. Data are available coastwide. Illustration courtesy of Oregon Coastal Management Program
75 CMECS classification: Where to start? Therefore, PMEP s classification work has focused on the Biotic Component and Physiographic Setting. PMEP is gathering data for other components of CMECS for further classification. Oregon has mapped several other components including Geoform, Substrate, Aquatic Setting Illustration courtesy of Oregon Coastal Management Program
76 CMECS classification: Biotic Component: Benthic/Attached Biota Illustration courtesy of Oregon Coastal Management Program

77 CMECS classification: Biotic Component: Benthic/Attached Biota Illustration courtesy of Oregon Coastal Management Program

78 Updating Oregon's estuarine wetland habitat maps: Modernizing the foundation for coastal resource management Products released Oct. 2014: Andy Lanier 1, Laura Brophy 2, Tanya Haddad 1, Laura Mattison 1 1 Oregon Coastal Management Program, Department of Land Conservation and Development, Salem, OR 2 Estuary Technical Group, Institute for Applied Ecology, Corvallis, OR
79 CMECS classification: Biotic Component PMEP mapping used methods established by the State of Oregon. For emergent, scrub-shrub and forested wetlands: Primary data source: National Wetland Inventory Secondary data source: C-CAP (NOAA s Coastal Change Analysis Program) For aquatic bed wetlands (seagrasses and algae beds), used NWI plus C-CAP (maximum extent).

80 NWI Estuary Extent No NWI data (use CCAP)
81
82 The result: PMEP West Coast Current and Historical Estuary Extent


83 CMECS classification: Biotic Component
84 Next analysis steps Major steps: 1. Classification of habitats (CMECS) 2. Tidal wetland loss assessment 3. Web map interface development 4. Data integration to assist PMEP fish habitat assessments
85 Indirect assessment of West Coast historical tidal wetland loss Laura Brophy 1, Brett Holycross 2, Van Hare 2 1 Estuary Technical Group, Institute for Applied Ecology 2 Pacific States Marine Fisheries Commission
86 Loss Assessment: Motivation 1. PMEP s Estuary Extent layer maps historical and current tidal wetlands. 2. Many of these are not currently tidal. 3. We need to know which areas are nontidal. 4. Spatially explicit data (maps) of loss are urgently needed to: Determine impacts Assess restoration potential Prioritize restoration and conservation actions

")
")
87 Methods: Wetland types studied Emergent (tidal marsh) Scrub-shrub (tidal swamp) Forested (tidal swamp)
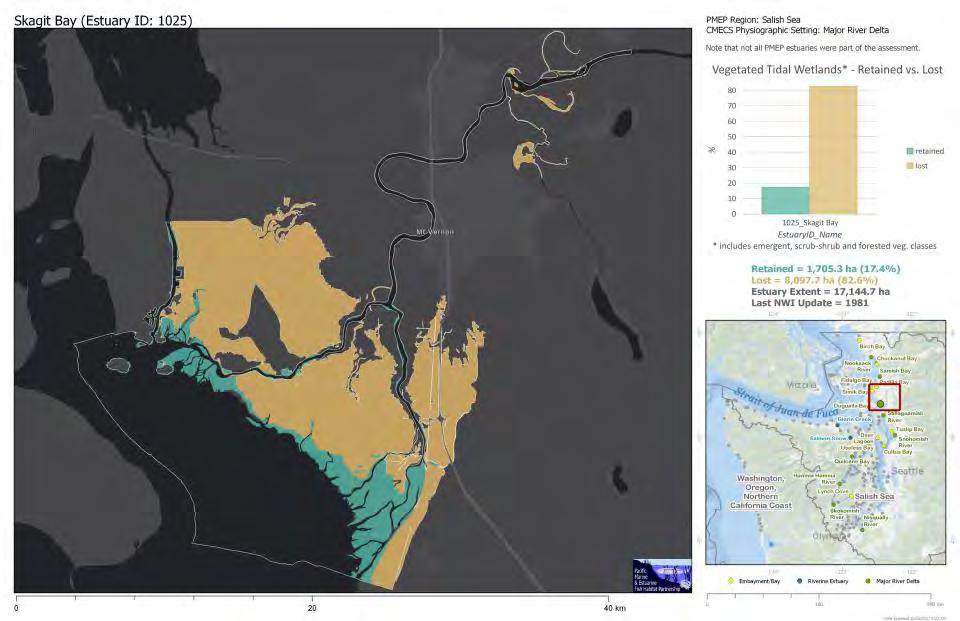
88 Methods: Central concept We used the National Wetland Inventory (NWI) to identify current tidal wetlands within the PMEP extent. These are considered retained. Conversely, all areas within PMEP s Historical and Current Estuary Extent that are not identified in the NWI as tidal wetlands can be considered lost. Non-vegetated areas are not analyzed, unless they were probably originally vegetated wetlands (such as diked salt ponds on former tidal marsh).
89 This is an indirect assessment of West Coast tidal wetland loss Why is this an indirect assessment? Direct assessment would use mapping of disconnected areas (diked, tide gated, filled, etc.) No such mapping exists for the whole West Coast. Most diked and disconnected wetlands are not attributed as such in NWI. Only parts of the West Coast have comprehensive mapping of diked/disconnected areas (e.g. Oregon). Indirect assessment is a reasonable initial approach for broad geographic understanding.
90 Initial results Initial stages of the analysis showed: Method works best in larger estuaries with substantial human alterations For smaller estuaries, scale of NWI data and NWI mapping methods limit usefulness of method Therefore, we focused the analysis on estuaries with >100 ha historical tidal wetland area, and with substantial human alterations (55 estuaries). These 55 estuaries represent over 95% of West Coast historical tidal wetland area.
91 Initial results Initial stages of the analysis also showed that: The method underestimates loss in developed areas (because the Estuary Extent layer doesn t account for lands filled above tidal range). This is especially true for urban estuaries. For technical reasons, the method isn t suitable for lagoonal estuaries, so they were not analyzed.
92 Estuaries studied Number of estuaries Estuary type Included in TWL analysis Not included Total Embayment/Bay Major River Delta Riverine Estuary All types Included in TWL analysis are 55 non-lagoonal estuaries with historical tidal wetland area >100 ha and substantial human alterations. Lagoonal estuaries are omitted from the figures above.
93 Estuaries studied Historical tidal wetland area (ha) Estuary type Included in TWL analysis Not included Total Embayment/Bay 88,870 3,892 92,762 Major River Delta 180, ,685 Riverine Estuary 85,505 2,622 88,127 All types 355,230 7, ,574 % of total historical tidal wetland area 98% 2% 100% Included in TWL analysis are 55 non-lagoonal estuaries with historical tidal wetland area >100 ha and substantial human alterations. Lagoonal estuaries are omitted from the area figures above.
94 Loss assessment results, by estuary size Percent loss is related to estuary size: (Graph shows the 55 estuaries included in the TWL assessment.)

95 Loss assessment results, by estuary type
96 Loss assessment results, by ecoregion Tidal wetland loss (ha) Historical tidal wetland area (ha) Ecoregion # of estuaries % loss Central CA 9 213, , % Salish Sea 13 25,931 30, % S. CA Bight 7 1,965 3, % WA, OR, N. CA 26 60,107 88, % Total , , %

97 The result: PMEP West Coast Current and Historical Estuary Extent
98
99

100

101 Columbia, all reaches: TWL area 47,744 TWL lost 30,875 TWL lost % 64.7%

102
103
104

105
106 Limitations of the analysis Limitations relate to the source data. For example, for the National Wetland Inventory: Wetland mapping and classification are based on remote data Scale is 1:24,000 Represents a point in time (so data may be outdated) No clear path for user input Details on NWI methods are here: Wetland-Deepwater-and-Related-Habitats-of-the-United-States.pdf
107 Limitations of the analysis Two main types of known errors related to NWI source data: Type 1. NWI fails to identify existing tidal wetlands Result: overestimate of loss Common examples Upper estuary (especially forested tidal wetlands) Recent restoration projects
108 NWI Type 1 error examples: Tillamook Bay Hoquarten Slough: forested tidal wetland, miscoded in NWI as nontidal Southern Flow Corridor: tidal wetlands restored in 2016, not yet recoded as tidal in NWI

109 NWI Type 1 error example: Nisqually River Restored tidal wetlands, not yet recoded in NWI as tidal (NWI is from 1981)
110 Limitations of the analysis Two main types of known errors related to NWI source data: Type 2. NWI identifies an area as tidal that is disconnected Result: underestimate of loss Uncommon In some cases NWI data are quite old (>20 yrs).
111 Limitations of the analysis Two types of known errors related to PMEP s Estuary Extent data: Type 1. Estuary Extent data underestimates historical extent of tidal wetlands Result: underestimate of loss Common example: filled and developed areas

112 Richardson Bay PMEP Current and Historical Estuary Extent, North San Francisco Bay and Bay Delta, CA

113 Estuary Extent Type 1 error example: Richardson Bay Pink = historical tidal wetlands (from SFEI)
 are now developed lands, filled above tide range Yellow = PMEP estuary")
114 Estuary Extent Type 1 error example: Richardson Bay Historical tidal wetlands outside PMEP estuary extent (pink) are now developed lands, filled above tide range Yellow = PMEP estuary extent

115 Estuary Extent Type 1 error example: L.A. Harbor Blue line indicates boundary of PMEP s West Coast Historical and Current Estuary Extent Historical estuary extent should include areas adjacent to the harbor, but these urban areas are now filled above tide range.
116 Limitations of the analysis Two types of known errors related to Estuary Extent data: Type 2. Estuary Extent data overestimates historical extent of tidal wetlands Result: overestimate of loss Rare, based on our field work Possible for very subsided diked lands (e.g. south Sacramento-San Joaquin delta)
117 Estuary Extent Type 2 error example: Sacramento-San Joaquin Delta

118 Estuary Extent Type 2 error example: Sacramento-San Joaquin Delta Pink = historical tidal wetlands (from SFEI)
 extends beyond SFEI historical tidal wetlands, probably due to")
119 Estuary Extent Type 2 error example: Sacramento-San Joaquin Delta PMEP estuary extent (blue) extends beyond SFEI historical tidal wetlands, probably due to subsidence
120 Limitations of the analysis Lagoonal estuaries (omitted) 214 small estuaries were omitted from analysis: Few major alterations Few or no tidal wetlands mapped in NWI Scale of alterations too small for NWI Although these represent <2% of West Coast tidal wetland area, they are important to fish diversity and coastal ecosystem function.
121 Comparisons to other data We compared our Tidal Wetland Loss Assessment results to three areas that have with local/regional data on wetland loss or diked status: SFEI Modern Baylands (maps tidal vs. nontidal areas) Lower Columbia tidally impaired lands OCMP CMECS diked areas

122 Comparisons to other data

123 Comparisons to other data
124 Comparisons to other data Comparison to Lower Columbia River Estuary Partnership s Tidally Impaired Lands layer: 93.6% agreement 6.4% disagreement

125 Comparisons to other data

126 Comparisons to other data
127 Comparisons to other data Comparison to Oregon s CMECS diked areas mapping: 82.2% agreement 17.8% disagreement

128 Comparisons to other data

129 Comparisons to other data
130 Comparisons to other data Comparison to San Francisco Estuary Institute s Modern Baylands layer: 95.6% agreement 4.4% disagreement
131 Comparisons to other data - summary Lower Columbia: 93.6% agreement Oregon CMECS: 82.2% agreement San Francisco Bay: 95.6% agreement
132 Significance of the results First West Coast-wide analysis of tidal wetland losses Estuaries analyzed represent >95% of total West Coast historical tidal wetland area Results highlight the high level of alteration and losses in our West Coast estuaries. Results provide a baseline for understanding the status of fish and wildlife that depend on estuaries.
133 Significance Results set the stage for next steps: Address losses by habitat class Refine data on disconnected areas Solicit community input on restored areas Analyze potential climate change/slr impacts SLR impacts mapped in for Oregon s outer coast URL:
134 Recommended uses Comparison of losses at broad scales E.g., across estuaries and regions Data should not be used for site-specific assessment. As described above, refinements are needed: Refine data on disconnected areas Solicit community input on restored areas
135 Take-home messages 1. For planning estuary conservation and restoration, we needed new maps of estuary extent -- and have now built them for the West Coast. 2. Elevation-based maps are the way to go: high-accuracy, and best for planning purposes. 3. Using the new extent maps, we mapped tidal wetland losses. They are high in general (85% for the West Coast) but vary considerably by estuary. 4. All of these new maps are available online: (all maps) (all maps except wetland losses)
136 PMEP Spatial Data Publication Our PMEP team is developing a publication on the estuary extent and loss assessment. The publication will: Clearly document methods Provide interpretation of results Identify data limitations Provide links to products Bring the work to a wide audience A draft is expected in spring 2018.
137 How to access data online: West Coast 1. PMEP data page (

138 How to access data online: West Coast 1. PMEP data page (
139 How to access data online: West Coast 1. PMEP data page (

140 How to access data online: West Coast 1. PMEP data page (
 The West Coast Estuaries Explorer is a collaborative effort between the North Pacific Landscape Conservation")
141 How to access data online: West Coast 2. West Coast Estuaries Explorer ( The West Coast Estuaries Explorer is a collaborative effort between the North Pacific Landscape Conservation Cooperative, PMEP, and Databasin.

142 How to access data online: West Coast 2. West Coast Estuaries Explorer (
143 How to access data online: Oregon Oregon Coastal Atlas (
")
144 How to access data online: Oregon Oregon Coastal Atlas (
")
145 How to access data online: Oregon Oregon Coastal Atlas (
")
146 How to access data online: Oregon Oregon Coastal Atlas (

147 Take-home messages 1. For planning estuary conservation and restoration, we needed new maps of estuary extent -- and have now built them for the West Coast. 2. Elevation-based maps are the way to go: high-accuracy, and best for planning purposes. 3. Using the new extent maps, we mapped tidal wetland losses. They are high in general (85% for the West Coast) but vary considerably by estuary. 4. All of these new maps are available online: (West Coast maps) (most West Coast maps) (Oregon maps)
148 Thank you for listening! Questions? Laura Brophy Director, Estuary Technical Group Institute for Applied Ecology, Corvallis, Oregon, USA and Marine Resource Management Program College of Earth, Ocean and Atmospheric Sciences Oregon State University, Corvallis, Oregon, USA
Sea Level Rise Providing Nature A-Right-of Way
 Sea Level Rise Providing Nature A-Right-of Way Study Area Site 2: Skagit Bay Initial Condition 11.2 Inches by 2050 No Dikes 27.3 Inches by 2100 No Dikes The Problem Loss of coastal wetlands due to submergence
Coastal and Marine Ecological Classification Standard (CMECS)
") Coastal and Marine Ecological Classification Standard (CMECS) Kathy Goodin, NatureServe EMECS, August 2011 Baltimore, MD 1 Outline Objectives & Process Classification Content Questions 2 Objectives Develop
Coastal and Marine Ecological Classification Standard (CMECS) Kathy Goodin, NatureServe EMECS, August 2011 Baltimore, MD 1 Outline Objectives & Process Classification Content Questions 2 Objectives Develop
Introduction: The Gulf of Mexico Alliance. The Gulf GAME project MERMAid and PHINS Results & Conclusions What s next? Examples
 AAG Las Vegas March 25, 2009 Introduction: Ocean governance and Ecosystem-Based Management The Gulf of Mexico Alliance Habitat Identification and Characterization The Gulf GAME project MERMAid and PHINS
Coastal and Marine Ecological Classification Standard (CMECS)
") Coastal and Marine Ecological Classification Standard (CMECS) Mark Finkbeiner NOAA Coastal Services Center Presented at the International Workshop on Seabed Mapping Methods and Technology 18 October 2012
Coastal and Marine Ecological Classification Standard (CMECS) Mark Finkbeiner NOAA Coastal Services Center Presented at the International Workshop on Seabed Mapping Methods and Technology 18 October 2012
Statewide wetland geospatial inventory update
 Statewide wetland geospatial inventory update Factsheet 1: Outcomes from the statewide wetland geospatial inventory update 1 Introduction In 2011 the Victorian Department of Environment and Primary Industries
Baseline Estuarine-Upland Transition Zone
 Baseline Estuarine-Upland Transition Zone in SF, San Pablo and Suisun Bays 10/5/18 Prepared for San Francisco Bay Joint Venture (SFBJV) Prepared by Brian Fulfrost, Principal bfaconsult@gmail.com with additional
The Refugia Concept: Using Watershed Analysis to Prioritize Salmonid Habitat for Conservation and Restoration
 The Refugia Concept: Using Watershed Analysis to Prioritize Salmonid Habitat for Conservation and Restoration Christopher May Battelle & UW Cumulative Impacts of Urbanization Landscape Alterations Loss
Presentation Outline. Project Overview. Sea Level Rise Assessment & Decision Tools. Community Engagement. Tina Whitman, Friends of the San Juans
 Healthy Beaches for People & Fish Sea Level Rise Adaptation Tools for San Juan County, WA Tina Whitman & Andrea MacLennan December 10, 2015 Presentation Outline Project Overview Tina Whitman, Friends of
Relatively little hard substrate occurs naturally in the
 CHAPTER FIVE Rock Habitats Relatively little hard substrate occurs naturally in the estuary, owing mainly to the vast quantities of fine sediment that have been deposited by the rivers. Rock habitat is
Wetlands and Riparian Mapping Framework Technical Meeting
 Wetlands and Riparian Mapping Framework Technical Meeting Meghan Burns Landscape Ecologist Linda Vance Senior Ecologist Why wetland and riparian mapping? Preliminary site assessment for the presence of
Adaptation to Sea Level Rise A Regional Approach
 Adaptation to Sea Level Rise A Regional Approach Project Partners: in Saco Bay, ME Peter Slovinsky, Marine Geologist Maine Geological Survey, Department of Conservation Project Funding from: Saco Bay Hazards
Preliminary Data Release for the Humboldt Bay Sea Level Rise Vulnerability Assessment: Humboldt Bay Sea Level Rise Inundation Mapping
 Preliminary Data Release for the Humboldt Bay Sea Level Rise Vulnerability Assessment: Humboldt Bay Sea Level Rise Inundation Mapping Prepared by: Jeff Anderson, Northern Hydrology & Engineering (jeff@northernhydrology.com)
Virginia Shoreline Mapping Tools
 Virginia Shoreline Mapping Tools December 15, 2017 Karen Duhring Center for Coastal Resources Management Virginia Institute of Marine Science College of William & Mary Virginia Shoreline Mapping Tools
Home About Us Articles Press Releases Image Gallery Contact Us Media Kit Free Subscription 10/5/2006 5:56:35 PM
 Home About Us Articles Press Releases Image Gallery Contact Us Media Kit Free Subscription 10/5/2006 5:56:35 PM Industry Resources Industry Directory NASA Links Missions/Launches Calendar Human development
DEPARTMENT OF GEOLOGY AND MINERAL INDUSTRIES WAYS & MEANS SUBCOMMITTEE ON NATURAL RESOURCES MARCH 2, 2017
 DEPARTMENT OF GEOLOGY AND MINERAL INDUSTRIES WAYS & MEANS SUBCOMMITTEE ON NATURAL RESOURCES MARCH 2, 2017 1 ABOUT DOGAMI AGENCY MISSION, VISION & GOALS 2 Lidar image of a stream network along the Umpqua
USGS efforts to model sea-level rise impact to tidal marshes along the California coast.
 USGS efforts to model sea-level rise impact to tidal marshes along the California coast. Karen Thorne 1 J.Y Takekawa 1, K. Buffington 1, K. Swanson 2, J. Drexler 2, D.Schoellhamer 2, M. Casazza 3, and
Appendix J Vegetation Change Analysis Methodology
 Appendix J Vegetation Change Analysis Methodology Regional Groundwater Storage and Recovery Project Draft EIR Appendix-J April 2013 APPENDIX J- LAKE MERCED VEGETATION CHANGE ANALYSIS METHODOLOGY Building
Armoring on Puget Sound: Progress towards a better baseline
 Western Washington University Western CEDAR Salish Sea Ecosystem Conference 2016 Salish Sea Ecosystem Conference (Vancouver, BC) Armoring on Puget Sound: Progress towards a better baseline Hugh Shipman
Planning for the Future of Humboldt Bay: Sea Level Rise, Sediment Management, Sand Spits and Salt Marshes. Joel Gerwein
 Planning for the Future of Humboldt Bay: Sea Level Rise, Sediment Management, Sand Spits and Salt Marshes Joel Gerwein Introduction to Humboldt Bay Setting Economy, community, and environment Sediment
Summary Description Municipality of Anchorage. Anchorage Coastal Resource Atlas Project
 Summary Description Municipality of Anchorage Anchorage Coastal Resource Atlas Project By: Thede Tobish, MOA Planner; and Charlie Barnwell, MOA GIS Manager Introduction Local governments often struggle
Types of Wetlands. Tidal Systems
 Types of Wetlands Tidal Systems 1 COASTAL WETLAND ECOSYSTEMS Tidal Salt Marshes Tidal Freshwater Marshes Mangrove Wetlands 2 Tidal Estuarine Wetland 3 Definition and Formation of Estuaries Estuary: : partially
Coastal Impacts of Climate Change in the Northwest: A Summary of the Findings of the upcoming National Climate Assessment
 Western Washington University Western CEDAR Salish Sea Ecosystem Conference 2014 Salish Sea Ecosystem Conference (Seattle, Wash.) May 1st, 3:30 PM - 5:00 PM Coastal Impacts of Climate Change in the Northwest:
Subtidal permanently flooded with tidal water. Irregularly exposed surface exposed by tides less often than daily
 Types of Wetlands Tidal Systems COASTAL WETLAND ECOSYSTEMS Tidal Salt Marshes Tidal Freshwater Marshes Mangrove Wetlands Tidal Estuarine Wetland 1 Definition and Formation of Estuaries u Estuary : partially
Sea Level Rise and the Scarborough Marsh Scarborough Land Trust Annual Meeting April 24, 2018
 Sea Level Rise and the Scarborough Marsh Scarborough Land Trust Annual Meeting April 24, 2018 Peter A. Slovinsky, Marine Geologist Maine Geological Survey Funded by: 50% 40% Figure modified from Griggs,
Puakea, Hawaiÿi. Puakea, Hawaiÿi WATERSHED FEATURES
 Puakea, Hawaiÿi DAR Watershed Code: 85046 Puakea, Hawaiÿi WATERSHED FEATURES Puakea watershed occurs on the island of Hawaiÿi. The Hawaiian meaning of the name is white blossom. The area of the watershed
Current and Future Technology Applications for Coastal Zone Management. Bruce K. Carlisle, Acting Director Office of Coastal Zone Management
 Current and Future Technology Applications for Coastal Zone Management Bruce K. Carlisle, Acting Director Office of Coastal Zone Management The Massachusetts Coastal Zone Management Program Approved in
Moreton Bay and Key Geographic Concepts Worksheet
 Moreton Bay and Key Geographic Concepts Worksheet The Australian Curriculum: Geography draws on seven key geographic concepts: place scale space environment change interconnection sustainability They are
Keanahalululu Gulch, Hawaiÿi
 DAR Watershed Code: 85021 WATERSHED FEATURES Keanahalululu Gulch watershed occurs on the island of Hawaiÿi. The Hawaiian meaning of the name is unknown. The area of the watershed is 4.1 square mi (10.6
Eco-hydromorphic Characterization of the Louisiana Coastal Region Using Multiple Remotely Sensed Data Sources and Analyses
 National Wetlands Research Center Eco-hydromorphic Characterization of the Louisiana Coastal Region Using Multiple Remotely Sensed Data Sources and Analyses 1Holly Beck, 2 Brady Couvillion, 1 Nadine Trahan
SIF_7.1_v2. Indicator. Measurement. What should the measurement tell us?
 Indicator 7 Area of natural and semi-natural habitat Measurement 7.1 Area of natural and semi-natural habitat What should the measurement tell us? Natural habitats are considered the land and water areas
Technical Drafting, Geographic Information Systems and Computer- Based Cartography
 Technical Drafting, Geographic Information Systems and Computer- Based Cartography Project-Specific and Regional Resource Mapping Services Geographic Information Systems - Spatial Analysis Terrestrial
Cross walking to the New Coastal and Marine Ecological Classification Standard (CMECS)
") Cross walking to the New Coastal and Marine Ecological Classification Standard (CMECS) Mark Finkbeiner and Chris Robinson NOAA Coastal Services Center EBM Tools Webinar 16 May 2013 Outline What is CMECS
Cross walking to the New Coastal and Marine Ecological Classification Standard (CMECS) Mark Finkbeiner and Chris Robinson NOAA Coastal Services Center EBM Tools Webinar 16 May 2013 Outline What is CMECS
1.1 What is Site Fingerprinting?
 Site Fingerprinting Utilizing GIS/GPS Technology 1.1 What is Site Fingerprinting? Site fingerprinting is a planning tool used to design communities where protection of natural resources is the primary
Sediment Management in the Coastal Bays
 Sediment Management in the Coastal Bays Introduction Need for ecosystem view of sediment management in Coastal Bays Island loss and restoration Navigation needs Habitat Trade offs Living Shoreline Requirements
Generalized Conceptual Models Wetlands Regional Monitoring Program Compiled for the PEEIR
 1 Generalized Conceptual Models Wetlands Regional Monitoring Program 2002 Compiled for the PEEIR 2 1. MANAGEMENT QUESTIONS DRIVE INDICATOR DEVELOPMENT The overarching wetland management questions are:
Design of Levee Breaches in Sheltered Water for Flood Risk Reduction & Marsh Restoration ASFMP; June 5, 2014 Presented By:
 Design of Levee Breaches in Sheltered Water for Flood Risk Reduction & Marsh Restoration ASFMP; June 5, 2014 Presented By: Rohin Saleh Alameda County Flood Control District Matt Powers, P.E. GEI Consultants
Appendix E: Cowardin Classification Coding System
 Appendix E: Cowardin Classification Coding System The following summarizes the Cowardin classification coding system and the letters and numbers used to define the USFWS NWI wetland types and subtypes:
Modeling habitat suitability for the European green crab using the ShoreZone mapping system
 Modeling habitat suitability for the European green crab using the ShoreZone mapping system Jodi N. Harney, Ph.D. and John R. Harper, Ph.D. Coastal and Ocean Resources Inc. Mary Morris, R.P. Bio. Archipelago
Using Remote Sensing to Map the Evolution of Marsh Vegetation in the South Bay of San Francisco
 Using Remote Sensing to Map the Evolution of Marsh Vegetation in the South Bay of San Francisco Brian Fulfrost Design, Community and Environment (DC&E) 6 th Annual Bay-Delta Science Conference PROJECT
Landscape Planning Framework
 Landscape Planning Framework Fish Habitat Catena Geodatabase Methodology Mary Ramirez 1 Charles Simenstad 1 Phil Trask 2 Allan Whiting 2 Alex McManus 2 Funding provided by the Bonneville Power Administration
Biodiversity Blueprint Overview
 Biodiversity Blueprint Overview Climate Variability Climate projections for the Glenelg Hopkins Regions suggest that the weather will be hotter and drier in the coming years which will impact on land use,
EAGLES NEST AND PIASA ISLANDS
 EAGLES NEST AND PIASA ISLANDS HABITAT REHABILITATION AND ENHANCEMENT PROJECT MADISON AND JERSEY COUNTIES, ILLINOIS ENVIRONMENTAL MANAGEMENT PROGRAM ST. LOUIS DISTRICT FACT SHEET I. LOCATION The proposed
Developing a nearshore geospatial framework for recovery assessment and planning
 Western Washington University Western CEDAR Salish Sea Ecosystem Conference 2018 Salish Sea Ecosystem Conference (Seattle, Wash.) Apr 6th, 10:30 AM - 10:45 AM Developing a nearshore geospatial framework
Heather Schlosser Army Corps of Engineers Coastal Studies Group August 28, 2008
 Got sand? Regional Sediment Management in Orange County Heather Schlosser Army Corps of Engineers Coastal Studies Group August 28, 2008 Regional Sediment Management Regional sediment management recognizes
Assessing state-wide biodiversity in the Florida Gap analysis project
 University of Nebraska - Lincoln DigitalCommons@University of Nebraska - Lincoln Nebraska Cooperative Fish & Wildlife Research Unit -- Staff Publications Nebraska Cooperative Fish & Wildlife Research Unit
Lu, S., P. Craig, C. Wallen, Z. Liu, A. Stoddard, W. McAnnally and E. Maak. Dynamic Solutions, Knoxville, TN USACOE, Sacramento District
 An Extended-Delta Hydrodynamic Model Framework for Sea Level Rise Analysis to Support Resource Management Planning for the Sacramento-San Joaquin River Delta Lu, S., P. Craig, C. Wallen, Z. Liu, A. Stoddard,
Puget Sound Shorelines. Announcements
 Announcements Puget Sound Shorelines Wednesday discussion of Bates paper Bham Bay project: Updates, finals week schedules Last portion of the class: Environmental issues in Puget Sound Puget Sound shorelines:
Southwest LRT Habitat Analysis. May 2016 Southwest LRT Project Technical Report
 Southwest LRT Habitat Analysis Southwest LRT Project Technical Report This page intentionally blank. Executive Summary This technical report describes the habitat analysis that was performed to support
Opportunities to Improve Ecological Functions of Floodplains and Reduce Flood Risk along Major Rivers in the Puget Sound Basin
 Opportunities to Improve Ecological Functions of Floodplains and Reduce Flood Risk along Major Rivers in the Puget Sound Basin Christopher Konrad, US Geological Survey Tim Beechie, NOAA Fisheries Managing
Sea Level Affecting Marshes Model (SLAMM) for Coastal Long Island Sound:
 for Coastal Long Island Sound:") 2100 DATA VIEWER MANUAL Sea Level Affecting Marshes Model (SLAMM) for Coastal Long Island Sound: Using a Web Mapping Application Data Viewer to Examine Predicted Land Cover Change for 2100 AUTHOR: KEVIN
2100 DATA VIEWER MANUAL Sea Level Affecting Marshes Model (SLAMM) for Coastal Long Island Sound: Using a Web Mapping Application Data Viewer to Examine Predicted Land Cover Change for 2100 AUTHOR: KEVIN
Coastal Barrier Island Network (CBIN): Management strategies for the future
: Management strategies for the future") Coastal Barrier Island Network (CBIN): Management strategies for the future Heather Joesting*, Amy Williams**, Rusty Feagin**, and William K. Smith* *Department of Biology, Wake Forest University, Winston
Coastal Barrier Island Network (CBIN): Management strategies for the future Heather Joesting*, Amy Williams**, Rusty Feagin**, and William K. Smith* *Department of Biology, Wake Forest University, Winston
Jeff Opperman Final Report for Fellowship R/SF-4
 Jeff Opperman Final Report for Fellowship R/SF-4 My CALFED fellowship (R/SF-4) had three primary research areas: (1) how native fish use California floodplains; (2) developing a method to identify and
The Arctic Landscape Conservation Cooperative Conservation Goals
 The Arctic Landscape Conservation Cooperative Conservation Goals Adopted by the Arctic LCC Steering Committee, 24 August 2010 Background : Landscape Conservation Cooperatives and Climate Science Centers
Ecological mapping using satellite imagery: an Abu Dhabi case study Middle East Geospatial Forum 16 th February 2015
 Ecological mapping using satellite imagery: an Abu Dhabi case study Middle East Geospatial Forum 16 th February 2015 Richard Flemmings rf@proteusgeo.com About Proteus Formed in UAE 2011 We specialise in
Mapping of Future Coastal Hazards. for Southern California. January 7th, David Revell, Ph.D. E.
 Mapping of Future Coastal Hazards for Southern California January 7th, 2014 David Revell, Ph.D. drevell@esassoc.com E. Vandebroek, 2012 Outline Coastal erosion hazard zones Flood hazard zones: Coastal
THE USE OF GEOSPATIAL DATA TO SUPPORT VULNERABILITY MAPPING OF THE OREGON COAST. Kelvin Raiford MS Candidate Geography Department of Geosciences
 THE USE OF GEOSPATIAL DATA TO SUPPORT VULNERABILITY MAPPING OF THE OREGON COAST Kelvin Raiford MS Candidate Geography Department of Geosciences INTRODUCTION This study is an outcome of the project Geospatial
TOWARDS CLIMATE-RESILIENT COASTAL MANAGEMENT: OPPORTUNITIES FOR IMPROVED ICZM IN BELIZE
 TOWARDS CLIMATE-RESILIENT COASTAL MANAGEMENT: OPPORTUNITIES FOR IMPROVED ICZM IN BELIZE CHANTALLE SAMUELS Coastal Zone Management Authority and Institute The Caribbean Community Climate Change Centre VULNERABILITY
CORE CMECS GIS PROCESSING METHODS OREGON ESTUARY PROJECT OF SPECIAL MERIT
 CORE CMECS GIS PROCESSING METHODS OREGON ESTUARY PROJECT OF SPECIAL MERIT Andy Lanier, Tanya Haddad, Laura Mattison, Laura Brophy Oregon Coastal Management Program Oregon Dept. of Land Conservation and
Use of Remote Sensing and GIS for Wetland, Riparian, and Watershed Assessment, Restoration, and Monitoring
 Use of Remote Sensing and GIS for Wetland, Riparian, and Watershed Assessment, Restoration, and Monitoring Ralph Tiner Wetland Ecologist U.S. Fish & Wildlife Service National Wetlands Inventory Program
GIS Data, Technology, and Models. to Integrate Information and Improve Transportation Decision-Making. within the Eco-Logical* Framework for Oregon
 GIS Data, Technology, and Models to Integrate Information and Improve Transportation Decision-Making within the Eco-Logical* Framework for Oregon GIS-T 2009, Oklahoma City, OK April 8, 2009, Session 5..2.2
ESRI NONPROFIT/CONSERVATION GRANTS PROGRAM STATUS REPORT JANUARY 2010
 ESRI NONPROFIT/CONSERVATION GRANTS PROGRAM STATUS REPORT JANUARY 2010 Grantee ESRI Client Number 150983 FARMINGTON RIVER WATERSHED ASSOCIATION 749 Hopmeadow Street, Simsbury, Connecticut 06070 Contact:
Solutions to Flooding on Pescadero Creek Road
 Hydrology Hydraulics Geomorphology Design Field Services Photo courtesy Half Moon Bay Review Solutions to Flooding on Pescadero Creek Road Prepared for: San Mateo County Resource Conservation District
Sea Level Rise in Miami-Dade County Florida Implications for Management of Coastal Wetlands and the Everglades
 Sea Level Rise in Miami-Dade County Florida Implications for Management of Coastal Wetlands and the Everglades Peter W. Harlem Dr. John F. Meeder Florida International University Southeast Environmental
Regional Sediment Management
 Regional Sediment Management Linda S. Lillycrop Program Manager Coastal Engineer US Army Engineer Research and Development Center Coastal and Hydraulics Laboratory Q AVG Coastal Resilience: The Environmental,
A process-based approach toward assessing the coastal impact of projected sea level rise and severe storms
 A process-based approach toward assessing the coastal impact of projected sea level rise and severe storms Patrick Barnard 1, Cheryl Hapke 2, Li Erikson 1, Amy Foxgrover 1, and Maarten van Ormondt 3 1
Assessing ecological integrity of salt marshes in the Northeast
 Assessing ecological integrity of salt marshes in the Northeast A project of the North Atlantic Landscape Conservation Cooperative Bradley W. Compton Department of Environmental Conservation University
Appendix 9: Transition Zone Background & Methodology
 Appendix 9: Transition Zone Background & Methodology of the Wetlands on the Edge: The Future of Southern California's Wetlands Regional Strategy 2018 Primary Author: April Robinson, San Francisco Estuary
HAB Forecaster. For info on HABs in the Pacific Northwest see:
 HAB Forecaster BACKGROUND In this activity, students can take on the role as a resource manager or scientist, tasked with deciding if razor clam harvesters should go out onto the beach to harvest razor
Modeling Sea-Level Rise in Coastal Wetlands: Understanding Potential Impacts and Their Implications for Management on Cape Cod
 Modeling Sea-Level Rise in Coastal Wetlands: Understanding Potential Impacts and Their Implications for Management on Cape Cod C a p e C o a s t a l C o n f e r e n c e H y a n n i s R e s o r t a n d
NOAA s OCM: Services, tools and collaboration opportunities & Puerto Rico s NE Marine Corridor as a case study
 NOAA s OCM: Services, tools and collaboration opportunities & Puerto Rico s NE Marine Corridor as a case study Dr. Antares Ramos Álvarez NOAA s Office of Coastal Management September 15 th, 2016 Conservation
Landscape Planning and Habitat Metrics
 Landscape Planning and Habitat Metrics Frank W. Davis National Center for Ecological Analysis and Synthesis UC Santa Barbara (Tools for Landscape Biodiversity Planning) Jimmy Kagan Institute for Natural
Water Atlas Overview. Myakka River Management Coordinating Council June 22, 2012 Englewood, Florida
 Water Atlas Overview Myakka River Management Coordinating Council June 22, 2012 Englewood, Florida What is the Water Atlas? A data warehouse A set of interactive maps A collection of tools for viewing/analyzing
Wetland Mapping. Wetland Mapping in the United States. State Wetland Losses 53% in Lower US. Matthew J. Gray University of Tennessee
 Wetland Mapping Caribbean Matthew J. Gray University of Tennessee Wetland Mapping in the United States Shaw and Fredine (1956) National Wetlands Inventory U.S. Fish and Wildlife Service is the principle
Lower South Fork McKenzie River Floodplain Enhancement Project
 Lower South Fork McKenzie River Floodplain Enhancement Project McKenzie River Ranger District Willamette National Forest Project Location The project is located in the South Fork McKenzie River Watershed,
Sea-level Rise on Cape Cod: How Vulnerable Are We? Rob Thieler U.S. Geological Survey Woods Hole, MA
 Sea-level Rise on Cape Cod: How Vulnerable Are We? Rob Thieler U.S. Geological Survey Woods Hole, MA Outline Sea-level and coastal processes Past sea-level change Predictions for the future Coastal responses
The Use of Geographic Information Systems to Assess Change in Salt Marsh Ecosystems Under Rising Sea Level Scenarios.
 The Use of Geographic Information Systems to Assess Change in Salt Marsh Ecosystems Under Rising Sea Level Scenarios Robert Hancock The ecological challenges presented by global climate change are vast,
Mapping the Transition Zone:
 Mapping the Transition Zone: Integrating the Upper Boundary and Bay Margin Methods Table of Contents Acknowledgements 2 Background 2 Defining a Transition Zone 4 Key Audiences 5 Current state of transition
Birch Creek Geomorphic Assessment and Action Plan
 Birch Creek Geomorphic Assessment and Action Plan Jim Webster Tim Hanrahan, PhD, CFM Jesse Schwartz, PhD Zach Hill January 22, 2015 White Eagle Grange This Project is a First Step in Strategy Planning
National Wetlands Inventory Update for New England 2009
 National Wetlands Inventory Update for New England 2009 Ralph Tiner Wetland Ecologist U.S. Fish & Wildlife Service National Wetlands Inventory Program Where we ve been Maps Status and trends investigations
Pablo Bay in Sonoma, Solano, and Napa Counties. It is owned and managed by the U.S. Fish and Wildlife
 Appendix L San Pablo Bay Marsh Introduction San Pablo Bay National Wildlife Refuge marsh (hereafter San Pablo) is located on the north shore of San Pablo Bay in Sonoma, Solano, and Napa Counties. It is
Sunset Harbour / Huntington Harbour Maintenance Dredging and Waterline Installation Project. CMANC 21 January 2016
 Sunset Harbour / Huntington Harbour Maintenance Dredging and Waterline Installation Project CMANC 21 January 2016 County of Orange Footprint Huntington Harbour Operational and Dredging Cost Sharing Agreements
Mapping Predicted Tidal Exposure Durations Using a MLLW-Referenced LiDAR Terrain Model
 Mapping Predicted Tidal Exposure Durations Using a MLLW-Referenced LiDAR Terrain Model for Management of Spartina alterniflora in Willapa Bay, Washington Meeting the Challenge: Invasive Plants in PNW Ecosystems
Land Use MTRI Documenting Land Use and Land Cover Conditions Synthesis Report
 Colin Brooks, Rick Powell, Laura Bourgeau-Chavez, and Dr. Robert Shuchman Michigan Tech Research Institute (MTRI) Project Introduction Transportation projects require detailed environmental information
APPENDIX F SEDIMENT DEPOSITION AND HABITAT CONVERSION ANALYSIS
 APPENDIX F SEDIMENT DEPOSITION AND HABITAT CONVERSION ANALYSIS San Dieguito Lagoon W-19 Restoration Project Draft EIR March 2017 Appendices Introduction: The following is an analysis to provide the volume
9 th INTECOL Orlando, Florida June 7, 2012
 Restoration of the Everglades Saline Wetlands and Florida Bay: Responses Driven from Land and Sea David Rudnick 1, Colin Saunders 2, Carlos Coronado 2, Fred Sklar 2 Erik Stabenau 1, Vic Engel 1, Rene Price
Mapping and Modeling for Regional Planning
 Mapping and Modeling for Regional Planning Carol W. Witham Sacramento Valley Chapter California Native Plant Society contributors: David Ackerly John Dittes Julie Evens Josephine Guardino Robert F. Holland
We are interconnected, we are resilient As air temperatures warm forests change, fires increase glaciers retreat, snowpack diminishes sediment
 We are interconnected, we are resilient As air temperatures warm forests change, fires increase glaciers retreat, snowpack diminishes sediment increases rivers change, salmon respond base sea level rises
Community Mapping Network. Selected Coastal Atlases and Information Systems in British Columbia, Canada
 Community Mapping Network Selected Coastal Atlases and Information Systems in British Columbia, Canada Outline Community Mapping Network cmnbc.ca Pacific Coastal Resources Atlas for BC cmnbc.ca The Living
Town of Old Orchard Beach: A summary of sea level rise science, storm surge, and some highlighted results from SLAWG work efforts
 Town of Old Orchard Beach: A summary of sea level rise science, storm surge, and some highlighted results from SLAWG work efforts October 15, 2013 Peter A. Slovinsky, Marine Geologist Maine Geological
EnviroAtlas: An Atlas about Ecosystems and their Connection with People
 EnviroAtlas: An Atlas about Ecosystems and their Connection with People Annie Neale, Megan Mehaffey & Atlas Team ASWM Webinar October, 17 th, 2012 What is it? The Atlas is an online decision support tool
Setting Priorities for Eelgrass Conservation and Restoration. Robert Buchsbaum Massachusetts Audubon Society
 Setting Priorities for Eelgrass Conservation and Restoration Robert Buchsbaum Massachusetts Audubon Society Eelgrass habitat values A rich, productive habitat for many marine organisms Nursery habitat
Biogeographic Approach to Coastal Assessments & Spatial Planning
 NOAA s Biogeographic Approach to Coastal Assessments & Spatial Planning Mark E. Monaco Mark.Monaco@noaa.gov Center for Coastal Monitoring and Assessment http://ccma.nos.noaa.gov/about/biogeography Biogeography
GIS-Based Sediment Quality Database for the St. Louis River Area of Concern (AOC): Overview Presentations and Demonstration
: Overview Presentations and Demonstration") GIS-Based Sediment Quality Database for the St. Louis River Area of Concern (AOC): Overview Presentations and Demonstration Judy L. Crane 1 and Dawn E. Smorong 2 1 Minnesota Pollution Control Agency, St.
GIS-Based Sediment Quality Database for the St. Louis River Area of Concern (AOC): Overview Presentations and Demonstration Judy L. Crane 1 and Dawn E. Smorong 2 1 Minnesota Pollution Control Agency, St.
The Field Research Facility, Duck, NC Warming Ocean Observations and Forecast of Effects
 The Field Research Facility, Duck, NC Warming Ocean Observations and Forecast of Effects A potential consequence of a warming ocean is more frequent and more intense wind events (Hurricanes & Typhoons)
Great California Delta Trail Blueprint for Contra Costa and Solano Counties GIS AND MAPPING MEMORANDUM JULY 2010
 Great California Delta Trail Blueprint for Contra Costa and Solano Counties GIS AND MAPPING MEMORANDUM JULY 2010 {DRAFT} July 2010 Introduction Geographic Information Systems (GIS) are computer-based
Positioning the Pacific: NOAA s Geospatial Activities. Juliana Blackwell, Director NOAA s National Geodetic Survey March 6, 2012
 Positioning the Pacific: NOAA s Geospatial Activities Juliana Blackwell, Director NOAA s National Geodetic Survey March 6, 2012 A Common Problem of the Early 19 th Century 1807 President Thomas Jefferson
ICAN Great Lakes Workshop
 Washington Coastal latlas ICAN Great Lakes Workshop September 13 15, 15 2010 Current Washington Coastal Atlas http://www.ecy.wa.gov/programs/sea/sma/atlas_home.html 1 st version of WA Coastal Atlas was
TIDAL EROSION AT ELKHORN SLOUGH
 TIDAL EROSION AT ELKHORN SLOUGH Virtually all of California s tidal wetlands have been dramatically altered. Hydrological manipulations changes in water flow are widespread. Either flow has been decreased
MISSOURI LiDAR Stakeholders Meeting
 MISSOURI LiDAR Stakeholders Meeting East-West Gateway June 18, 2010 Tim Haithcoat Missouri GIO Enhanced Elevation Data What s different about it? Business requirements are changing.fast New data collection
Fig 1. Steps in the EcoValue Project
 Assessing the Social and Economic Value of Ecosystem Services in the Northern Forest Region: A Geographic Information System (GIS) Approach to Landscape Valuation Principal Investigator(s): Dr. Matthew