Energy-Filtering. Transmission. Electron Microscopy
|
|
|
- Theodore Harmon
- 5 years ago
- Views:
Transcription
1 Part 3 Energy-Filtering Transmission Electron Microscopy 92
2 Energy-Filtering TEM Principle of EFTEM expose specimen to mono-energetic electron radiation inelastic scattering in the specimen poly-energetic electron beam. remember CTEM: image-forming electrons are selected by scattering angle (via objective-lens aperture) diffraction contrast CTEM image is formed with the full range of electron energies EFTEM: the transmitted electrons pass an energy filter energy filter: electron path depends on kinetic energy energy-dispersive plane slit aperture in energy dispersive plane energy selection (in addition to scattering-angle selection) admit only electrons with kinetic energy (or energy loss) within a particular interval [E 1,E 2 ] to the image or diffraction pattern 93
 filter: electron beam specimen magnetic field slower electron aperture fast")

3 Instrumentation two fundamentally different constructions: in-column and post-column in-column filter present generation: omega type future: mandoline filter, W-filter, omega ( ) filter: electron beam specimen magnetic field slower electron aperture fast electron energydispersive plane advantages: mirror symmetry reduces aberrations filtered images and diffraction patterns can be recorded on photographic film future generation filters enable extremely large scattering angles and fields of view with the same energy loss 94


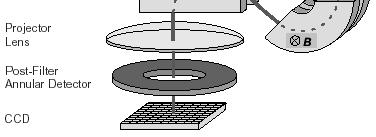
4 post-column filter Gatan GIF (Gatan imaging filter) 95
5 advantages: can be retrofitted to many microscopes images and diffraction patterns can also be recorded without the filter CSAM s new instrument: Tecnai F30 (FEI) 300 kv field-emission gun XEDS with selected Si-Li detector scan unit Gatan post-column imaging filter (GIF 2002) 96
6 EFTEM Techniques operating modes of the energy filter zero-loss filtering energy-loss window overview of important EFTEM techniques: EELS zero-loss filtering quantitative CBED electron-spectroscopic imaging (ESI) tomography EELS imaging the energy-dispersive plane of the energy filter onto the image plane (viewing screen) of the microscope: electron energy-loss spectrum of the illuminated specimen area record with CCD camera EELS spectrum, ELNES elemental analysis, electronic structure 97

 no energy loss in")


7 Zero-Loss Filtering position slit aperture on zero-loss peak of the EELS spectrum only those electrons that suffered (practically) no energy loss in the specimen can pass only elastically scattered electrons (electrons that have not suffered any energy loss) arrive at the electron detector (viewing screen, photographic plate, or CCD camera). two major applications: imaging of thick specimens quantitative electron diffraction, particularly with a highly convergent electron beam (CBED) demonstration of zero-loss filtering: CTEM image without (left) and with energy filter (right) 98
8 example: microstructure of a Ti Al V alloy specimen was not perfectly thin a substantial fraction of the transmitted electrons has suffered energy losses in the specimen without filter: inelastically scattered electrons also reach the image plane chromatic aberration of the objective lens image part due to inelastically scattered electrons is out of focus diffuse background image appears blurred and has poor contrast same image with zero-loss filtering: only elastically scattered electrons contribute to the image no effect of chromatic aberration image is much sharper image has substantially better contrast zero-loss filtering enables TEM imaging of thicker specimens significance: preparation of TEM specimens often imposes severe problems example: specimens from multi-component materials mechanical pre-preparation difficult different sputtering rates during ion-beam milling ability to image thicker specimens constitutes a major advantage for TEM of many types of structural and electronic materials 99


9 zero-loss filtering also improves TEM diffraction patterns conventional diffraction patterns: diffuse background particularly in thicker regions of the specimen this problem is particularly evident in CBED CBED usually must be carried out in thicker regions of the specimen in order to obtain enough fine detail fine detail is particularly sensitive to diffuse background zero-loss filtering removes the diffuse background much clearer and sharper diffraction patterns demonstration of zero-loss-filtered CBED: cubic BN (boron nitride) in [110] direction 100
10 left: unfiltered pattern blurred poor contrast line scan of diffracted intensity at the bottom features pronounced background intensity right: filtered pattern sharp fine detail high contrast line scan of diffracted intensity exhibits substantially smaller background zero-loss filtered CBED patterns can be quantitatively evaluated requires recording the pattern with a CCD camera conventional diffraction patterns: diffuse background inhibits quantitative evaluation quantification of diffracted intensities electron structure factors assessment of the nature of chemical bonds in crystals: convert electron structure factors to X-ray structure factors (Mott formula) perform a Fourier transformation charge density reflects nature of interatomic bonds distinguish, for example, between ionic and covalent interatomic bonding 101
11 however: small effect subtract charge density of inner shells to obtain bonding charge density it is not possible to invert the diffracted intensities and directly extract the underlying parameters compare experimental CBED patterns with and simulated patterns optimize the model (parameters) by computer-based refinement algorithm minimization of x 2 = n i=1 w i cf sim exp i f i i: pixel index; N: total number of pixels; f i exp, f i sim : experimental and simulated pixel intensity, respectively; w i (= 1): weighing factor; i : standard deviation of pixel intensity in the experimental data noise; c: scaling constant. 2 example of recent research: interatomic bonding in NiAl B2 structure (CsCl) primitive cubic zero-loss-filtered CBED patterns recorded 5 away from the [110] zone axis (avoid Bragg contrasts) diffraction geometry and example of CBED pattern: 102


12 scans along S1, S2, S3, S4 result of the fitting procedure: 103

13 measured structure factors: map of bonding charge density: 104
14 result: concentration of electrons along the nearest neighbor (NN) axis partial formation of a covalent bond electrons are drawn away from the core regions, in particular from the Al core both atoms are equally charged and do not have opposite ionicities donate their electrons to covalent or metallic bonds in the crystal second important application of energy-filtered, quantitative CBED: highly precise measurement of lattice spacings with nanometer resolution determination of stress and strain fields on the nanoscale position of higher-order Laue-zone lines can be determined with substantially less uncertainty the determination of the strain state from the higher-order Laue zone (HOLZ) line positions can be automated by of digital image processing local lattice parameter can be determined with high accuracy recent experiments demonstrated an accuracy of about 10-4 variety of applications thermal expansion lattice misfit strain transformation strain stress fields of particles, crack tips, etc. 105
15 Electron Spectroscopic Imaging chemical analysis by imaging with particular, element-specific energy-loss windows advantage of ESI over STEM-EELS (EELS with scanning electron probe): fast! comparison between EELS and ESI two-dimensional data acquisition STEM-EELS: sequential recording 106
16 high spatial resolution obtained only with field-emission gun instruments early work exists, but rapid development of EFTEM began when omega-type and post-column energy filters became available full spectra extending from the zero-loss up to energy loss of 1..2 kev can be retrieved from extended series of ESI-images. quantitative analysis of the resulting intensity distribution ideally, intensity I(x, y, E 1, E) should be independent of the sequence in which the data are acquired Basics of Quantification after background subtraction, the integrated intensity under an inner-shell loss edge is given by I k [ E 1,E 2 ] = N A k [ E 1,E 2 ]I l [ E 2 E 1 ] N a : number of of A-atoms per unit area, k[ ]: inelastic scattering crosssection for the K-edge of element A in a spectral integration interval [E 1, E 2 ], I l : intensity in the low-loss region integrated up to the energy loss E 2 + E 1. starting point of the integration window: ev above the edge onset omit strong oscillations of the near-edge structure density N a (atoms/nm 2 ): t = N A n A 107
17 n A : number of atoms per volume unit of element A. atom density n a of element A in a compound A x R is related to the mass density of the compound by n A = x n and n = N A A n: number of atoms per formula unit per unit volume; A; molar mass; N A : Avogadro number ( ). if only concentration ratios between two elements A and B need to be determined, the low-loss intensity I l [E 2 -E 1 ] does not have to be measured result is determined by the ratio of the intensities under the core-loss edges after background subtraction: N B = B E k 1,E 2 N B A k E 1,E 2 [ ] I A k [ E 1,E 2 ] [ ] I B k [ E 1,E 2 ] specimen thickness t can be computed from the inelastic mean free path length for inelastic electron scattering with energy losses smaller than an integration limit E int t = Ln I tot I 0 integration limit E int should be chosen in the range of 150 to 200 ev 108
18 Elemental Mapping Images characteristic edges in the energy-loss spectrum onset energy characteristic of atomic species concentration of an element can be determined from EELS spectrum if the pre-edge background must be extrapolated and subtracted from the signal above the edge ESI images: subtract background for each pixel efficient method for background subtraction: three-window technique 109
19 two ESI images are acquired in the background region, before the edge extrapolate background and subtracted from the ESI image containing the signal above the edge result: difference image contains intensity only in regions where the corresponding element is present in the sample maps the distribution of this element however, intensity in the difference image not only depends on concentration of the element but on grain orientation artifacts usually referred to as preservation of elastic scattering contrast intensity of the individual ESI images is low 100 to 1000 times smaller than the corresponding bright-field image ESI images tend to be very noisy difficult to detect elements in very small concentrations (below 1 at.%) noise can be reduced by image processing techniques however, this may result in loss of resolution optimum position and width of the three energy windows depend on: 110
20 the intensity in the energy-loss spectrum, which decreases strongly with increasing energy the shape of the edge, which shows a sharp onset only for light elements the width of the unstructured background region before the edge often, the relative amount and spatial distribution of several elements has to be studied in a given region of the specimen elemental distribution images can be combined in one image by using different colors for each element and overlaying the individual images if several elements are present in some region, mixed colors will result mixed colors reveal important information about the occurrence of particular (stoichiometric) phases or compounds straight-forward quantitative analysis of three-window ESI images is possible if only concentration ratios of two elements are required: divide the ESI image of one element by the image of the other normalize by the ratios of the core-loss scattering crosssection quantitative two-dimensional maps of concentration ratios 111

21 demonstration of elemental mapping via ESI: oxygen maps of Si 3 N 4 ceramics grain boundaries contain amorphous film film thickness can be controlled by Ca doping ESI images show grain boundary film for three different film thicknesses Detection Limits cross-sections for inner-shell excitations are small detection limit is governed by the signal-to-noise ratio signal intensity in the presence of element A: I A = 1 e j 0 n A A j 0 : current densituo of incident beam; n A : number of A atoms per unit area; : integration time (exposure time of the image); A = A [E 1, E 2,, c, 0 ]: integrated elastic scattering crosss-section for the chosen energy window ([E 1, E 2 ], width ); c : illumination aperture; 0 : objective aperture. intensity I A is superimposed on a background: 112
22 I b = 1 e j 0 n A A + X b n X X, to which the element A and all other elements contribute according to their densities n X. the two images acquired at energy losses E 1 and E 2 below the edge show only this background intensity extrapolate background by power law: I b = a( E ) r subtract from third image, I 3 = I A +I b to obtain I A, the elemental map of element A signal-to-noise level for the above example of grain boundary films in Si 3 N 4 ceramics: empirical rule: detection requires S/N > 5 113
23 theoretical curve: result of quantitative consideration of Poisson noise statistics (not derived here) the S/N ratio can be improved by integrating parallel to the boundary (upper curve) theoretical curve even one monolayer of oxide should be detectable in integrated line scans!! effect of increasing the high voltage: inelastic scattering cross-sections X decrease this can be countered to some extent by using a greater specimen thickness (this also reduces the influence of surface layers) accelerating voltages above 1 MeV, however, are clearly disadvantageous Spatial Resolution of ESI spatial resolution is controlled by a number of factors: the ultimate limit aberrations of the electron optical elements of the instrument (spherical aberration, aperture, instabilities) instrumental resolution limit however, the resolution is further degraded by the inherent delocalization of inelastic scattering (a consequence of the quantum mechanical uncertainty principle): 114
24 d del = 2 E 3/4 M : de Broglie wavelenth; : acceptance angle; M: magnification. calculations show that this contribution is small and can be ignored for inner-shell losses of 100 ev and higher resulting resolution d ges as a function of the maximum scattering angle : d s, d c, d b : contribution from spherical aberration, chromatic aberation, aperture. often, however,the dominant limitation arises from the statistical nature of inelastic scattering and the weakness of the signal 115

 right: ESI image individual layers are resolved")
25 structures close to the instrumental resolution limit remain unresolved in ESI images because of poor signal-to-noise ratio object-related resolution limit often two to five times worse than the instrumental resolution limit! demonstration of highly resolved ESI imaging: ESI map of Si in a SiGe multilayer with 1.5 nm layer thickness left: bright-field image (conventional TEM) right: ESI image individual layers are resolved spatial resolution on the order of 1 nm 116

26 Tomography principle of tomography reconstruct a volume of material from a series of twodimensional projections (sections) complication with TEM: dynamical diffraction non-linear contrast formation image contrast changes dramatically with specimen orientation solution: ESI form image only with electrons that have undergone a particular energy loss, typical for a chemical element in the specimen demonstration: 117

27 Y 2 O 3 nanopartlcies at FeAl grain boundaries electron-spectroscopic imaging with oxygen edge images in different directons, spanning a tilt-angle range of 120 recorded under energy losses of 0, 20, 40, and 60 ev 360 views of Y 2 O 3 a nanoparticle ensemble, computerreconstructed from multiple elemental maps over a tilt-angle range of 120 : 118

28 The Future of Analytical TEM 119
29 SESAM stands for sub-ev sub-å microscope prototype is presently being installed in Stuttgart/Tübingen (Germany) features: electron monochromator (electrostatic omega filter in the illumination system) limit the energy spread of the primary electrons down to 0.2 ev mandoline filter superior transmissivity potential applications: fine structure in EELS spectra with superior energy resolution electronic structure of crystal defects examples: distinguish solute atoms in different environments (e. g. cations in inverse spinel versus normal spinel) effect of crystal defects on the bandstructure of semiconductor crystals examples: electronic effect of crystal dislocations, stacking faults, grain boundaries, electronic effect of misfit strain in semiconductor heterostructures 120
Transmission Electron Microscopy
 L. Reimer H. Kohl Transmission Electron Microscopy Physics of Image Formation Fifth Edition el Springer Contents 1 Introduction... 1 1.1 Transmission Electron Microscopy... 1 1.1.1 Conventional Transmission
High-Resolution. Transmission. Electron Microscopy
 Part 4 High-Resolution Transmission Electron Microscopy 186 Significance high-resolution transmission electron microscopy (HRTEM): resolve object details smaller than 1nm (10 9 m) image the interior of
AP5301/ Name the major parts of an optical microscope and state their functions.
 Review Problems on Optical Microscopy AP5301/8301-2015 1. Name the major parts of an optical microscope and state their functions. 2. Compare the focal lengths of two glass converging lenses, one with
Weak-Beam Dark-Field Technique
 Basic Idea recall bright-field contrast of dislocations: specimen close to Bragg condition, s î 0 Weak-Beam Dark-Field Technique near the dislocation core, some planes curved to s = 0 ) strong Bragg reflection
Chemical Analysis in TEM: XEDS, EELS and EFTEM. HRTEM PhD course Lecture 5
 Chemical Analysis in TEM: XEDS, EELS and EFTEM HRTEM PhD course Lecture 5 1 Part IV Subject Chapter Prio x-ray spectrometry 32 1 Spectra and mapping 33 2 Qualitative XEDS 34 1 Quantitative XEDS 35.1-35.4
CHEM 681 Seminar Mingqi Zhao April 20, 1998 Room 2104, 4:00 p.m. High Resolution Transmission Electron Microscopy: theories and applications
 CHEM 681 Seminar Mingqi Zhao April 20, 1998 Room 2104, 4:00 p.m. High Resolution Transmission Electron Microscopy: theories and applications In materials science, people are always interested in viewing
Elastic and Inelastic Scattering in Electron Diffraction and Imaging
 Elastic and Inelastic Scattering in Electron Diffraction and Imaging Contents Introduction Symbols and definitions Part A Diffraction and imaging of elastically scattered electrons Chapter 1. Basic kinematical
Overview of scattering, diffraction & imaging in the TEM
 Overview of scattering, diffraction & imaging in the TEM Eric A. Stach Purdue University Scattering Electrons, photons, neutrons Radiation Elastic Mean Free Path (Å)( Absorption Length (Å)( Minimum Probe
Transmission Electron Microscopy and Diffractometry of Materials
 Brent Fultz James Howe Transmission Electron Microscopy and Diffractometry of Materials Fourth Edition ~Springer 1 1 Diffraction and the X-Ray Powder Diffractometer 1 1.1 Diffraction... 1 1.1.1 Introduction
MSE 321 Structural Characterization
 Auger Spectroscopy Auger Electron Spectroscopy (AES) Scanning Auger Microscopy (SAM) Incident Electron Ejected Electron Auger Electron Initial State Intermediate State Final State Physical Electronics
Chapter 10. Nanometrology. Oxford University Press All rights reserved.
 Chapter 10 Nanometrology Oxford University Press 2013. All rights reserved. 1 Introduction Nanometrology is the science of measurement at the nanoscale level. Figure illustrates where nanoscale stands
CHARACTERIZATION of NANOMATERIALS KHP
 CHARACTERIZATION of NANOMATERIALS Overview of the most common nanocharacterization techniques MAIN CHARACTERIZATION TECHNIQUES: 1.Transmission Electron Microscope (TEM) 2. Scanning Electron Microscope
Auger Electron Spectroscopy Overview
 Auger Electron Spectroscopy Overview Also known as: AES, Auger, SAM 1 Auger Electron Spectroscopy E KLL = E K - E L - E L AES Spectra of Cu EdN(E)/dE Auger Electron E N(E) x 5 E KLL Cu MNN Cu LMM E f E
KMÜ 396 MATERIALS SCIENCE AND TECH. I PRESENTATION ELECTRON ENERGY LOSS SPECTROSCOPY (EELS) TUĞÇE SEZGİN
 TUĞÇE SEZGİN") KMÜ 396 MATERIALS SCIENCE AND TECH. I PRESENTATION ELECTRON ENERGY LOSS SPECTROSCOPY (EELS) TUĞÇE SEZGİN 20970725 HACETTEPE UNIVERSITY DEPARTMENT OF CHEMICAL ENGINEERING, SPRING 2011,APRIL,ANKARA CONTENTS
KMÜ 396 MATERIALS SCIENCE AND TECH. I PRESENTATION ELECTRON ENERGY LOSS SPECTROSCOPY (EELS) TUĞÇE SEZGİN 20970725 HACETTEPE UNIVERSITY DEPARTMENT OF CHEMICAL ENGINEERING, SPRING 2011,APRIL,ANKARA CONTENTS
MSE 321 Structural Characterization
 Auger Spectroscopy Auger Electron Spectroscopy (AES) Scanning Auger Microscopy (SAM) Incident Electron Ejected Electron Auger Electron Initial State Intermediate State Final State Physical Electronics
Chapter 12. Nanometrology. Oxford University Press All rights reserved.
 Chapter 12 Nanometrology Introduction Nanometrology is the science of measurement at the nanoscale level. Figure illustrates where nanoscale stands in relation to a meter and sub divisions of meter. Nanometrology
Energy-Filtered High-Resolution Electron Microscopy for Quantitative Solid State Structure Determination
 [J. Res. Natl. Inst. Stand. Technol. 102, 1 (1997)] Energy-Filtered High-Resolution Electron Microscopy for Quantitative Solid State Structure Determination Volume 102 Number 1 January February 1997 Z.
IMAGING DIFFRACTION SPECTROSCOPY
 TEM Techniques TEM/STEM IMAGING DIFFRACTION SPECTROSCOPY Amplitude contrast (diffracion contrast) Phase contrast (highresolution imaging) Selected area diffraction Energy dispersive X-ray spectroscopy
Everhart-Thornley detector
 SEI Detector Everhart-Thornley detector Microscope chamber wall Faraday cage Scintillator Electrons in Light pipe Photomultiplier Electrical signal out Screen Quartz window +200 V +10 kv Always contains
Gaetano L Episcopo. Scanning Electron Microscopy Focus Ion Beam and. Pulsed Plasma Deposition
 Gaetano L Episcopo Scanning Electron Microscopy Focus Ion Beam and Pulsed Plasma Deposition Hystorical background Scientific discoveries 1897: J. Thomson discovers the electron. 1924: L. de Broglie propose
Imaging Methods: Scanning Force Microscopy (SFM / AFM)
") Imaging Methods: Scanning Force Microscopy (SFM / AFM) The atomic force microscope (AFM) probes the surface of a sample with a sharp tip, a couple of microns long and often less than 100 Å in diameter.
Imaging Methods: Scanning Force Microscopy (SFM / AFM) The atomic force microscope (AFM) probes the surface of a sample with a sharp tip, a couple of microns long and often less than 100 Å in diameter.
The Use of Synchrotron Radiation in Modern Research
 The Use of Synchrotron Radiation in Modern Research Physics Chemistry Structural Biology Materials Science Geochemical and Environmental Science Atoms, molecules, liquids, solids. Electronic and geometric
Chapter 9. Electron mean free path Microscopy principles of SEM, TEM, LEEM
 Chapter 9 Electron mean free path Microscopy principles of SEM, TEM, LEEM 9.1 Electron Mean Free Path 9. Scanning Electron Microscopy (SEM) -SEM design; Secondary electron imaging; Backscattered electron
*Specifications subject to change without notice.
 The Power of STEM *Specifications subject to change without notice. No. 1301G040C 1101E010C Printed in Japan, Kp Atomic Resolution Analytical Microscope Serving Advanced Technology Atomic Resolution Analytical
Praktikum zur. Materialanalytik
 Praktikum zur Materialanalytik Energy Dispersive X-ray Spectroscopy B513 Stand: 19.10.2016 Contents 1 Introduction... 2 2. Fundamental Physics and Notation... 3 2.1. Alignments of the microscope... 3 2.2.
CBE Science of Engineering Materials. Scanning Electron Microscopy (SEM)
") CBE 30361 Science of Engineering Materials Scanning Electron Microscopy (SEM) Scale of Structure Organization Units: micrometer = 10-6 m = 1µm nanometer= 10-9 m = 1nm Angstrom = 10-10 m = 1Å A hair is
CBE 30361 Science of Engineering Materials Scanning Electron Microscopy (SEM) Scale of Structure Organization Units: micrometer = 10-6 m = 1µm nanometer= 10-9 m = 1nm Angstrom = 10-10 m = 1Å A hair is
Conventional Transmission Electron Microscopy. Introduction. Text Books. Text Books. EMSE-509 CWRU Frank Ernst
 Text Books Conventional Transmission Electron Microscopy EMSE-509 CWRU Frank Ernst D. B. Williams and C. B. Carter: Transmission Electron Microscopy, New York: Plenum Press (1996). L. Reimer: Transmission
B k k. Fig. 1: Energy-loss spectrum of BN, showing the how K-loss intensities I K (β, ) for boron and nitrogen are defined and measured.
 for boron and nitrogen are defined and measured.") The accuracy of EELS elemental analysis The procedure of EELS elemental analysis can be divided into three parts, each of which involves some approximation, with associated systematic or statistical errors.
The accuracy of EELS elemental analysis The procedure of EELS elemental analysis can be divided into three parts, each of which involves some approximation, with associated systematic or statistical errors.
Supplementary Information
 Supplementary Information Supplementary Figures Supplementary figure S1: Characterisation of the electron beam intensity profile. (a) A 3D plot of beam intensity (grey value) with position, (b) the beam
4. Inelastic Scattering
 1 4. Inelastic Scattering Some inelastic scattering processes A vast range of inelastic scattering processes can occur during illumination of a specimen with a highenergy electron beam. In principle, many
Aberration-corrected TEM studies on interface of multilayered-perovskite systems
 Aberration-corrected TEM studies on interface of multilayered-perovskite systems By Lina Gunawan (0326114) Supervisor: Dr. Gianluigi Botton November 1, 2006 MSE 702(1) Presentation Outline Literature Review
REVIEWS. Resolution and aberration correction in liquid cell transmission electron microscopy
 REVIEWS Resolution and aberration correction in liquid cell transmission electron microscopy Niels de Jonge 1,2, Lothar Houben 3,4, Rafal E. Dunin- Borkowski 3 and Frances M. Ross 5,6 * Abstract Liquid
Chapter 20: Convergent-beam diffraction Selected-area diffraction: Influence of thickness Selected-area vs. convergent-beam diffraction
 1 Chapter 0: Convergent-beam diffraction Selected-area diffraction: Influence of thickness Selected-area diffraction patterns don t generally get much better when the specimen gets thicker. Sometimes a
tip conducting surface
 PhysicsAndMathsTutor.com 1 1. The diagram shows the tip of a scanning tunnelling microscope (STM) above a conducting surface. The tip is at a potential of 1.0 V relative to the surface. If the tip is sufficiently
Electron Microprobe Analysis 1 Nilanjan Chatterjee, Ph.D. Principal Research Scientist
 12.141 Electron Microprobe Analysis 1 Nilanjan Chatterjee, Ph.D. Principal Research Scientist Massachusetts Institute of Technology Electron Microprobe Facility Department of Earth, Atmospheric and Planetary
Electron Microprobe Analysis 1 Nilanjan Chatterjee, Ph.D. Principal Research Scientist
 12.141 Electron Microprobe Analysis 1 Nilanjan Chatterjee, Ph.D. Principal Research Scientist Massachusetts Institute of Technology Electron Microprobe Facility Department of Earth, Atmospheric and Planetary
Microscopy: Principles
 Low Voltage Electron Microscopy: Principles and Applications Edited by David C. Bell Harvard University, USA and Natasha Erdman JEOL USA Inc., USA Published in association with the Royal Microscopical
object objective lens eyepiece lens
 Advancing Physics G495 June 2015 SET #1 ANSWERS Field and Particle Pictures Seeing with electrons The compound optical microscope Q1. Before attempting this question it may be helpful to review ray diagram
= 6 (1/ nm) So what is probability of finding electron tunneled into a barrier 3 ev high?
 So what is probability of finding electron tunneled into a barrier 3 ev high?") STM STM With a scanning tunneling microscope, images of surfaces with atomic resolution can be readily obtained. An STM uses quantum tunneling of electrons to map the density of electrons on the surface
STM STM With a scanning tunneling microscope, images of surfaces with atomic resolution can be readily obtained. An STM uses quantum tunneling of electrons to map the density of electrons on the surface
MEMS Metrology. Prof. Tianhong Cui ME 8254
 MEMS Metrology Prof. Tianhong Cui ME 8254 What is metrology? Metrology It is the science of weights and measures Refers primarily to the measurements of length, weight, time, etc. Mensuration- A branch
M2 TP. Low-Energy Electron Diffraction (LEED)
") M2 TP Low-Energy Electron Diffraction (LEED) Guide for report preparation I. Introduction: Elastic scattering or diffraction of electrons is the standard technique in surface science for obtaining structural
M2 TP Low-Energy Electron Diffraction (LEED) Guide for report preparation I. Introduction: Elastic scattering or diffraction of electrons is the standard technique in surface science for obtaining structural
DIFFRACTION PHYSICS THIRD REVISED EDITION JOHN M. COWLEY. Regents' Professor enzeritus Arizona State University
 DIFFRACTION PHYSICS THIRD REVISED EDITION JOHN M. COWLEY Regents' Professor enzeritus Arizona State University 1995 ELSEVIER Amsterdam Lausanne New York Oxford Shannon Tokyo CONTENTS Preface to the first
MT Electron microscopy Scanning electron microscopy and electron probe microanalysis
 MT-0.6026 Electron microscopy Scanning electron microscopy and electron probe microanalysis Eero Haimi Research Manager Outline 1. Introduction Basics of scanning electron microscopy (SEM) and electron
Lecture 5. X-ray Photoemission Spectroscopy (XPS)
") Lecture 5 X-ray Photoemission Spectroscopy (XPS) 5. Photoemission Spectroscopy (XPS) 5. Principles 5.2 Interpretation 5.3 Instrumentation 5.4 XPS vs UV Photoelectron Spectroscopy (UPS) 5.5 Auger Electron
Lecture 5 X-ray Photoemission Spectroscopy (XPS) 5. Photoemission Spectroscopy (XPS) 5. Principles 5.2 Interpretation 5.3 Instrumentation 5.4 XPS vs UV Photoelectron Spectroscopy (UPS) 5.5 Auger Electron
Chapter 10: Wave Properties of Particles
 Chapter 10: Wave Properties of Particles Particles such as electrons may demonstrate wave properties under certain conditions. The electron microscope uses these properties to produce magnified images
Techniques EDX, EELS et HAADF en TEM: possibilités d analyse et applications
 Techniques EDX, EELS et HAADF en TEM: possibilités d analyse et applications Thomas Neisius Université Paul Cézanne Plan Imaging modes HAADF Example: supported Pt nanoparticles Electron sample interaction
April 10th-12th, 2017
 Thomas LaGrange, Ph.D. Faculty Lecturer and Senior Staff Scientist Introduction: Basics of Transmission Electron Microscopy (TEM) TEM Doctoral Course MS-637 April 10th-12th, 2017 Outline 1. What is microcopy?
Scanning Electron Microscopy & Ancillary Techniques
 Scanning Electron Microscopy & Ancillary Techniques By Pablo G. Caceres-Valencia The prototype of the first Stereoscan supplied by the Cambridge Instrument Company to the dupont Company, U.S.A. (1965)
Basic structure of SEM
 Table of contents Basis structure of SEM SEM imaging modes Comparison of ordinary SEM and FESEM Electron behavior Electron matter interaction o Elastic interaction o Inelastic interaction o Interaction
6. Analytical Electron Microscopy
 Physical Principles of Electron Microscopy 6. Analytical Electron Microscopy Ray Egerton University of Alberta and National Institute of Nanotechnology Edmonton, Canada www.tem-eels.ca regerton@ualberta.ca
QUESTIONS AND ANSWERS
 QUESTIONS AND ANSWERS (1) For a ground - state neutral atom with 13 protons, describe (a) Which element this is (b) The quantum numbers, n, and l of the inner two core electrons (c) The stationary state
PRINCIPLES OF PHYSICAL OPTICS
 PRINCIPLES OF PHYSICAL OPTICS C. A. Bennett University of North Carolina At Asheville WILEY- INTERSCIENCE A JOHN WILEY & SONS, INC., PUBLICATION CONTENTS Preface 1 The Physics of Waves 1 1.1 Introduction
Experimental methods in Physics. Electron Microscopy. Basic Techniques (MEP-I) SEM, TEM
 SEM, TEM") Experimental methods in Physics Electron Microscopy Basic Techniques (MEP-I) SEM, TEM Advanced Techniques (MEP-II) HR-TEM, STEM Analytical-TEM 3D-Microscopy Spring 2012 Experimental Methods in Physics
Experimental methods in Physics Electron Microscopy Basic Techniques (MEP-I) SEM, TEM Advanced Techniques (MEP-II) HR-TEM, STEM Analytical-TEM 3D-Microscopy Spring 2012 Experimental Methods in Physics
Ecole Franco-Roumaine : Magnétisme des systèmes nanoscopiques et structures hybrides - Brasov, Modern Analytical Microscopic Tools
 1. Introduction Solid Surfaces Analysis Group, Institute of Physics, Chemnitz University of Technology, Germany 2. Limitations of Conventional Optical Microscopy 3. Electron Microscopies Transmission Electron
h p λ = mν Back to de Broglie and the electron as a wave you will learn more about this Equation in CHEM* 2060
 Back to de Broglie and the electron as a wave λ = mν h = h p you will learn more about this Equation in CHEM* 2060 We will soon see that the energies (speed for now if you like) of the electrons in the
PHI 5000 Versaprobe-II Focus X-ray Photo-electron Spectroscopy
 PHI 5000 Versaprobe-II Focus X-ray Photo-electron Spectroscopy The very basic theory of XPS XPS theroy Surface Analysis Ultra High Vacuum (UHV) XPS Theory XPS = X-ray Photo-electron Spectroscopy X-ray
QUANTUM PHYSICS. Limitation: This law holds well only for the short wavelength and not for the longer wavelength. Raleigh Jean s Law:
 Black body: A perfect black body is one which absorbs all the radiation of heat falling on it and emits all the radiation when heated in an isothermal enclosure. The heat radiation emitted by the black
Spatial Frequency and Transfer Function. columns of atoms, where the electrostatic potential is higher than in vacuum
 Image Formation Spatial Frequency and Transfer Function consider thin TEM specimen columns of atoms, where the electrostatic potential is higher than in vacuum electrons accelerate when entering the specimen
5.8 Auger Electron Spectroscopy (AES)
") 5.8 Auger Electron Spectroscopy (AES) 5.8.1 The Auger Process X-ray and high energy electron bombardment of atom can create core hole Core hole will eventually decay via either (i) photon emission (x-ray
5.8 Auger Electron Spectroscopy (AES) 5.8.1 The Auger Process X-ray and high energy electron bombardment of atom can create core hole Core hole will eventually decay via either (i) photon emission (x-ray
Surface Sensitivity & Surface Specificity
 Surface Sensitivity & Surface Specificity The problems of sensitivity and detection limits are common to all forms of spectroscopy. In its simplest form, the question of sensitivity boils down to whether
MT Electron microscopy Scanning electron microscopy and electron probe microanalysis
 MT-0.6026 Electron microscopy Scanning electron microscopy and electron probe microanalysis Eero Haimi Research Manager Outline 1. Introduction Basics of scanning electron microscopy (SEM) and electron
EELS Electron Energy Loss Spectroscopy
 EELS Electron Energy Loss Spectroscopy (Thanks to Steve Pennycook, Quan Li, Charlie Lyman, Ondre Krivenak, David Muller, David Bell, Natasha Erdman, Nestor Zaluzec and many others) Nestor Zaluzec,
Vibrational Spectroscopies. C-874 University of Delaware
 Vibrational Spectroscopies C-874 University of Delaware Vibrational Spectroscopies..everything that living things do can be understood in terms of the jigglings and wigglings of atoms.. R. P. Feymann Vibrational
Methods of surface analysis
 Methods of surface analysis Nanomaterials characterisation I RNDr. Věra Vodičková, PhD. Surface of solid matter: last monoatomic layer + absorbed monolayer physical properties are effected (crystal lattice
Astronomy 203 practice final examination
 Astronomy 203 practice final examination Fall 1999 If this were a real, in-class examination, you would be reminded here of the exam rules, which are as follows: You may consult only one page of formulas
Electron Microscopy I
 Characterization of Catalysts and Surfaces Characterization Techniques in Heterogeneous Catalysis Electron Microscopy I Introduction Properties of electrons Electron-matter interactions and their applications
Auger Electron Spectroscopy
 Auger Electron Spectroscopy Auger Electron Spectroscopy is an analytical technique that provides compositional information on the top few monolayers of material. Detect all elements above He Detection
Supplementary Materials
 Supplementary Materials Sample characterization The presence of Si-QDs is established by Transmission Electron Microscopy (TEM), by which the average QD diameter of d QD 2.2 ± 0.5 nm has been determined
Lecture 5: Characterization methods
 Lecture 5: Characterization methods X-Ray techniques Single crystal X-Ray Diffration (XRD) Powder XRD Thin film X-Ray Reflection (XRR) Microscopic methods Optical microscopy Electron microscopies (SEM,
Atomic Resolution Interfacial Structure of Lead-free Ferroelectric
 Atomic Resolution Interfacial Structure of Lead-free Ferroelectric K 0.5 Na 0.5 NbO 3 Thin films Deposited on SrTiO 3 Chao Li 1, Lingyan Wang 1*, Zhao Wang 2, Yaodong Yang 2, Wei Ren 1 and Guang Yang 1
Supporting Information
 Supporting Information Interaction between Single Noble Metal Atom and Graphene Edge: A Study via Aberration-corrected Transmission Electron Microscopy METHODS Preparing Monolayer Graphene with Free Edges.
X-Ray Emission and Absorption
 X-Ray Emission and Absorption Author: Mike Nill Alex Bryant February 6, 20 Abstract X-rays were produced by two bench-top diffractometers using a copper target. Various nickel filters were placed in front
Nanoelectronics 09. Atsufumi Hirohata Department of Electronics. Quick Review over the Last Lecture
 Nanoelectronics 09 Atsufumi Hirohata Department of Electronics 13:00 Monday, 12/February/2018 (P/T 006) Quick Review over the Last Lecture ( Field effect transistor (FET) ): ( Drain ) current increases
EE 527 MICROFABRICATION. Lecture 5 Tai-Chang Chen University of Washington
 EE 527 MICROFABRICATION Lecture 5 Tai-Chang Chen University of Washington MICROSCOPY AND VISUALIZATION Electron microscope, transmission electron microscope Resolution: atomic imaging Use: lattice spacing.
Practical course in scanning electron microscopy
 Practical course in scanning electron microscopy Fortgeschrittenen Praktikum an der Technischen Universität München Wintersemester 2017/2018 Table of contents 1. Introduction 3 2. Formation of an electron
Chemistry Instrumental Analysis Lecture 19 Chapter 12. Chem 4631
 Chemistry 4631 Instrumental Analysis Lecture 19 Chapter 12 There are three major techniques used for elemental analysis: Optical spectrometry Mass spectrometry X-ray spectrometry X-ray Techniques include:
Matter Waves. Chapter 5
 Matter Waves Chapter 5 De Broglie pilot waves Electromagnetic waves are associated with quanta - particles called photons. Turning this fact on its head, Louis de Broglie guessed : Matter particles have
Structure analysis: Electron diffraction LEED TEM RHEED
 Structure analysis: Electron diffraction LEED: Low Energy Electron Diffraction SPA-LEED: Spot Profile Analysis Low Energy Electron diffraction RHEED: Reflection High Energy Electron Diffraction TEM: Transmission
Supplementary Figure 1: ADF images and profiles for several types of atomic chains encapsulated in DWNTs. (a d) ADF images of NaI, CsF, CsCl, and CsI
 ADF images of NaI, CsF, CsCl, and CsI") Supplementary Figure 1: ADF images and profiles for several types of atomic chains encapsulated in DWNTs. (a d) ADF images of NaI, CsF, CsCl, and CsI atomic chains encapsulated in DWNTs, respectively.
Supplementary Figure 1: ADF images and profiles for several types of atomic chains encapsulated in DWNTs. (a d) ADF images of NaI, CsF, CsCl, and CsI atomic chains encapsulated in DWNTs, respectively.
Transmission Electron Microscope. Experimental Instruction
 Transmission Electron Microscope Experimental Instruction In advanced practical course [F-Praktikum] Date: April 2017 Contents 1 Task 3 2 Theoretical Basics 3 2.1 Bragg Diffraction......................................
X-Ray Diffraction as a key to the Structure of Materials Interpretation of scattering patterns in real and reciprocal space
 X-Ray Diffraction as a key to the Structure of Materials Interpretation of scattering patterns in real and reciprocal space Tobias U. Schülli, X-ray nanoprobe group ESRF OUTLINE 1 Internal structure of
Auger Electron Spectroscopy (AES) Prof. Paul K. Chu
 Prof. Paul K. Chu") Auger Electron Spectroscopy (AES) Prof. Paul K. Chu Auger Electron Spectroscopy Introduction Principles Instrumentation Qualitative analysis Quantitative analysis Depth profiling Mapping Examples The Auger
Auger Electron Spectroscopy (AES) Prof. Paul K. Chu Auger Electron Spectroscopy Introduction Principles Instrumentation Qualitative analysis Quantitative analysis Depth profiling Mapping Examples The Auger
Electron-Matter Interactions
 Electron-Matter Interactions examples of typical EM studies properties of electrons elastic electron-matter interactions scattering processes; coherent and incoherent image formation; chemical contrast;
Applications of XPS, AES, and TOF-SIMS
 Applications of XPS, AES, and TOF-SIMS Scott R. Bryan Physical Electronics 1 Materials Characterization Techniques Microscopy Optical Microscope SEM TEM STM SPM AFM Spectroscopy Energy Dispersive X-ray
Good Diffraction Practice Webinar Series
 Good Diffraction Practice Webinar Series High Resolution X-ray Diffractometry (1) Mar 24, 2011 www.bruker-webinars.com Welcome Heiko Ress Global Marketing Manager Bruker AXS Inc. Madison, Wisconsin, USA
EUV Reflectivity measurements on Acktar Sample Magic Black
 Report EUV Reflectivity measurements on Acktar Sample Magic Black S. Döring, Dr. K. Mann Laser-Laboratorium Göttingen e.v. October 28, 2011 Contents 1 Introduction 3 2 Setup 3 3 Measurements 4 4 Conclusion
Numerical Methods in TEM Convolution and Deconvolution
 Numerical Methods in TEM Convolution and Deconvolution Christoph T. Koch Max Planck Institut für Metallforschung http://hrem.mpi-stuttgart.mpg.de/koch/vorlesung Applications of Convolution in TEM Smoothing
CHEM*3440. X-Ray Energies. Bremsstrahlung Radiation. X-ray Line Spectra. Chemical Instrumentation. X-Ray Spectroscopy. Topic 13
 X-Ray Energies very short wavelength radiation 0.1Å to 10 nm (100 Å) CHEM*3440 Chemical Instrumentation Topic 13 X-Ray Spectroscopy Visible - Ultraviolet (UV) - Vacuum UV (VUV) - Extreme UV (XUV) - Soft
Transmission Electron Microscopy. Part #2 High Resolution Imaging XEDS EELS spectroscopies Aberration corrected TEM
 Transmission Electron Microscopy Part #2 High Resolution Imaging XEDS EELS spectroscopies Aberration corrected TEM Nicolas Menguy Institut de Minéralogie, de Physique des Matériaux et de Cosmochimie Part
Introduction to XAFS. Grant Bunker Associate Professor, Physics Illinois Institute of Technology. Revised 4/11/97
 Introduction to XAFS Grant Bunker Associate Professor, Physics Illinois Institute of Technology Revised 4/11/97 2 tutorial.nb Outline Overview of Tutorial 1: Overview of XAFS 2: Basic Experimental design
Structure Report for J. Reibenspies
 X-ray Diffraction Laboratory Center for Chemical Characterization and Analysis Department of Chemistry Texas A & M University Structure Report for J. Reibenspies Project Name: Sucrose Date: January 29,
Setting The motor that rotates the sample about an axis normal to the diffraction plane is called (or ).
.") X-Ray Diffraction X-ray diffraction geometry A simple X-ray diffraction (XRD) experiment might be set up as shown below. We need a parallel X-ray source, which is usually an X-ray tube in a fixed position
X-Ray Diffraction X-ray diffraction geometry A simple X-ray diffraction (XRD) experiment might be set up as shown below. We need a parallel X-ray source, which is usually an X-ray tube in a fixed position
CHEM-E5225 :Electron Microscopy. Diffraction 1
 CHEM-E5225 :Electron Microscopy Diffraction 1 2018-10-15 Yanling Ge Text book: Transmission electron microscopy by David B Williams & C. Barry Carter. 2009, Springer Outline Diffraction in TEM Thinking
CHEM-E5225 :Electron Microscopy Imaging
 CHEM-E5225 :Electron Microscopy Imaging 2016.10 Yanling Ge Outline Planar Defects Image strain field WBDF microscopy HRTEM information theory Discuss of question homework? Planar Defects - Internal Interface
Characterisation of Catalysts Using Secondary and Backscattered Electron In-lens Detectors
 Platinum Metals Rev., 2014, 58, (2), 106 110 FINAL ANALYSIS Characterisation of Catalysts Using Secondary and Backscattered Electron In-lens Detectors Heterogeneous catalysis often involves the use of
X-ray practical: Crystallography
 X-ray practical: Crystallography Aim: To familiarise oneself with the operation of Tex-X-Ometer spectrometer and to use it to determine the lattice spacing in NaCl and LiF single crystals. Background:
Understanding X-rays: The electromagnetic spectrum
 Understanding X-rays: The electromagnetic spectrum 1 ULa 13.61 kev 0.09 nm BeKa 0.11 kev 11.27 nm E = hn = h c l where, E : energy, h : Planck's constant, n : frequency c : speed of light in vacuum, l
Electron Rutherford Backscattering, a versatile tool for the study of thin films
 Electron Rutherford Backscattering, a versatile tool for the study of thin films Maarten Vos Research School of Physics and Engineering Australian National University Canberra Australia Acknowledgements:
Fundamentals of Nanoscale Film Analysis
 Fundamentals of Nanoscale Film Analysis Terry L. Alford Arizona State University Tempe, AZ, USA Leonard C. Feldman Vanderbilt University Nashville, TN, USA James W. Mayer Arizona State University Tempe,
Revision Guide. Chapter 7 Quantum Behaviour
 Revision Guide Chapter 7 Quantum Behaviour Contents CONTENTS... 2 REVISION CHECKLIST... 3 REVISION NOTES... 4 QUANTUM BEHAVIOUR... 4 Random arrival of photons... 4 Photoelectric effect... 5 PHASE AN PHASORS...