TRANSPOSABLE ELEMENTS DYNAMICS IN TAXA WITH DIFFERENT REPRODUCTIVE STRATEGIES OR SPECIATION RATE
|
|
|
- Maryann Greer
- 5 years ago
- Views:
Transcription
1 Alma Mater Studiorum Università di Bologna DOTTORATO DI RICERCA IN BIODIVERSITÀ ED EVOLUZIONE Ciclo XXV Settore scientifico-disciplinare di afferenza: BIO-05 Zoologia Settore concorsuale di afferenza: 05/B1 Zoologia e Antropologia TRANSPOSABLE ELEMENTS DYNAMICS IN TAXA WITH DIFFERENT REPRODUCTIVE STRATEGIES OR SPECIATION RATE Presentata da: Dr. Marco Ricci Coordinatore Dottorato Relatore Prof. Barbara Mantovani Prof. Barbara Mantovani Esame finale anno 2014
2
3 INDEX Chapter 1 INTRODUCTION Transposable Elements Relationship among TE dynamics and reproductive strategies A new model for the study of TE dynamics: the genus Bacillus Relationship between TE dynamics and speciation Thesis aims 11 Chapter 2 RANDOM DNA LIBRARIES FROM THREE SPECIES OF THE GENUS BACILLUS (INSECTA: PHASMIDA): REPETITIVE DNA CHARACTERIZATION AND FIRST OBSERVATION OF POLYNEOPTERAN MITEs 12 Chapter 3 TRANSPOSABLE ELMENTS ANALISYS IN TAXA WITH DIFFERENT SPECIATION RATE 3.1 Materials and methods Taxa speciation rate evaluation Dataset construction Proxy evaluation for generation time TE insertion density evaluation Average density of TE insertions Transposable Elements percentage evaluation Results Discussion 58 Chapter 4 CONCLUSIONS 66 References 69
4 Chapter1 INTRODUCTION 1.1 Transposable Elements Most part of eukaryotic genomes is composed by repetitive sequences: these can be divided in tandem and interspersed repeats. The latter are in most part Transposable Elements (TEs). These genetic elements have the skill to move along the genome (McClintock 1950). Over the past 60 years, research on TEs showed their tremendous biodiversity, mainly due to the different transposition mechanisms, leading to TEs ordering into families, superfamilies and classes. Class I is formed by retrotransposons; these are transposable elements moving through the element transcription, reverse transcription and insertion of the cdna in the genome. Such replicative cycle is carried out by recruiting RNA polymerase of the host, while the reverse transcription is performed by enzymes encoded by the retrotransposons. Retrotransposons are divided into two superfamilies, LTR and non-ltr elements. LTR retrotransposons are strongly related to retroviruses, the main difference between them being the presence of a functioning ENV protein that enable the formation of the envelope in the cell membrane of the host and the resulting spread of the virus in the external environment. LTR retrotransposons comprise two regions called Long Terminal Repeats, such sequences regulating the activation and termination of transcription and the integration of the cdna in the host genome. Among the two LTRs they contain ORFs for GAG proteins involved in the formation of retroviral particles and for POL which encodes an aspartic protease, reverse transcriptase proteinase (AP), reverse transcriptase, RNase H and DDE integrase. 4
5 The LTR superfamily comprises two families of non-autonomous retrotransposons The LArge Retrotransposon Derivatives (LARDs), Terminal Repeat retrotransposons In Miniature (TRIMs). (Reviewed by Wicker et al. 2007). The non-ltr superfamily is divided between autonomous and non-autonomous elements. Autonomous non-ltr retrotransposons are present in all eukaryotes and are probably the oldest retrotransposable elements present in animal genomes. Phylogenetic analysis reveal that all non-ltr families date to the Cambrian period (Harmit et al. 1999). All families are provided with a POL-like region coding for reverse transcriptase and endonuclease. Unlike LTR retroptransposons, non-ltr elements can use the host DNA repair enzymes to complete their replication cycle. Non autonomous non-ltr retrotransposons are segments provided with a transcriptional promoter at the 5 end and a sequence for recruitment of reverse transcriptase. The enzymes for reverse transcription are provided by a non-ltr autonomous retrotransposon which in practice are parasitized. Two families of non autonomous non-ltr retrotransposon are currently known: Short INterspersed Elements (SINEs) and Sine Vntr Alu (SVA) (reviewed by Rebollo et al. 2010). Class 2 includes all the transposable elements that don t perform the reverse transcription in their replicative cycle. This class consists mainly of transposons that move through a cut and paste mechanism and are characterized by Terminal Inverted Repeats (TIRs) of bps flanking the sequence encoding transposase. This enzyme cuts the element at the level of TIRs, the subsequent insertion occurring in a new target site of the host genome. Miniature inverted repeated elements (MITEs) are a class I of non-autonomous elements composed of two TIRs, flanking a short sequence devoid of an ORF. These TEs are trans-activated by transposases belonging to autonomous elements which recognize TIRs as triggers of transposition. There are two TE families of Class II that use an alternative apparatus for replication: the Helitron family, coding for the enzyme helicase which replicates DNA by a rolling circle mechanism and the Polinton elements, the TEs of greatest length yet discovered. Their size can be up to 20 kb. They are the only transposons encoding a DNA polymerase (Pritham et al. 2007). The replicative mechanism suggested provides the excision of a single strand followed by extra chromosomal 5
6 replication and subsequent integration in a new site. Forty years ago Susumu Ohno coined the term Junk DNA to define the non-coding part of eukaryotic genomes. Among the various types of Junk DNA, transposons were defined as selfish DNA meaning that they were not specifically contributing to the phenotype (Orgel and Crick 1980). Currently available data indicate that TEs are involved in a big amount of aspects of eukaryotic organisms. The amount of TE is directly correlated with the genome size (Kidwell 2002). They are involved in the network of gene regulation, as the SINE's derived micro RNAs (Ponicsan et al. 2010). Surprising discoveries have recently been made about the involvement of retrotransposons in developmental biology, as the mobilization of retrotransposons L1 during development of the human brain to generate somatic mosaicism in the brain and increase intra individual neuronal variability (Thomas and Muotri 2012; Singer et al. 2010). The most important aspect of the study of TEs, is their relationship with the evolution of genomes genomes and genes. RAG1/RAG2 recombinase genes are responsible for the hipermutation of V(D)J loci. This is the central mechanism for the specific acquired immunity in vertebrates. The catalytic process of cut and paste of RAG1/RAG2 complex is probably derived from a transposase belonging to an ancient class II TE (Fugmann 2010). Many other TE mediated mechanisms are known, such as exon shuffling (Moran et al. 1999), unequal crossover, gene duplications (Muotri et al. 2007), TE exonizations (Schmitz and Brosius 2011), inversions (Lee et al. 2008). These data allow us to look at TEs like the main cause of mutations and increase of complexity of eukaryotic genomes. The relationship between TE and host genome is therefore dual. Even if nowadays the role of simple genomic parasite is ruled out, a deleterious effect on the genome is widely documented. In Homo sapiens the disruption of gene function by TE in the germ line results in genetic diseases as Neurofibromatosis, Choroideremia, Cholinesterase deficiency, Apert syndrome, Dent s disease, β-thalassemia, and Walker-Warburg syndrome. In addition, TE insertions in somatic tissues have been correlated with various type of tumors as the disruption of BRCA1 and BRCA2 genes in breast cancer and APC in colon cancer (Belancio et al ). 6
7 1.2 Relationship among TE dynamics and reproductive strategies The main theory tells that in bisexual taxa TEs proliferation is tolerated because of the possibility to counteract their accumulation through recombination, while unisexuals must repress TEs activity to avoid their indiscriminate accumulation leading towards extinction. Computer simulations demonstrated that small unisexual taxa populations may go extinct by a Muller's ratchet-like mechanisms (Dolgin and Charlesworth 2006). To test what happens in nature, evolutionary biology needs suitable biological models. In rotifers, the species of the class Bdelloidea are known to be ancient asexuals. The comparisons with their sister clade Monogononta showed a reduced activity of class I TEs (Arkipova and Meselson 2005). The same trend was observed in the crustacean Daphnia pulex (Branchiopoda Cladocera), the species comprising both cyclic and obligatory parthenogenetic populations. Transposon display assays showed that cyclically parthenogenetic populations have more class II TEs than obligate parthenogens (Shaak et al. 2010). Leptopilina clavipes (Insecta Hymenoptera) is a parasitoid wasp that present gonochoric reproduction and a lineage of the same species that was rendered unisexual by Wolbachia-induced parthenogenesis. The analyses performed showed higher amount of class II and of some families of LTR and nonltr retrotransposons in the unisexual lineage differently from what expected and observed in other taxa. (Kraaijeveld et al. 2012). To clarify this aspect further animal models are needed. 7
8 1.3 A new model for the study of TE dynamics: the genus Bacillus The animal kingdom comprises species so far described, the 75% of which belongs to the Class Insecta. Actually, insects are the animal taxon under the biggest radiation ( ). Phasmida is one of the 11 orders belonging Polyneoptera. It is composed by 3000 species diffused in all continents. Phasmida are characterized by cryptic mimetism, leading to they being generally known as leaf and stick insects. Among stick insects, the genus Bacillus is distributed in the Mediterranean area and shows one of the best known examples of reticulated evolution (see Fig 1.1). It comprises three parental species (Bacillus grandii gonochoric; Bacillus rossius - facultative parthenogen; Bacillus atticus - obligate parthenogen). These three species gave origin to a variegated group of hybrids: the diploid parthenogen Bacillus whitei (Bacillus rossius /Bacillus grandii grandii), the triploid parthenogen Bacillus lynceorum (Bacillus rossius / Bacillus grandii grandii / Bacillus atticus). The Sicilian species of this taxon have allowed the discovery of two additional reproductive strategies: hybridogenesis and androgenesis. In the first instace an hybrid Bacillus rossius /Bacillus grandii female transmits to the progeny exclusively the Bacillus rossius haploset through the elimination of paternal chromosomes during oogenesis and spermatogenesis. The hybrid condition is restored trough fertilization by the syntopic Bacillus grandii male. The second one consists in the fertilization of a Bacillus rossius egg devoid of the maternal haploset by two sperms of a Bacillus grandii male. The progeny is therefore given by a nuclear Bacillus grandii and a mitochondrial Bacillus rossius genome. (Mantovani and Scali 1992; Mantovani et al. 1999; Scali et al. 2003). 8
9 Figure 1.1 Scheme of reticulated evolution in Bacillus taxa. Asterisks indicate B. rossius mtdna haplotype, sketched arrows indicate movement of Bacillus rossius mtdna during hybridogenesis and androgenesis (from Scali et al. 2003). 1.4 Relationship between TE dynamics and speciation The possibility that TE activity is a facilitating factor for speciation is an issue that has developed considerably in recent years. To face this question it is important to make a big assumption: the number of living species in a taxon must reflect the effective rate of speciation. So in their recent history, ancient taxa with fewer species should have experienced a reduced speciation rate with respect to the rate of extinction. Starting from this assumption, some authors have developed different models of TE-related speciation. In recent years, many authors are trying to formulate a model in this regard. The TE-Trust hypothesis suggests that TEs promote the origin of new lineages and drive lineage divergence through the engineering of specific traits (Oliver and Greene 2011). The Carrier Subpopulation Hypothesis proposes that the origin and fixation of new TE families are facilitated by genetic drift derived from the formation of small subpopulations. The higher rate of transposition of new families increases the probability of reproductive isolation due to genetic 9
10 diversification (Jurka et al. 2011). One of the most intriguing aspects of this research is the possibility that the short periods of TE-proliferation coincide with short periods of morphological change and speciation predicted by the theory of punctuated equilibria (Eldredge and Gould 1977). Up to now we know that physiological stresses can cause epigenetic reprogramming. This implicates that the usual epigenetic silencing of TEs can be disrupted increasing TEs expression. The higher mutation rate caused by a TE-burst could lead a population to fast speciation events and to the reaching of new adaptive peaks: this theory is called Epi-transposon hypothesis (Zeh et al. 2009). In this kind of investigations, one of the main problems to solve is to determine the exact timing of TE burst and species diversification (Rebollo et al. 2010). The most used approach to solve this problem is to relate a certain taxon specific TE with the age of the taxon itself and then for each family the age is refined calculating the substitution rate based on the average percentage divergence of individual copies to their consensus. (Bailey et al.2003, Pace and Fechotte 2007, Ray et al. 2008). The consequence hypothesized for the lacking of a suitable repertoire of TEs is the stasis of the taxon with its total extinction or the survival of living fossils (Oliver and Greene 2011). 10
11 1.5 Thesis aims In the light of the above reported literature, my main interests during the PhD research period were: 1) to verify if there are differences in the dynamics of transposable elements and repated sequences in general in the unisexual taxon Bacillus atticus respect to the gonochoric Bacillus grandii and gonochoric population of Bacillus rossius through the analyses of genomic random libraries. These aspects led to the publication Random DNA libraries from three species of the stick-insects Bacillus genus (Insecta: Phasmida): repetitive DNA characterization and first observation of polyneopteran MITEs and it represents Chapter 2. 2) To evaluate the possibility that Transposable Elements dynamics affects the rate of speciation I designed an evolutionary framework that allows comparisons between taxa with different rates of speciation. These aspects will be dealt in Chapter 3. I developed this part of my PhD thesis through the collaboration of the Equipe Eléments transposables, Evolution, Populations Leaded by Cristina Vieirà at the LBBE Universitè Lyon-1 France. 11
12 Chapter 2 RANDOM DNA LIBRARIES FROM THREE SPECIES OF THE GENUS BACILLUS (INSECTA: PHASMIDA): REPETITIVE DNA CHARACTERIZATION AND FIRST OBSERVATION OF POLYNEOPTERAN MITEs 12
13 13
14 14
15 15
16 16


17 17
18 18
19 19
20 Chapter 3 TRANSPOSABLE ELMENTS ANALISYS IN TAXA WITH DIFFERENT SPECIATION RATE 3.1 Materials and methods Taxa speciation rate evaluation I assume that the species richness currently observable in a taxon should represent the effective rate of speciation. Using the phylogenetic tree of mammals produced by Meredith et al. (2011; Fig 3.1) all the families containing the species analyzed by Jerzy Jurka (Jurka et al. 2011) was taken in account. Then, the families with different rate of speciation belonging to the same order were chosen; in this way the distance between the species is reduced to a minimum and the data are collected for genomes with a similar history. If family one has a lower number of species and an older age with respect to family two, the rate of speciation of taxon one is lower than taxon two (Fig 3.2). Data on the number of known living species for each taxon were collected from Catalogue of Life ( And Taxonomy Browser ( 20
21 3.1.2 Dataset construction I exploited the data produced by Jurka et al. (2011). and is analyzed the content of transposable element of 31 mammal species for which whole genomes are sequenced. Species are listed in table 3.1. For each species Jurka showed both the total number of families and the total number of Transposable Elements with a divergence from their consensus sequences lower then 1%. Then He repeated the analysis with Transposable Elements with a divergence from their consensus sequences lower then 5%. From now on I will indicate the two groups of Trasposable elements as 1% Dataset and 5% Dataset. Analyzing the Mammalia phylogenetic tree of Meredith et al. 2011, using the evolutionary framework described in paragraph 3.1.1, I made 19 pairs of species using the dataset of Table 3.1. Each pair is composed of species that belong to different families of the same order. Species are listed indicating first the one with the lower rate of speciation followed by the species belonging to the family with the higher rate of speciation. From this dataset, 19 species pairs were considered for the intraorder comparisons; these are with the species with lower rate of speciation listed as first: Order Insectivora: Erinaceus europaeus-sorex araneus; Order Carnivora: Canis lupus-felis catus; Order Cetartyodactyla: Lama pacos-bos taurus; Order Rodentia: Dipodomys ordii-mus musculus; Spermophilus tridecemlineatus-mus musculus; Dipodomys ordii-rattus norvegicus; Spermophilus tridecemlineatus-rattus norvegicus; Order Primates: Tarsius syrichta-macaca mulatta; Tarsius syrichta-homo sapiens; Tarsius syrichta-pan troglodites; Tarsius syrichta-callithrix jacchus; Tarsius syrichta-microcebus murinus; Tarsius syrichta-otolemur garnettii; Microcebus murinus- 21
22 Macaca mulatta; Microcebus murinus-callithrix jacchus; Otolemur garnettii-macaca mulatta; Otolemur garnettii-callithrix jacchus. Observing the phylogeny of the entire class Mammalia (Figure 3.1), the superorders Laurasiatheria and Euarchontoglires have been formed more recently and have a higher number of species than Xenartra and Afrotheria. I therefore performed a large scale analysis by splitting the 28 species of Placentalia available from the dataset analyzed by Jerzy Jurka in their four superorders: Laurasiantheria-Bos taurus, Canis lupus familiaris, Equus caballus, Erinaceus europaeus, Felis catus, Lama pacos, Myotis lucifugus, Pteropus vampyrus, Sorex araneus; Euarchontoglires- Callithrix jacchus, Cavia porcellus, Dipodomys ordii, Homo sapiens, Macaca mulatta, Mus musculus, Otolemur garnettii, Ochotona princeps, Orictolagus cuniculus, Microcebus murius, Pan troglodites, Rattus norvegicus, Spermophilus tridecemlineatus, Tarsius syrichta; Xenarthra-Choloepus ofmanni, Dasypus novemcinctus; Afrotheria-Echinops telfair, Loxodonta africana, Procavia capensis; The comparisons are (with the superorder with lower rate of speciation listed as first): Xenarthra-Laurasiatheria, Xenarthra-Euarchontoglires, Afrotheria-Laurasiateria, Afrotheria- Euarchontoglires. Among the 31 species of mammals availables from the dataset produced by Jurka et al. (2011) I selected seven species of which I have downloaded the genome and did the analysis of the total content of TE through Repeat Masker. This will allow us to repeat the comparison taking into account also the oldest insertions. The species selected are: the pair Lama pacos-bos taurus for the superorder Laurasiatheria and the pair Dipodomys ordii-rattus norvegicus for the superorder Euarchontoglires. I decided to repeat this analysis comparing three species belonging to 22
23 different superorders, in order to observe the dynamics among more distant genomes. The taxa are listed by increasing rate of speciation: Ornitoryncus anatinus (order Monotremata), Dasypus novemcinctus (order Cingulata), Myotis lucifugus (order Chiroptera). The analysis of total TE fraction was extended outside mammal class. Four species of the class Aves of which: two with lower rate of speciation-gallus gallus and Meleagris gallopavo (order Galliformes) that list 219 species, two with a higher rate of speciation-geospiza fortis and Taeniopygia guttata (order Passeriformes) that lists 5828 species, Two species of Osteichthyes among them the well known living fossil Latimeria chalumnae (Sarcopterygii) that list eight species and Danio rerio (Actinopterygii) that lists Sarcopterygii have a lower rate of speciation with respect to Actinopterygii. The evolutionary distance between the two lineages overcome the 420 Mya. The analysis was finally extended to the class Insecta with the selection of a pair of species of the genus Drosophila: Drosophila virilis and the Hawaiian Drosophila grimshawii. I classified Hawaiian species as a group with a higher rate of speciation respect the north American group to which Drosophila virilis belongs considering that it had a radiation of about 1000 species becoming from a common ancestor that colonized the islands about 25 Mya ago (O Grady et al. 2011). 23
24 3.1.3 Proxy evaluation for generation time To verify the possibility that species with short generation time and consequent high population size are positive correlated with the rate of speciation, I suggest an indicative value. The parameter is considered as proxy for generation time. It is calculated suming up the months of gestation and the months needed to reach the sexual maturity from data available in The Animal Diversity Web database ( This parameter was applied in the 19 intra-order comparisons of mammals listed in paragraph TE insertion density evaluation Exploiting data produced by Jurka on the 31 mammal genomes (Jurka et al. 2011) the following formulawas applied: DI = NI/GS where: DI = TE insertion Density, NI = Number of insertions in the genome, GS = Genome Size in gigabases. This calculation was performed for the 1% and the 5% dataset. The insertions density values in one Gigabase will be defined with: ins/gb Average density of TE insertions The average density of TE insertions for 1% and 5% dataset from their consensus sequence was analyzed in Laurasiatheria, Euarchontoglires, Xenartra and Afrotheria comparing them in the light of their speciation rate with in the following four comparisons: Laurasiatheria-Xenartra, Laurasiatheria-Afrotheria, Euarchontoglires-Xenartra, Euarchontoglires-Afrotheria. Statistical validation was carried out calculating the 95% confidence interval. 24
25 3.1.6 Transposable Elements percentage evaluation Computational searches were carried out from September 2012 through February 2013 against 16 animal genomes on data deposited at NCBI ( at the LBBE Universitè Lyon-1 in collaboration with the equipe Transposable Element Evolution Population leaded by Cristina Vieirà. The GenBank accession numbers are: Rattus norvegicus: AABR , Dipodomis ordii: ABRO , Vicugna Ictidomys tridecemlineatus:agtp , pacos:abrr , novemcinctus:aagv , fortis:akzb , gallopavo:addd , Myotis Ornithorhynchus Taeniopygia Gallus gallus: Bos taurus:aafc , lucifugus:aape , Dasipus anatinus:aapn , Geospiza guttata:abqf , AADN , Latimeria Meleagris chalumnae: AFYH , Danio rerio:cabz , Drosophila virilis:aani , Drosophila grimshawii:aapt Whole genome were analyzed through Repeat masker (Smit et al. 1998) using the library of the subphylum Vertebrata for mammals, birds and fishes, and of the phylum Arthropoda for Drosophila virilis and Drosophila grimshawii. The percentage of total Transposable elements in bps was evaluated summing up the percentages of single superfamilies: autonomous non-ltr retrotransposons, SINEs, LTR retrotransposon and DNA transposable elements. 25

26 Figure

27 Phylogeny of the class Mammalia from Meredith et al. (2011) 27
28 figure 3.2. Exemplification of taxa with different rate of speciation: age of taxon 1 > age of taxon 2; number of species of taxon 1 < number of species of taxon 2. proxy for generation time TE Families from 5% dataset TE Families from 1% dataset DI from 5% dataset DI from 1% dataset SPECIES FAMILY FAMILY n species Bos taurus Bovidae Canis lupus familiaris Canidae Callithrix jacchus Cebidae Cavia porcellus Cavidae 14 4, Choloepus ofmanni Bradipodidae Dasypus novemcinctus Dasipododae Dipodomys ordii Heteromidae Echinops telfair 30 2, Tenrecidae 28
29 Equus caballus Equidae 9 42, Erinaceus europaeus Erinaceidae 24 9, Felis catus Felidae Homo sapiens Hominidae Lama pacos Camelidae 6 29, Loxodonta africana Elefantidae Macaca mulatta Cercopitecidae Macropus eugenii Macropododae 65 16, Otolemur garnettii Galagidae 15 10, Monodelphis domestica Didelphidae 87 4, Mus musculus Muridae , Myotis lucifugus Vespertilionidae 320 8, Ochotona princeps Ochotonidae 30 11, Orictolagus cuniculus Leporidae 61 17, Ornitoryncus anatinus Ornitorincidae 1 21,
30 Microcebus murius Cheirogaleidae 34 24, Pan troglodites Hominidae 5 163, Procavia capensis Procavidae Pteropus vampyrus Pteropodidae , Rattus norvegicus Muridae , Sorex araneus Soricidae , Spermophilus tridecemlineatus Sciuridae Tarsius syrichta Tarsiidae Table 3.1. Total genomic data of mammal species analyzed: TE Families from 5% dataset and 1% dataset = total number of families of transposable elements deviating <5% and 1% from their consensus sequences. DI from 5% dataset and 1% dataset = density of insertion of transposable elements deviating <5% and 1% from their consensus sequences. 30
31 3.2 Results The first parameter considered is the proxy for generation time. Ten out of 19 comparisons do not follow the expected trend (see fig 3.3); then in our species sample the generation time should not be strictly correlated with the rate of speciation. The 19 comparisons among the mammalian species selected were repeated for the number of families of TE belonging to 5% dataset. In this way we tested the species with the parameter suggested by Jerzy Jurka in the Carrier Subpopulation Hypothesis. Five comparisons out of 19 don't confirm the expected trend: the Insectivora Erinaceus europaeus-sorex araneus and four pairs within the order Primates Tarsius syrichta-callithrix jacchus, Tarsius syrichta-otolemur garnettii, Microcebus murinus-callithrix jacchus and Otolemur garnettii-callithrix jacchus (Figure 3.4). 31
32 Figure 3.3. Comparison of proxy for generation time 19 mammal's pairs selected. X axis: blue bars; species of the family with lower rate of speciation, red bars species of the family with higher rate of speciation. Y axis proxy for generation time in months. Figure 3.4. Comparison of number of families of TE of 19 mammal's pairs selected. X axis: blue bars; species from taxa with lower rate of speciation, red bars; species from taxa with higher rate of speciation. Y axis: number of families of TE belonging to 5% dataset. 32
33 Figure 3.5. Comparison of number of families of TE of 19 mammal's pairs selected. X axis: blue bars; species from taxa with lower rate of speciation, red bars; species from taxa with higher rate of speciation. Y axis: number of families of TE belonging to the 1% dataset. 33
34 The comparison was repeated for families belonging to the 1% dataset (See Figure 3.5). It is possible to observe that five out of 19 comparisons show more TE families in the taxon with lower rate of speciation; in the comparison Tarsius syrichta-otolemur garnettii both species contain two families. On the whole this parameter appears to be less related with the rate of speciation considering the addition of Carnivora. Indeed Canis lupus familiaris contains one more family than Felis catus. Figure 3.6. Comparison of density of insertion of TE of 19 mammal's pairs selected. X axis: blue bars species from taxa with minor rate of speciation, red bars; species from taxa with higher rate of speciation. Y axis: inserctions for Gigabase of TE belonging to the 5% dataset. 34
35 Looking at the comparisons among TE insertion densities belonging to the 5% dataset it appears that the pair belonging to the order Insectivora, four pairs of the order Primates and two in the order Rodentia do not follow the expected trend (see Fig. 3.6 ). The last parameter considered is the density of insertions of elements belonging to the 1% dataset. This parameter showed the most statistically significant relation between TE content and rate of speciation. The only data that do not follow the expected trend are represented by the pair of Insectivora species Erinaceus europaeussorex araneus and by the Primates Microcebus murinus-callithrix jacchus and Otolomer garnettiicallithrix jacchus (see figure 3.7). These three exceptions appear in all the previous analyses (see Fig.3.6,3.5,3.4). 35
36 Figure 3.7. Comparison of density of insertion of TE of 19 mammal's pairs selected. X axis: blue bars; species from taxa with minor rate of speciation, red bars; species from taxa with higher rate of speciation. Y axis: inserctions for Gigabase of TE belonging to the 1% dataset. PARAMETER Proxy for generation time TE_families_5% TE_families_1% W P ,4 0,01 0,01 DI_5% 47 0,05 DI_1% 18 0,01 36
37 Table 3.3. Wilcoxon test for not normally distributed five parameters. W value = calculated values for the each one of the five analyzed parameters. The lower P levels to find statistically significant differences within each parameter are displayed. P values corresponds with two tailed significance level. Values calculated for all parameters analyzed are not normally distributed then the validation was carried out with the non parametric test of Wilcoxon. Considering the 19 pairs of species analyzed, I can state that the proxy for generation time does not have any relation with the rate of speciation while all parameters connected to Transposable Elements display significant differences between the number of pairs that follows the expected trend and the others. The density of insertions of Tranposable Elements belonging to the 5% dataset is related to the rate of speciation with a significance of 95%, for the other three parameters the significance is of 99%. The parameters considered above relate only to recently mobilized TE. Two pairs of species were selected among the 19 previously analyzed and their TE total content in bps was calculated. Fig 3.8 shows an example of how the evolutionary framework is applied on the pairs of Ceratiodactyla species. The family Camelidae (with eight living species) is more than 40 mya older with respect to the Bovidae one (that counts 156 extant species; see Fig 3.1). These features make this comparison particularly suitable in the light of the rate of speciation; in fact looking to the density of insertions we have strong evidences of a link between TE and rate of speciation (see Fig 3.9 a,b.). The fraction of total TE shows the same trend with less than 30% for Lama pacos and 45% for Bos taurus (Fig. 3.9c). Observing the four TE superfamilies separately it is possible to notice that they follow different trend. Class II TE and LTR elements density is higher in Lama pacos than in Bos taurus (Fig 3.9c). The same analyses were carried out in the order Rodentia. The ratio among the number of species ascribed to Heteromidae and Muridae is 1/20 as in Camelidae and Bovidae but the difference in the taxa age is only about 10 mya (Fig 3.1). It is noteworthy that, while the density of total insertions 37
.")
38 belonging to the 1% dataset is significantly higher in Rattus norvegicus with respect to Dipodomys ordii (2321 vs 171), the opposite trend is observed for density of insertions of elements belonging to the 5% dataset (27160 in Rattus norvegicus against in Dipodomis ordii). On the other hand, if we observe the percentage of total TE, the hypothesis of a content in TE positively correlated with the rate of speciation fits since Rattus norvegicus has a TE content higher (almost 40%) than Dipodomys ordii (nearly 25%). Considering the TE superfamilies separately the trend is the same for all of them except for SINEs that are more than double in Dipodomys ordii than in Rattus norvegicus (see Fig. 3.11). Figure 3.8. Species analyzed from Cetartyodactyla order; blue rectangle: family selected for lower rate of speciation; red rectangle: family selected for higher rate of speciation. 38

39 Figure 3.9.a. X axis; pair of species analyzed for Cetartyodactyla order. Y axis; density of insertion of transposable elements belonging to the 1% dataset. Figure 3.9.b. X axis: pair of species analyzed for Cetartyodactyla order. Y axis: density of insertions of transposable elements belonging to the 5% dataset. 39

40 Figure 3.9.c. X axis: blue bars; Lama pacos, red bars; bos taurus. Y axis: percentage of genome occupied by transposable elements. Figure Species analyzed from Rodentia order; blue rectangle: family selcted for lower rate of speciation; red rectangle: family selcted for higher rate of speciation. 40

41 Figure 3.11.a. X axis: pair of species analyzed for Cetartyodactyla order. Y axis: density of insertions of transposable elements belonging to the 1% dataset. 41
42 Figure 3.11.b. X axis: pair of specie analyzed for Rodentia order. Y axis: density of insertions of transposable elements belonging to the 5% dataset. Figure 3.11.c. X axis: blue bars; Dipodomys ordii, red bars Rattus norvegicus. Y axis: percentage of genome occupied by transposable elements. The calculation of average density of Transposable Elements insertions (average ins/gb) for each of the four superorders belonging to subclass Placentalia displayed that Afrotheria and Xenarthra have an average ins/gb lower than Laurasiantheria and Euarchontoglires for both 5% and 1% datasets (see Table 3.3). The pairs Euarchontoglires-Xenarthra and Euarchontoglires-Afrotheria show a ratio about 5/1. The Laurasiatheria-Xenarthra and Laurasiatheria-Afrotheria ratios are about 10/1 for the average insertions belonging to the 5% dataset (see figure 3.12). Minor differences can be observed for average insertions from the 1% dataset. Laurasiatheria-Xenarthra comparison has a ratio of 3/1, while Laurasiatheria- Afrotheria one is of 2/1. The paucity of available species in the taxa with low rate of speciation (two for Xenartra and three for Afrotheria) makes the sample analyzed 42
43 insufficient to have a statistical support for TE insertions belonging to the 1% dataset (Fig. 3.13), while for the density of insertions from the 5% dataset we are 95% confident that values calculated reflect the real trend of the species belonging to the four taxa (Fig. 3.12). Euarchontoglires Laurasiatheria Xenarthra Afrotheria Av-DI TEs 5% , Conf-int 5% Av-TEs 1% Conf-int 1% Table 3.3. Av-DI TEs 5%,1% = average of densities of insertions of transposable elements belonging to the 5% and 1% dataset. Conf-int 5%,1% = 95% confidence interval for densities of insertions of transposable elements belonging to 5% and 1% dataset. 43
44 Figure X axis: red bars taxa with higher rate of speciation, blue bars taxa with lower rate of speciation. Y axis: average density of insertions of transposable elements belonging to the 5% dataset. 44
45 Figure X axis: red bars taxa with higher rate of speciation, blue bars taxa with lower rate of speciation. Y axis: average density of insertions of transposable elements belonging to the 1% dataset. 45

46 Figure Selection of three species belonging to Mammalia: blue rectangle; lowest rate of speciation, Ornithorhynchus anatinus order Monotremata. Green rectangle; intermediate rate of speciation, Dasypus novemcinctus Order Cingulata. Red rectangle; highest rate of speciation, Myotis lucifugus Order Chiroptera. 46
47 Figure 3.15.a X axis: Species listed from left side by growing Reltive Rate of Speciation. Y axis: density of insertions of transposable elements belonging to 1% dataset. 47
48 Figure 3.15.b. X axis: Species listed from left side by growing Reltive Rate of Speciation. Y axis: density of insertions of transposable elements belonging to the 5% dataset. 48
49 Figure 3.15.c. X axis: blue bars; Ornithorhynchus anatinus, green bars; Dasypus novemcinctus, red bars; Myotis lucifugus. Y axis: percentage of genome occupied by transposable elements. Three mammal species have been selected for a comparison between orders with increasing rate of speciation (see fig. 3.14). The density of insertions of TE from 1% dataset reveals that only Myotis 49
, an higher density of insertions for Dasypus novemcinctus (2.")
50 lucifugus presents a recent activity of TEs with more than 2565 insertions in one GB (Fig a). The density of insertions of TE belonging to the 5% dataset reveals a very low value for Ornithorhynchus anatinus (116 ins/gb), an higher density of insertions for Dasypus novemcinctus (2.767 ins/gb) and the highest value in Myotis lucifugus (59290 ins/gb Fig b). Insertions from the 5% dataset reveal a slight trace of activity in Ornithorhynchus anatinus. Dasypus novemcinctus has a twenty fold higher density of insertions while Myotis lucifugus shows the highest value with a four hundred-fold higher density than Ornithorhynchus anatinus. Both parameters appear directly correlated with the rate of speciation. The situation changes with data of total content of TEs. The analysis shows that the total TE content is not correlated with the rate of speciation. Myotis lucifugus contains the lowest amount with 22% followed by Ornithorhynchus anatinus with 30% and Dasypus novemcinctus with 47% (see Fig 3.15.c). 50
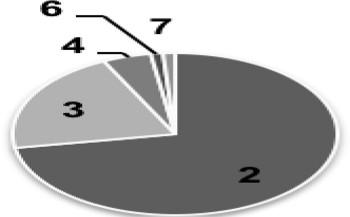
51 Figure Neoaves phylogenetic tree from Barker et al Red rectangle Order Passeriformes, blue rectangle order Galliformes. To verify if the trend observed in the class Mammalia is generalizable, the analysis of percentage of genome containing TE was repeated in the class Aves. The phylogeny of Neoaves places the order Galliformes in a basal position, while the order Passeriformes appears to be the most recent (see fig. 3.16). The differences in their number of living species is considerable: Galliformes counts 219 living species and Passeriformes For both taxa the genomes of two species were analyzed (Gallus gallus and Meleagris gallopavo in Galliformes. Geospiza fortis and Taeniopygia guttata in Passeriformes). We analyzed the total TE coverage with Gallus gallus and Meleagris gallopavo 51
52 against Geospiza fortis and Taeniopygia guttata genomes. The total TE content does not appear related to the rate of speciation; Meleagris gallopavo and Gallus gallus contains about 6,5% and 5%, respectively, while Taeniopygia guttata and Geospiza fortis show about 7% and 6,5%, respectively. In all analyzed species only two superfamilies of non-ltr retroposon and LTR retroposons are present. It can be noted a greater amount of LTR in Passeriformes (3,5% for Taeniopygia guttata and 2,8% for Geospiza fortis) with respect to Galliformes (Meleagris gallopavo and Gallus gallus have a content of 0,9 and 0,1 %, respectively) TOTAL NLTR LTR TOTAL NLTR LTR TOTAL NLTR LTR TOTAL NLTR LTR 52
53 A B Figure X axis: A; Meleagris gallopavo, B; Gallus gallus, C D C; Taeniopygia guttata D; Geospiza fortis. Y axis: percentage of genome occupied by transposable elements. The last analysis on vertebrates taxa was carried out through the comparison between the well known living fossil Latimeria chalumnae and Danio rerio, the evolutionary distance between them being more than 400 Mya. The taxon Sarcopterygii ( lobe finned fish ) contains eight species, while Actinopterygii ( ray finned fish ) lists species. The total TE content follows the expected trend: Latimeria chalumnae shows a 14% of total TE content, while for Danio rerio the value raises to 48%. Despite this dramatic difference, not all TE superfamilies follow the same trend. SINEs are more represented in Latimeria chalumnae with 7%, while Danio rerio contains only the 3%. Non-LTR retroposons are 5% in Latimeria chalumnae and 3% in Danio rerio. LTR retroposons follow the expected trend with the 1% in Latimeria chalumnae and the 5% in Danio 53
54 rerio. DNA transposons show the biggest difference with 0,7% in Latimeria chalumnae and 36% in Danio rerio (See fig. 3.18). 54
55 Figure X axis: blue bars; Latimeria chalumnae, red bars; Danio rerio. Y axis: percentage of genome occupied by transposable elements. Finally I compared the TE content of two insects, Drosophila grimshawii belonging to the group under fast speciation of Hawaiian species and Drosophila virilis. D. grimshawii presents the highest fraction of TEs, 14% while D. virilis shows the 10%. Non-LTR elements are the only TEs more represented in D. virilis with the 3% vs 2% of D. grimshawii (See fig. 3.19). Figure X axis: blue bars; Drosophyla virilis, red bars; Drosophila grimshawii. Y axis: percentage of genome occupied by transposable elements. 55
56 3.3 Discussion In paleontology, the term evolutionary radiation defines events with a large number of fossil forms, which appeared in a relatively short period of time as the Cambrian explosion. In zoology, one speaks of taxa in which the radiation is taking place at present time, as in cichlids fish of Lake Malawi (Joyce et al. 2005). In this term is qualitative not quantitative. In this work I define rigid criteria, and suggest a system that allows more accurate comparisons (See fig 3.2). If a taxon has a lower age and more species than another, I am confident in the fact that in recent times speciation events were more frequent. With this system we can evaluate if a taxon possess a relative rate of speciation ( RRS ) higher or lower than another. Sometimes comparisons are not possible. For example, the family Hominidae has fewer species than Cercopitecidae; on the other hand Cercopitecidae is older than Hominidae. In this case we can establish if a difference in the rate of speciation occurs, because the two families could have the same rate of speciation and the higher age of Cercopitecidae could result in a higher number of species. Among the 31 species of mammals analyzed by Jurka et al. (2011), I selected pairs of mammalian species belonging to families of the same order. Species with short generation time present favorable conditions to spread in subpopulations. This could affect the rate of speciation (Makarieva and Gorshkov 2004). For this reason I have started from the analysis of a proxy for generation time. This analysis allowed me to check a factor unrelated to the TE content of. So I expect that a higher rate of speciation corresponds to a shorter generation time. The values give only nine of 19 comparisons corresponding to the expected trend ( Fig. 3.3). At least for the mammalian species analyzed, I can therefore conclude that factors affecting the speed of reproduction and consequently the population size do not appear correlated with the rate of speciation. A quite different situation emerges when genomes are analyzed. The number of TE families belonging to the 5% dataset is related to the rate of speciation in 14 comparisons out of 19 (Fig. 3.4). The trend is confirmed when the families of TE belonging to the 1% dataset are concerned, with 15 out of 19 comparisons that follow the expected trend (see Fig. 3.5). This datum demonstrates that in the light of the rate of speciation the amount of 56
57 families of TEs recently mobilized is a feature not randomly distributed in Placentalia. If the TE activity has an impact on the genome sufficient to increase the likelihood of speciation, it is reasonable to presume that the number of single TE insertions occurred in a certain period of time is a more important feature with respect to the number of families to which they belong. In fact, we can have a recent big spread of TE belonging to a unique family, as observed f.e. for the SINEs_Fc family of Felis catus with elements from the 1% dataset (Jurka et al ). The comparison Canis lupus-felis catus fails to give the expected trend with four families of TE from the 1% dataset in Canis lupus and only three in Felis catus. If we look at the number of elements of the same group, Felis catus embodies 2372 elements, while Canis lupus only 462. In addition, we should take in account that the same number of insertions has a higher impact in smaller genomes. So I correlated the number of recently mobilized TE to the genome size, in order to have the density of insertion. This new parameter allowed me to make comparisons with all species without the interference of genome size. While the density of TE insertions from the 5% dataset (Fig 3.6) shows a correlation with the rate of speciation lower with respect to the number of TE families, t he density of insertion of TE from the 1% dataset shows the highest correlation among TE and rate of speciation. For all parameters used in this work the comparisons Erinaceus europaeus-sorex araneus, Microcebus murinus-callithrix jacchus, Otolemur garnettii-callithrix jacchus seem to be an exception to the rule. Other factors contributing to the rate speciation must therefore be involved in some cases with a greater effect with respect to the TE content. As confirmation of the effectiveness of this parameter, the species of the families Muridae: Mus musculus-rattus norvegicus and Hominidae: Pan troglodites-homo sapiens showed that the variation in TE content inside the same taxon don't change the result of comparison with the other species. The statistical validation of data obtained in the analysis of the 19 pairs of mammals state that only the four parameters used to test the activity of transposable elements are related to the rate of speciation. Among them the lowest W value was reached by evaluation of the density of insertions of elements belonging to the 1% dataset (Table 3.3). In addition this parameter display 16 out of 19 pairs 57
58 following the expected trend (Fig 3.7). Judging from these data we infer that the density of insertion of transposable elements diverging less than 1% from their consensus sequence could be the most related to the rate of speciation. The evaluation of average density of TE insertion for Laurasiatheria, Euarchontoglires, Xenarthra and Afrotheria allowed me to make a large scale analysis of the whole subclass Placentalia. Applying the same rules to obtain the Relative Rate of Speciation, it is possible to carry out four comparisons: Laurasiatheria-Xenarthra, LaurasiatheriaAfrotheria, Euarchontoglires-Xenarthra, Euarchontoglires-Afrotheria (see Fig 3.1). Also in this case the starting hypothesis is confirmed. For both TE belonging to both 1% and 5% datasets, Laurasiatheria and Euarchontoglires exceed by more than three-fold the density of insertion respect to Xenarthra and Afrotheria (Fig. 3.12,3.13). In this analysis, the assessment of the confidence interval tells us that the data related to transposons from the 1% dataset are not statistically supported. This is probably due to a too small sample of species available (two for Xenarthra and three for Afrotheria). We evaluated the percentage of total TES in Latimeria chalumnae, one of the 8 species of Sarcopterygii still alive and Danio rerio belonging to Actinopterygii that are present with more than living species. The common ancestor of these species lived more than 420 mya ago when Sarcopterygii and Actynopterigii separated (Coates 2009). Latimeria chalumnae is a well known living fossil; the 400 mya ago fossils don't show morphological differences respect to the species living at present days. The genome size of Latimeria chalumnae is over two gb whereas while Danio rerio one is 1,4 gb. It is now established that the amount of transposable elements is directly correlated to the genome size (Kidwell 2002). Paradoxically Latimeria chalumnae has a total TE content of only 14%, while in zebrafish TEs accounted for 48% of the genome. It is likely that throughout its history, the genome of Latimeria chalumnae had an inflation originated by TE bursts that have led the current size. If TE have ceased their activities, it is possible that the oldest elements have accumulated many mutations and are not more detectable by Repeat Masker. On the contrary, zebrafish presents a genome with a fraction of TE more than threefold higher. 58
59 The extreme differences in the rate of speciation among the two species may coincide with their TE content as in mammals. Whereas most of the studies on the relationship TE-speciation have been performed in vertebrates, I felt it necessary to increase the spectrum of the species analyzed in order to determine whether this mechanism is generalizable in all phyla. I have tried to test the hypothesis in two insects of the Diptera order: Drosophila virilis and the Hawaiian Drosophila grimshawii (see fig. 3.19). I classified Hawaiian species as a group with a higher rate of speciation considering that it had a radiation of about 1000 species becoming from a common ancestor that colonized the islands about 25 Mya ago (O Grady et al. 2011). Drosophila virilis was selected as the nearest relative from the north American continent. Notwithstanding that this comparison is made between two closely related species, there is an appreciable difference in the fraction of total TE (i.e. 10 % in Drosophila virilis and 14% in Drosophila grimshawii). The higher content of total TE in the Hawaiian species could be a first clue that the dynamics observed in vertebrates may also be present in insects. The analysis of the total TE percentage was performed also in some mammalian genomes. In the comparison Lama pacos-bos taurus (fig. 3.8) the total TE percentage shows the same trend of the most recently inserted elements. (fig. 3.9.a.b.c). The Relative Rate of Speciation in Camelidae family is dramatically lower in the comparison with Bovidae, the ratio of species number being more than 1/25 while the ratio among the ages of the taxa being over 4/1. These extreme differences could reflect the differences in both recent and ancient TE bursts. In the comparison Dypodomis ordii-rattus norvegicus, an higher density of TE belonging to the 5% dataset in the species with lower rate of speciation was observed. (See fig b). The fraction of total TE and the density of insertion of elements belonging to the <1% dataset follow the expected trend (see fig. 3.11a.c.). Those data reveal that within an intermediary period there was greater proliferation of TE in the family Heteromidae then in Muridae. At this stage, we selected three species of mammals belonging to different orders: Ornythoryncus anatinus (order Monotremata), Dasypus novemcinctus (order Cingulata) and Myotis lucifugus (order Chiroptera) (Fig.3.14). The three taxa are listed following a growing Relative Rate of Speciation. Data about the density of 59
60 insertions reveal that in Ornitorincus anatinus and Dasypus novemcinctus elements from the 1% dataset are lacking (Fig 3.15.a). The elements belonging to the 5% dataset are directly correlated with the Relative Rate of Speciation: 116 ins/gb Ornithorhynchus anatinus, 2767 in Dasypus novemcinctus, in Myotis lucifugus. (see Fig 3.15.b.) Surprisingly the trend changes when we analyze the percentage of total TE: 30% in Ornithorhynchus anatinus, 47% in Dasypus novemcinctus, 22% in Myotis lucifugus (see Fig c.). Probably, past episodes of TE bursts in Ornithorhynchus anatinus and Dasypus novemcinctus are unrelated with the actual rate of speciation. I tried to represent three models that allow an approximate classification of the genome type on the basis of its TE contents (See Fig 3.20). The majority of mammal genomes analyzed by Jurka are of type C. Some genomes are totally free of TE belonging to 1% dataset and therefore pertain to type B. This was observed in Dasypus novemcinctus, Lama pacos, Echinops telfairi, Loxodonta africana, (Jurka et al. 2011). These species belong to families with an estimated low rate of speciation, so we could define them as having cold genomes. In the case of Ornitoryncus anatinus in addition to lacking the TE 1% deviating from theyr consensus sequences, the fraction of TE belonging to the 5% dataset is so low that we can classify it as type A. The low TE activity reduces the formation of new phenotypes and decreases the likelihood that two sub-populations reach reproductive isolation. 60

61 Figure Modeling of genomes from the point of view of content in transposable elements, type A: genome devoid of TE <5% deviating from their consensus sequence, type B: genome devoid of TE <1% deviating from their consensus sequence, type C: genome equipped of TE <1% divergent from their consensus sequence. All the works that tried to prove the link between speciation and Transposable Elements have a weak point. There are in fact taxa apparently under evolutionary radiation but with a very low content of TE. The small content of TE in genomes of birds let argue that their evolutionary radiation is dependent by other factors (Jurka et al. 2011). Apparently Aves is one of those taxa that are an exception to the rule. I therefore tried to test the evolutionary framework on Aves. Recent phylogenies of birds agree in considering the order Galliformes as basal to the others, while Passeriformes is the most derived. Galliformes has 219 living species while Passeriformes has 5829 (Catalogue of Life). The Relative Rate of Speciation is higher in Passeriformes respect to Galliformes. The four species of birds I analyzed show a total TE content ranging from a maximum of 8% in Meleagris gallopavo to a minimum of 5% in Gallus gallus. (Fig. 3.17). Among all species 61
Comparing Genomes! Homologies and Families! Sequence Alignments!
 Comparing Genomes! Homologies and Families! Sequence Alignments! Allows us to achieve a greater understanding of vertebrate evolution! Tells us what is common and what is unique between different species
TE content correlates positively with genome size
 TE content correlates positively with genome size Mb 3000 Genomic DNA 2500 2000 1500 1000 TE DNA Protein-coding DNA 500 0 Feschotte & Pritham 2006 Transposable elements. Variation in gene numbers cannot
Outline. Genome Evolution. Genome. Genome Architecture. Constraints on Genome Evolution. New Evolutionary Synthesis 11/8/16
 Genome Evolution Outline 1. What: Patterns of Genome Evolution Carol Eunmi Lee Evolution 410 University of Wisconsin 2. Why? Evolution of Genome Complexity and the interaction between Natural Selection
Transposable elements activity reveals punctuated patterns of speciation in mammals
 Transposable elements activity reveals punctuated patterns of speciation in mammals Authors: Marco Ricci 1 * & Valentina Peona 1, Etienne Guichard 1 *, Cristian Taccioli 2 & Alessio Boattini 1 Affiliations:
Outline. Genome Evolution. Genome. Genome Architecture. Constraints on Genome Evolution. New Evolutionary Synthesis 11/1/18
 Genome Evolution Outline 1. What: Patterns of Genome Evolution Carol Eunmi Lee Evolution 410 University of Wisconsin 2. Why? Evolution of Genome Complexity and the interaction between Natural Selection
Characteristics of Life
 UNIT 2 BIODIVERSITY Chapter 4- Patterns of Life Biology 2201 Characteristics of Life All living things share some basic characteristics: 1) living things are organized systems made up of one or more cells
Biology Curriculum Pacing Guide MONTGOMERY COUNTY PUBLIC SCHOOLS
 MONTGOMERY COUNTY PUBLIC SCHOOLS Biology Curriculum Pacing Guide 1 st 9 Weeks SOL Objectives Vocabulary 7 Days 14 Days BIO.1 The student will demonstrate an understanding of scientific reasoning, logic,
Phylogeny 9/8/2014. Evolutionary Relationships. Data Supporting Phylogeny. Chapter 26
 Phylogeny Chapter 26 Taxonomy Taxonomy: ordered division of organisms into categories based on a set of characteristics used to assess similarities and differences Carolus Linnaeus developed binomial nomenclature,
Chapter 16: Reconstructing and Using Phylogenies
 Chapter Review 1. Use the phylogenetic tree shown at the right to complete the following. a. Explain how many clades are indicated: Three: (1) chimpanzee/human, (2) chimpanzee/ human/gorilla, and (3)chimpanzee/human/
Special Topics on Genetics
 ARISTOTLE UNIVERSITY OF THESSALONIKI OPEN COURSES Section 9: Transposable elements Drosopoulou E License The offered educational material is subject to Creative Commons licensing. For educational material,
SPECIATION. REPRODUCTIVE BARRIERS PREZYGOTIC: Barriers that prevent fertilization. Habitat isolation Populations can t get together
 SPECIATION Origin of new species=speciation -Process by which one species splits into two or more species, accounts for both the unity and diversity of life SPECIES BIOLOGICAL CONCEPT Population or groups
Frequently Asked Questions (FAQs)
") Frequently Asked Questions (FAQs) Q1. What is meant by Satellite and Repetitive DNA? Ans: Satellite and repetitive DNA generally refers to DNA whose base sequence is repeated many times throughout the
Frequently Asked Questions (FAQs) Q1. What is meant by Satellite and Repetitive DNA? Ans: Satellite and repetitive DNA generally refers to DNA whose base sequence is repeated many times throughout the
NOTES CH 24: The Origin of Species
 NOTES CH 24: The Origin of Species Species Hummingbirds of Costa Rica SPECIES: a group of individuals that mate with one another and produce fertile offspring; typically members of a species appear similar
AP Biology Notes Outline Enduring Understanding 1.C. Big Idea 1: The process of evolution drives the diversity and unity of life.
 AP Biology Notes Outline Enduring Understanding 1.C Big Idea 1: The process of evolution drives the diversity and unity of life. Enduring Understanding 1.C: Life continues to evolve within a changing environment.
Chapter 26: Phylogeny and the Tree of Life Phylogenies Show Evolutionary Relationships
 Chapter 26: Phylogeny and the Tree of Life You Must Know The taxonomic categories and how they indicate relatedness. How systematics is used to develop phylogenetic trees. How to construct a phylogenetic
Major questions of evolutionary genetics. Experimental tools of evolutionary genetics. Theoretical population genetics.
 Evolutionary Genetics (for Encyclopedia of Biodiversity) Sergey Gavrilets Departments of Ecology and Evolutionary Biology and Mathematics, University of Tennessee, Knoxville, TN 37996-6 USA Evolutionary
Amira A. AL-Hosary PhD of infectious diseases Department of Animal Medicine (Infectious Diseases) Faculty of Veterinary Medicine Assiut
 Faculty of Veterinary Medicine Assiut") Amira A. AL-Hosary PhD of infectious diseases Department of Animal Medicine (Infectious Diseases) Faculty of Veterinary Medicine Assiut University-Egypt Phylogenetic analysis Phylogenetic Basics: Biological
Amira A. AL-Hosary PhD of infectious diseases Department of Animal Medicine (Infectious Diseases) Faculty of Veterinary Medicine Assiut University-Egypt Phylogenetic analysis Phylogenetic Basics: Biological
A A A A B B1
 LEARNING OBJECTIVES FOR EACH BIG IDEA WITH ASSOCIATED SCIENCE PRACTICES AND ESSENTIAL KNOWLEDGE Learning Objectives will be the target for AP Biology exam questions Learning Objectives Sci Prac Es Knowl
Cubic Spline Interpolation Reveals Different Evolutionary Trends of Various Species
 Cubic Spline Interpolation Reveals Different Evolutionary Trends of Various Species Zhiqiang Li 1 and Peter Z. Revesz 1,a 1 Department of Computer Science, University of Nebraska-Lincoln, Lincoln, NE,
AP Curriculum Framework with Learning Objectives
 Big Ideas Big Idea 1: The process of evolution drives the diversity and unity of life. AP Curriculum Framework with Learning Objectives Understanding 1.A: Change in the genetic makeup of a population over
Enduring understanding 1.A: Change in the genetic makeup of a population over time is evolution.
 The AP Biology course is designed to enable you to develop advanced inquiry and reasoning skills, such as designing a plan for collecting data, analyzing data, applying mathematical routines, and connecting
Map of AP-Aligned Bio-Rad Kits with Learning Objectives
 Map of AP-Aligned Bio-Rad Kits with Learning Objectives Cover more than one AP Biology Big Idea with these AP-aligned Bio-Rad kits. Big Idea 1 Big Idea 2 Big Idea 3 Big Idea 4 ThINQ! pglo Transformation
8/23/2014. Phylogeny and the Tree of Life
 Phylogeny and the Tree of Life Chapter 26 Objectives Explain the following characteristics of the Linnaean system of classification: a. binomial nomenclature b. hierarchical classification List the major
MODELS OF SPECIATION. Sympatric Speciation: MODEL OF SYMPATRIC SPECIATION. Speciation without restriction to gene flow.
 MODELS OF SPECIATION Sympatric Speciation: Speciation without restriction to gene flow. Development of reproductive isolation without geographic barriers. Requires assortative mating and a stable polymorphism.
Dr. Amira A. AL-Hosary
 Phylogenetic analysis Amira A. AL-Hosary PhD of infectious diseases Department of Animal Medicine (Infectious Diseases) Faculty of Veterinary Medicine Assiut University-Egypt Phylogenetic Basics: Biological
Big Idea 1: The process of evolution drives the diversity and unity of life.
 Big Idea 1: The process of evolution drives the diversity and unity of life. understanding 1.A: Change in the genetic makeup of a population over time is evolution. 1.A.1: Natural selection is a major
Biological Evolution. Darwinian Evolution and Natural Selection
 Biological Evolution Darwinian Evolution and Natural Selection 1. Linnaean Classification Major Concepts 2. Fossils 3. Radioactive Dating 4. Fossil Record and Genetic Analysis 5. Theory of Evolution Random,
Mole_Oce Lecture # 24: Introduction to genomics
 Mole_Oce Lecture # 24: Introduction to genomics DEFINITION: Genomics: the study of genomes or he study of genes and their function. Genomics (1980s):The systematic generation of information about genes
Evaluate evidence provided by data from many scientific disciplines to support biological evolution. [LO 1.9, SP 5.3]
![Evaluate evidence provided by data from many scientific disciplines to support biological evolution. [LO 1.9, SP 5.3]](/thumbs/75/72965665.jpg "Evaluate evidence provided by data from many scientific disciplines to support biological evolution. [LO 1.9, SP 5.3]") Learning Objectives Evaluate evidence provided by data from many scientific disciplines to support biological evolution. [LO 1.9, SP 5.3] Refine evidence based on data from many scientific disciplines
Learning Objectives Evaluate evidence provided by data from many scientific disciplines to support biological evolution. [LO 1.9, SP 5.3] Refine evidence based on data from many scientific disciplines
AP Biology Essential Knowledge Cards BIG IDEA 1
 AP Biology Essential Knowledge Cards BIG IDEA 1 Essential knowledge 1.A.1: Natural selection is a major mechanism of evolution. Essential knowledge 1.A.4: Biological evolution is supported by scientific
Genetics 275 Notes Week 7
 Cytoplasmic Inheritance Genetics 275 Notes Week 7 Criteriafor recognition of cytoplasmic inheritance: 1. Reciprocal crosses give different results -mainly due to the fact that the female parent contributes
Molecular evolution - Part 1. Pawan Dhar BII
 Molecular evolution - Part 1 Pawan Dhar BII Theodosius Dobzhansky Nothing in biology makes sense except in the light of evolution Age of life on earth: 3.85 billion years Formation of planet: 4.5 billion
Homework Assignment, Evolutionary Systems Biology, Spring Homework Part I: Phylogenetics:
 Homework Assignment, Evolutionary Systems Biology, Spring 2009. Homework Part I: Phylogenetics: Introduction. The objective of this assignment is to understand the basics of phylogenetic relationships
MACROEVOLUTION Student Packet SUMMARY EVOLUTION IS A CHANGE IN THE GENETIC MAKEUP OF A POPULATION OVER TIME Macroevolution refers to large-scale
 MACROEVOLUTION Student Packet SUMMARY EVOLUTION IS A CHANGE IN THE GENETIC MAKEUP OF A POPULATION OVER TIME Macroevolution refers to large-scale evolutionary changes such as speciation events, origin of
Supplemental Figure 1.
 Supplemental Material: Annu. Rev. Genet. 2015. 49:213 42 doi: 10.1146/annurev-genet-120213-092023 A Uniform System for the Annotation of Vertebrate microrna Genes and the Evolution of the Human micrornaome
Any evidence of an organism that lived long ago. Sedimentary. Relative Dating. Absolute Dating
 A fossil is: Any evidence of an organism that lived long ago Sedimentary Rock Almost all fossils are found in How do scientists determine the age of fossils? Relative Dating Absolute Dating The deeper
AP Biology Exam #7 (PRACTICE) Subunit #7: Diversity of Life
 Subunit #7: Diversity of Life") AP Biology Exam #7 (PRACTICE) Subunit #7: Diversity of Life Multiple Choice Questions: Choose the best answer then bubble your answer on your scantron sheet. 1. Armadillos and spiny anteaters are not related.
AP Biology Exam #7 (PRACTICE) Subunit #7: Diversity of Life Multiple Choice Questions: Choose the best answer then bubble your answer on your scantron sheet. 1. Armadillos and spiny anteaters are not related.
How Biological Diversity Evolves
 CHAPTER 14 How Biological Diversity Evolves PowerPoint Lectures for Essential Biology, Third Edition Neil Campbell, Jane Reece, and Eric Simon Essential Biology with Physiology, Second Edition Neil Campbell,
Valley Central School District 944 State Route 17K Montgomery, NY Telephone Number: (845) ext Fax Number: (845)
 ext Fax Number: (845)") Valley Central School District 944 State Route 17K Montgomery, NY 12549 Telephone Number: (845)457-2400 ext. 18121 Fax Number: (845)457-4254 Advance Placement Biology Presented to the Board of Education
Valley Central School District 944 State Route 17K Montgomery, NY 12549 Telephone Number: (845)457-2400 ext. 18121 Fax Number: (845)457-4254 Advance Placement Biology Presented to the Board of Education
Biology. Chapter 12. Meiosis and Sexual Reproduction. Concepts and Applications 9e Starr Evers Starr. Cengage Learning 2015
 Biology Concepts and Applications 9e Starr Evers Starr Chapter 12 Meiosis and Sexual Reproduction 12.1 Why Sex? In asexual reproduction, a single individual gives rise to offspring that are identical to
Origins of Life. Fundamental Properties of Life. Conditions on Early Earth. Evolution of Cells. The Tree of Life
 The Tree of Life Chapter 26 Origins of Life The Earth formed as a hot mass of molten rock about 4.5 billion years ago (BYA) -As it cooled, chemically-rich oceans were formed from water condensation Life
Principles of Genetics
 Principles of Genetics Snustad, D ISBN-13: 9780470903599 Table of Contents C H A P T E R 1 The Science of Genetics 1 An Invitation 2 Three Great Milestones in Genetics 2 DNA as the Genetic Material 6 Genetics
Genomes and Their Evolution
 Chapter 21 Genomes and Their Evolution PowerPoint Lecture Presentations for Biology Eighth Edition Neil Campbell and Jane Reece Lectures by Chris Romero, updated by Erin Barley with contributions from
Concept Modern Taxonomy reflects evolutionary history.
 Concept 15.4 Modern Taxonomy reflects evolutionary history. What is Taxonomy: identification, naming, and classification of species. Common Names: can cause confusion - May refer to several species (ex.
8/23/2014. Introduction to Animal Diversity
 Introduction to Animal Diversity Chapter 32 Objectives List the characteristics that combine to define animals Summarize key events of the Paleozoic, Mesozoic, and Cenozoic eras Distinguish between the
Evolution Problem Drill 10: Human Evolution
 Evolution Problem Drill 10: Human Evolution Question No. 1 of 10 Question 1. Which of the following statements is true regarding the human phylogenetic relationship with the African great apes? Question
Quantitative Measurement of Genome-wide Protein Domain Co-occurrence of Transcription Factors
 Quantitative Measurement of Genome-wide Protein Domain Co-occurrence of Transcription Factors Arli Parikesit, Peter F. Stadler, Sonja J. Prohaska Bioinformatics Group Institute of Computer Science University
Biology Eighth Edition Neil Campbell and Jane Reece
 BIG IDEA I The process of evolution drives the diversity and unity of life. Enduring Understanding 1.C Life continues to evolve within a changing environment. Essential Knowledge 1.C.1 Speciation and extinction
Essential knowledge 1.A.2: Natural selection
 Appendix C AP Biology Concepts at a Glance Big Idea 1: The process of evolution drives the diversity and unity of life. Enduring understanding 1.A: Change in the genetic makeup of a population over time
Processes of Evolution
 15 Processes of Evolution Forces of Evolution Concept 15.4 Selection Can Be Stabilizing, Directional, or Disruptive Natural selection can act on quantitative traits in three ways: Stabilizing selection
Master Biomedizin ) UCSC & UniProt 2) Homology 3) MSA 4) Phylogeny. Pablo Mier
 UCSC & UniProt 2) Homology 3) MSA 4) Phylogeny. Pablo Mier") Master Biomedizin 2018 1) UCSC & UniProt 2) Homology 3) MSA 4) 1 12 a. All of the sequences in file1.fasta (https://cbdm.uni-mainz.de/mb18/) are homologs. How many groups of orthologs would you say there
Master Biomedizin 2018 1) UCSC & UniProt 2) Homology 3) MSA 4) 1 12 a. All of the sequences in file1.fasta (https://cbdm.uni-mainz.de/mb18/) are homologs. How many groups of orthologs would you say there
Evolution Problem Drill 09: The Tree of Life
 Evolution Problem Drill 09: The Tree of Life Question No. 1 of 10 Question 1. The age of the Earth is estimated to be about 4.0 to 4.5 billion years old. All of the following methods may be used to estimate
Biology 211 (2) Week 1 KEY!
 Week 1 KEY!") Biology 211 (2) Week 1 KEY Chapter 1 KEY FIGURES: 1.2, 1.3, 1.4, 1.5, 1.6, 1.7 VOCABULARY: Adaptation: a trait that increases the fitness Cells: a developed, system bound with a thin outer layer made of
Biology 211 (2) Week 1 KEY Chapter 1 KEY FIGURES: 1.2, 1.3, 1.4, 1.5, 1.6, 1.7 VOCABULARY: Adaptation: a trait that increases the fitness Cells: a developed, system bound with a thin outer layer made of
Phylogeny is the evolutionary history of a group of organisms. Based on the idea that organisms are related by evolution
 Bio 1M: Phylogeny and the history of life 1 Phylogeny S25.1; Bioskill 11 (2ndEd S27.1; Bioskills 3) Bioskills are in the back of your book Phylogeny is the evolutionary history of a group of organisms
5/4/05 Biol 473 lecture
 5/4/05 Biol 473 lecture animals shown: anomalocaris and hallucigenia 1 The Cambrian Explosion - 550 MYA THE BIG BANG OF ANIMAL EVOLUTION Cambrian explosion was characterized by the sudden and roughly simultaneous
Evolution and Taxonomy Laboratory
 Evolution and Taxonomy Laboratory 1 Introduction Evolution refers to the process by which forms of life have changed through time by what is described as descent with modification. Evolution explains the
Chapter 26 Phylogeny and the Tree of Life
 Chapter 26 Phylogeny and the Tree of Life Biologists estimate that there are about 5 to 100 million species of organisms living on Earth today. Evidence from morphological, biochemical, and gene sequence
CHAPTERS 24-25: Evidence for Evolution and Phylogeny
 CHAPTERS 24-25: Evidence for Evolution and Phylogeny 1. For each of the following, indicate how it is used as evidence of evolution by natural selection or shown as an evolutionary trend: a. Paleontology
Unit 7: Evolution Guided Reading Questions (80 pts total)
") AP Biology Biology, Campbell and Reece, 10th Edition Adapted from chapter reading guides originally created by Lynn Miriello Name: Unit 7: Evolution Guided Reading Questions (80 pts total) Chapter 22 Descent
AP Biology Biology, Campbell and Reece, 10th Edition Adapted from chapter reading guides originally created by Lynn Miriello Name: Unit 7: Evolution Guided Reading Questions (80 pts total) Chapter 22 Descent
- mutations can occur at different levels from single nucleotide positions in DNA to entire genomes.
 February 8, 2005 Bio 107/207 Winter 2005 Lecture 11 Mutation and transposable elements - the term mutation has an interesting history. - as far back as the 17th century, it was used to describe any drastic
CLASSIFICATION. Finding Order in Diversity
 CLASSIFICATION Finding Order in Diversity WHAT IS TAXONOMY? Discipline of classifying organisms and assigning each organism a universally accepted name. WHY CLASSIFY? To study the diversity of life, biologists
Chapter 26. Phylogeny and the Tree of Life. Lecture Presentations by Nicole Tunbridge and Kathleen Fitzpatrick Pearson Education, Inc.
 Chapter 26 Phylogeny and the Tree of Life Lecture Presentations by Nicole Tunbridge and Kathleen Fitzpatrick Investigating the Tree of Life Phylogeny is the evolutionary history of a species or group of
EVOLUTION change in populations over time
 EVOLUTION change in populations over time HISTORY ideas that shaped the current theory James Hutton & Charles Lyell proposes that Earth is shaped by geological forces that took place over extremely long
Curriculum Map. Biology, Quarter 1 Big Ideas: From Molecules to Organisms: Structures and Processes (BIO1.LS1)
") 1 Biology, Quarter 1 Big Ideas: From Molecules to Organisms: Structures and Processes (BIO1.LS1) Focus Standards BIO1.LS1.2 Evaluate comparative models of various cell types with a focus on organic molecules
1 Biology, Quarter 1 Big Ideas: From Molecules to Organisms: Structures and Processes (BIO1.LS1) Focus Standards BIO1.LS1.2 Evaluate comparative models of various cell types with a focus on organic molecules
Unfortunately, there are many definitions Biological Species: species defined by Morphological Species (Morphospecies): characterizes species by
: characterizes species by") 1 2 3 4 5 6 Lecture 3: Chapter 27 -- Speciation Macroevolution Macroevolution and Speciation Microevolution Changes in the gene pool over successive generations; deals with alleles and genes Macroevolution
1 2 3 4 5 6 Lecture 3: Chapter 27 -- Speciation Macroevolution Macroevolution and Speciation Microevolution Changes in the gene pool over successive generations; deals with alleles and genes Macroevolution
Conceptually, we define species as evolutionary units :
 Bio 1M: Speciation 1 How are species defined? S24.1 (2ndEd S26.1) Conceptually, we define species as evolutionary units : Individuals within a species are evolving together Individuals of different species
Speciation. Today s OUTLINE: Mechanisms of Speciation. Mechanisms of Speciation. Geographic Models of speciation. (1) Mechanisms of Speciation
 Mechanisms of Speciation") Speciation Today s OUTLINE: (1) Geographic Mechanisms of Speciation (What circumstances lead to the formation of new species?) (2) Species Concepts (How are Species Defined?) Mechanisms of Speciation Last
Speciation Today s OUTLINE: (1) Geographic Mechanisms of Speciation (What circumstances lead to the formation of new species?) (2) Species Concepts (How are Species Defined?) Mechanisms of Speciation Last
METHODS FOR DETERMINING PHYLOGENY. In Chapter 11, we discovered that classifying organisms into groups was, and still is, a difficult task.
 Chapter 12 (Strikberger) Molecular Phylogenies and Evolution METHODS FOR DETERMINING PHYLOGENY In Chapter 11, we discovered that classifying organisms into groups was, and still is, a difficult task. Modern
FUNDAMENTALS OF MOLECULAR EVOLUTION
 FUNDAMENTALS OF MOLECULAR EVOLUTION Second Edition Dan Graur TELAVIV UNIVERSITY Wen-Hsiung Li UNIVERSITY OF CHICAGO SINAUER ASSOCIATES, INC., Publishers Sunderland, Massachusetts Contents Preface xiii
Modern Evolutionary Classification. Section 18-2 pgs
 Modern Evolutionary Classification Section 18-2 pgs 451-455 Modern Evolutionary Classification In a sense, organisms determine who belongs to their species by choosing with whom they will mate. Taxonomic
 1 of 13 8/11/2014 10:32 AM Units: Teacher: APBiology, CORE Course: APBiology Year: 2012-13 Chemistry of Life Chapters 1-4 Big Idea 1, 2 & 4 Change in the genetic population over time is feedback mechanisms
Drosophila melanogaster and D. simulans, two fruit fly species that are nearly
 Comparative Genomics: Human versus chimpanzee 1. Introduction The chimpanzee is the closest living relative to humans. The two species are nearly identical in DNA sequence (>98% identity), yet vastly different
Roadmap. Sexual Selection. Evolution of Multi-Gene Families Gene Duplication Divergence Concerted Evolution Survey of Gene Families
 1 Roadmap Sexual Selection Evolution of Multi-Gene Families Gene Duplication Divergence Concerted Evolution Survey of Gene Families 2 One minute responses Q: How do aphids start producing males in the
The Origin of Species
 The Origin of Species Introduction A species can be defined as a group of organisms whose members can breed and produce fertile offspring, but who do not produce fertile offspring with members of other
Full file at CHAPTER 2 Genetics
 CHAPTER 2 Genetics MULTIPLE CHOICE 1. Chromosomes are a. small linear bodies. b. contained in cells. c. replicated during cell division. 2. A cross between true-breeding plants bearing yellow seeds produces
Yesterday, we explored various pieces of lab equipment. In the activity, each group was asked to sort the equipment into groups. How did you decide
 Yesterday, we explored various pieces of lab equipment. In the activity, each group was asked to sort the equipment into groups. How did you decide where each piece of equipment belongs? In a similar manner,
EVOLUTION change in populations over time
 EVOLUTION change in populations over time HISTORY ideas that shaped the current theory James Hutton (1785) proposes that Earth is shaped by geological forces that took place over extremely long periods
Chapter 26 Phylogeny and the Tree of Life
 Chapter 26 Phylogeny and the Tree of Life Chapter focus Shifting from the process of how evolution works to the pattern evolution produces over time. Phylogeny Phylon = tribe, geny = genesis or origin
PHYLOGENY AND SYSTEMATICS
 AP BIOLOGY EVOLUTION/HEREDITY UNIT Unit 1 Part 11 Chapter 26 Activity #15 NAME DATE PERIOD PHYLOGENY AND SYSTEMATICS PHYLOGENY Evolutionary history of species or group of related species SYSTEMATICS Study
Biology 110 Survey of Biology. Quizzam
 1. Mendel conducted his most memorable experiments on A) peas. B) roses. C) guinea pigs. D) fruit flies. E) clones. 2. Varieties of plants in which self-fertilization produces offspring that are identical
Ohio Tutorials are designed specifically for the Ohio Learning Standards to prepare students for the Ohio State Tests and end-ofcourse
 Tutorial Outline Ohio Tutorials are designed specifically for the Ohio Learning Standards to prepare students for the Ohio State Tests and end-ofcourse exams. Biology Tutorials offer targeted instruction,
Name: Class: Date: ID: A
 Class: _ Date: _ Ch 17 Practice test 1. A segment of DNA that stores genetic information is called a(n) a. amino acid. b. gene. c. protein. d. intron. 2. In which of the following processes does change
Biology II : Embedded Inquiry
 Biology II : Embedded Inquiry Conceptual Strand Understandings about scientific inquiry and the ability to conduct inquiry are essential for living in the 21 st century. Guiding Question What tools, skills,
Biology, 7e (Campbell) Chapter 13: Meiosis and Sexual Life Cycles
 Chapter 13: Meiosis and Sexual Life Cycles") Biology, 7e (Campbell) Chapter 13: Meiosis and Sexual Life Cycles Chapter Questions 1) What is a genome? A) the complete complement of an organism's genes B) a specific sequence of polypeptides within
Biology, 7e (Campbell) Chapter 13: Meiosis and Sexual Life Cycles Chapter Questions 1) What is a genome? A) the complete complement of an organism's genes B) a specific sequence of polypeptides within
C3020 Molecular Evolution. Exercises #3: Phylogenetics
 C3020 Molecular Evolution Exercises #3: Phylogenetics Consider the following sequences for five taxa 1-5 and the known outgroup O, which has the ancestral states (note that sequence 3 has changed from
1. What is the definition of Evolution? a. Descent with modification b. Changes in the heritable traits present in a population over time c.
 1. What is the definition of Evolution? a. Descent with modification b. Changes in the heritable traits present in a population over time c. Changes in allele frequencies in a population across generations
The Tree of Life. Chapter 17
 The Tree of Life Chapter 17 1 17.1 Taxonomy The science of naming and classifying organisms 2000 years ago Aristotle Grouped plants and animals Based on structural similarities Greeks and Romans included
The Nature of Species. The Origin of Species. The Nature of Species. The Nature of Species. The Biological Species Concept
 The Origin of Species Chapter 22 The Nature of Species The concept of species must account for two phenomena: The distinctiveness of species that occur together at a single locality The connection that
The Origin of Species
 The Origin of Species A. Macroevolution: Up to this point we have discussed changes in alleles or microevolution, with evolution this is the evolution of new. is the origin of a new species. There are
Sperm & Eggs & Variation..OH MY!
 Sperm & Eggs & Variation..OH MY! 1 What if a new individual was formed through mitosis? 2 allele amniocentesis asexual reproduction autosome binary fission chorionic villi sampling crossing over diploid
TEST SUMMARY AND FRAMEWORK TEST SUMMARY
 Washington Educator Skills Tests Endorsements (WEST E) TEST SUMMARY AND FRAMEWORK TEST SUMMARY BIOLOGY Copyright 2014 by the Washington Professional Educator Standards Board 1 Washington Educator Skills
Chapter 26: Phylogeny and the Tree of Life
 Chapter 26: Phylogeny and the Tree of Life 1. Key Concepts Pertaining to Phylogeny 2. Determining Phylogenies 3. Evolutionary History Revealed in Genomes 1. Key Concepts Pertaining to Phylogeny PHYLOGENY
Exam 1 ID#: October 4, 2007
 Biology 4361 Name: KEY Exam 1 ID#: October 4, 2007 Multiple choice (one point each) (1-25) 1. The process of cells forming tissues and organs is called a. morphogenesis. b. differentiation. c. allometry.
Name Class Date. In the space provided, write the letter of the description that best matches the term or phrase.
 Assessment Chapter Test B Classification of Organisms In the space provided, write the letter of the description that best matches the term or phrase. 1. Archaea 2. Bacteria a. kingdom; includes Euglena
Phylogenetic Analysis
 Phylogenetic Analysis Aristotle Through classification, one might discover the essence and purpose of species. Nelson & Platnick (1981) Systematics and Biogeography Carl Linnaeus Swedish botanist (1700s)
The Tempo of Macroevolution: Patterns of Diversification and Extinction
 The Tempo of Macroevolution: Patterns of Diversification and Extinction During the semester we have been consider various aspects parameters associated with biodiversity. Current usage stems from 1980's
Chapter Chemical Uniqueness 1/23/2009. The Uses of Principles. Zoology: the Study of Animal Life. Fig. 1.1
 Fig. 1.1 Chapter 1 Life: Biological Principles and the Science of Zoology BIO 2402 General Zoology Copyright The McGraw Hill Companies, Inc. Permission required for reproduction or display. The Uses of
Saturday, August 24, Speciation
 Speciation New Species Can Emerge Darwin called the first appearance of new beings on earth the mystery of mysteries. The origin of species or speciation is central to evolutionary theory because the appearance
The Origin of Species
 LECTURE PRESENTATIONS For CAMPBELL BIOLOGY, NINTH EDITION Jane B. Reece, Lisa A. Urry, Michael L. Cain, Steven A. Wasserman, Peter V. Minorsky, Robert B. Jackson Chapter 24 The Origin of Species Lectures
Chapter 22: Descent with Modification: A Darwinian View of Life
 Chapter 22: Descent with Modification Name Period Chapter 22: Descent with Modification: A Darwinian View of Life As you study this chapter, read several paragraphs at a time to catch the flow of ideas