Follow this and additional works at:
|
|
|
- Shawn Garrett
- 6 years ago
- Views:
Transcription
 N.")
1 International Congress on Environmental Modelling and Software Brigham Young University BYU ScholarsArchive 3rd International Congress on Environmental Modelling and Software - Burlington, Vermont, USA - July 2006 Jul 1st, 12:00 AM Estimation of Monthly Distribution of Debris- Flow Events for the Territory of the USA (using the Distribution Model for Periods of Debris-Flow Danger) N. Belaya Follow this and additional works at: Belaya, N., "Estimation of Monthly Distribution of Debris-Flow Events for the Territory of the USA (using the Distribution Model for Periods of Debris-Flow Danger)" (2006). International Congress on Environmental Modelling and Software This Event is brought to you for free and open access by the Civil and Environmental Engineering at BYU ScholarsArchive. It has been accepted for inclusion in International Congress on Environmental Modelling and Software by an authorized administrator of BYU ScholarsArchive. For more information, please contact scholarsarchive@byu.edu.
2 Estimation of Monthly Distribution of Debris-Flow Events for the Territory of the USA (using the Distribution Model for Periods of Debris-Flow Danger) N. Belaya Laboratory of Snow Avalanches and Debris-Flows, Lomonosov Moscow State University, Russia, Abstract: The present work illustrates calculation results of monthly distribution of debris-flow events for the territory of the USA according to the model for the periods of debris-flow danger fully described in the paper by N. Belaya (Belaya 2003). The model based on the dependency of the debris-flow regime on climate parameters has been developed in order to assess the monthly distribution of debris-flow events both for poorly explored mountain regions of the world and for scenarios of climate changes. It considers rainfall initiated debris-flows in accordance with the debris-flow genetic classification of V. F. Perov. The following small-scale maps and their short descriptions for the territory of the USA are presented in the work: the first and the last months of debris-flow danger period (DFDP) and the extreme debris-flow danger period (EDFDP)., where DFDP is part of a calendar year during which 100% of all debris flows occur; EDFDP is part of the DFDP and accounts for more than 50 per cent of all debris-flow events. The borderlines of debrisflow hazard regions have been taken from the Map of the world mudflow phenomena Keywords: Debris-flows; Debris-flow danger periods; Hazard mapping 1. INTRODUCTION Huge territories in the World are currently poorly explored from point of view of debris-flow distribution and regime. Complexity of smallscale debris-flow hazard mapping and especially mapping of debris-flow regime characteristics relates with the data lack. Sufficient data sets of debris-flow events exist only for not numerous debris-flow catchments. As a result for mapping of debris-flow regime characteristics it needs to use indirect methods. Such methods have been developed on the basis of debris-flow catalogues published in the USSR and Russia. In this paper we present an attempt to estimate the monthly distribution of debris-flow events for the territory of the USA using the method developed on basis of data observed in the territory of the former USSR. The following approach allows making this sort of estimations: the monthly distribution of debris-flow events is determined by the year patterns of meteorological characteristics, and the regions with similar climatic conditions should have the same rules for calculating the characteristics of the monthly distribution of debris-flow events. Thus it is possible to apply the rules formulated using data of an investigated geographical region for another regions-analogue, for example, situated in other continents. 2. DISTRIBUTION MODEL FOR PERIODS OF DEBRIS-FLOW DANGER 2. 1 Introduction For estimations of monthly distribution of debrisflows for the territory of the USA the distribution model for periods of debris-flow danger has been applied. The full description of this model is presented in the paper by N. Belaya (Belaya 2003). This model considers rainfall initiated debris flows in accordance with the debris-flow genetic classification of Perov et al. (1997). The borderlines of debris-flow hazard regions have been taken from the Map of the world mudflow phenomena (Perov et al. 1997). The model utilizes the terms characterizing the principal periods of debris-flow danger: a debrisflow danger period (DFDP) is a part of a calendar
 is a part of the MDFDP and accounts for more than 50 per cent of all debris-flow events.")
3 year during which 100% of all debris flows occur; the main debris-flow danger period (MDFDP) is a part of the DFDP and accounts for more than 90 per cent of all debris-flow events; the extreme debris-flow danger period (EDFDP) is a part of the MDFDP and accounts for more than 50 per cent of all debris-flow events. Figure 1 shows an example of monthly distribution of debris-flow events, as well as the three periods of debris-flow danger. While handling the actual data, it was found that the general rules for calculating the characteristics of the annual distribution of debris-flow events depending on the climatic characteristics could be formulated only for the regions with similar climatic conditions. Thus, the types of regions with similar climatic conditions favourable for debris-flow occurrence have been noted. Each of the noted type of regions has specific dependencies between the number of debris-flow events and the climatic characteristics. Table 1. Determining the debris-flow danger period (DFDP) months. Majority of regions Permafrost regions Regions with warm winters and active cyclone activity during the cold period DFDP coincides with the warm period DFDP coincides with the warm period, except for the first and the last months. DFDP is all-year-round Figure 1. Monthly Distribution of debris-flow events in percent of total (N) and periods of debris-flow danger: (a) debris-flow danger period (DFDP), (b) main debris-flow danger period (MDFDP), (c) extreme debris-flow danger period (EDFDP); climatic data: monthly rainfall in mm (P); monthly air temperature in ºC (T). The following theoretical basis lies in the model developing. The main parameters of debris-flow regime include danger periods as parts of calendar year and recurrence. While geologic and topographic factors play a significant role in recurrence of debris flows, they can be ignored for assessment of the monthly distribution of debris-flows. Of all the debris-flow-forming factors, the climate factor dominates the monthly distribution of debris-flow events; therefore the opportunity exists to develop a model based on the climate parameters. 2.2 Model Short Description For determination of debris-flow danger period (DFDP) the climatic warm period was used as a basis. Depending on the possibility of deep thaws and the presence of permafrost the deviation from the warm period to both sides can be observed (Table 1). The next stages of the model performance require the singling out of the MDFDP and the EDFDP. The major climatic factors affecting the formation of debris flows have been specified for this purpose. Temperature conditions of the warm period of a year, evaluated according to Köppen- Trewartha (1981) climate classification (cf. Hromov & Petrosyants 1994). Within the same interval of temperature conditions of the warm period, all regions are subdivided according to humidity conditions evaluated using the Selyaninov precipitation-temperature coefficient (H) (Hromov & Petrosyants 1994). The third criterion is related to the temperature conditions of the cold period. Major thaws may occur when the average daily air temperature exceeds 5ºC. The threshold value for the air temperature of the coldest month was set to -6 C. Earlier, statistical analysis of meteorological data showed that significant thaws did not occur in regions with air temperature of the coldest month below -6 C (Mygkov 1992). The fourth level of division considers peculiarities of the annual distribution of precipitation in regions with H>1.3 and of snow cover in regions with H>1.3, where summer precipitation is insufficient. The debris-flow basins of Middle Asia are an outstanding example. Where maximum mountain snow pack depth exceeds 50 cm, a significant percentage of debris flow is caused by rain combined with snowmelt. The precipitation irregularity index (I ir ) (Hromov & Petrosyants 1994) has been selected as the parameter characterizing the annual distribution of precipitation. A threshold value of Iir = 0.5 has been selected. The regions with Iir < 0.5 have a proportional annual distribution of precipitation and are typical for sea climates. In regions with cold winters I ir is not applicable
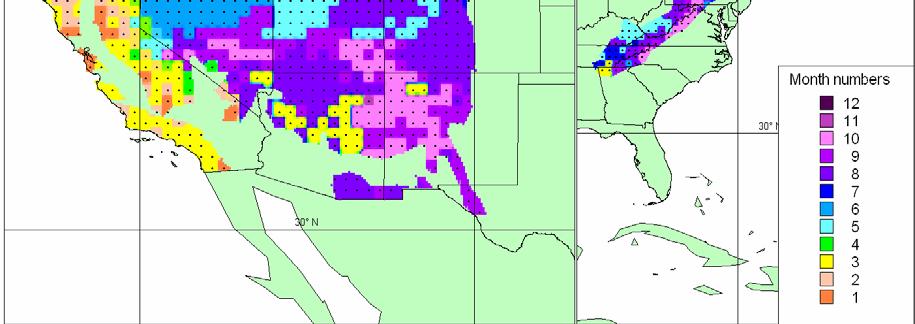
4 because of the short DFDP. In the Table 2 classification of regions having similar climatic conditions favourable for debris-flow formation are presented. For each of 20 region types the rules for attributing debris-flow danger months to periods of debris-flow danger have been formulated. Having statistics available for dates of debrisflows in certain regions, and having the determined rules, we can obtain the monthly debris-flow distribution pattern for other regions with the same type of climate, where debris-flowevent observations are unavailable, or for the original region, if it has been subjected to a climatic change. Table 2. Region types (f) having similar climatic conditions favourable for debris-flow formation: (a) Temperature conditions of warm period; (b) Humidity conditions of the vegetation period where H - Selyaninov precipitation-temperature coefficient; (c) Temperature conditions of cold period; (d) Snow cover conditions where D (sm) - maximum mountain snow pack depth; (e) Peculiarities of the monthly distribution of precipitation, where Iir - precipitation irregularity index. (a) (b) (c) (d) (e) (f) Permafrost areas 1 3 and less months with T i 10 C 4-7 months with T i 10 C 8-12 months with T i 10 C H 1.3 H<1.3 H 1.3 H<1.3 H 1.3 T m -6ºC - 2 T m > -6ºC - I ir I ir >0.5 4 T m -6ºC D 50 5 D<50 6 T m > -6ºC D 50 7 D<50 I ir T m -6ºC - 9 T m > -6ºC I ir I ir > T m -6ºC D D<50 13 T m > -6ºC D D<50 I ir I ir > I ir I ir > The data of mean monthly air temperatures and precipitation have been used as input data in describing model. The present work uses the CRU Global Climate Dataset (New M. et al. 1999), which consists of mean monthly climatological data with 0.5º latitude by 0.5º longitude resolutions for global land areas, excluding Antarctica, and strictly constrained to the period The result of the model s calculation is the attribution of one of four numbers assigned to each month of the year at each grid point of climate dataset: 0 is ascribed to months with no danger of debris-flow; number 1 attributes the month to the DFDP, outside the MDFDP; number 2: the month is attributed to the MDFDP, outside the EDFDP; number 3: the month is attributed to the EDFDP. Some constraints existing within the framework of the described model may also be mentioned. First of all, the accuracy of determining the time intervals of the debris-flow danger periods is limited to the period of one month. Secondly, the errors inherent in the present-day climate database negatively influence the quality of the model s results. The detail description of the distribution model for periods of debris-flow danger is presented in the paper (Belaya N. 2003). 3. ESTIMATION OF DEBRIS-FLOW EVENTS MONTHLY DISTRIBUTION FOR THE TERRITORY OF THE USA In this work we consider the continental part of the USA except the State of Alaska. Two thirds of the investigated territory has all-the-year-round DFDP. In most cases 12 months of debris-flow activity is possible due to positive air temperature during the year. In some regions deep thaws with intensive rainfalls are observed against a background of negative winter air temperature. These conditions can trigger debris-flows during winter months. In the territory of the USA all-the-year-round DFDP is observed in the Appalachia south of the Hudson river, in the western and central parts of the Rocky Mountains (Figure 2). In the Rocky Mountains DFDP begins in February-March in the south and in April in the north, in the highest parts in May. It finishes in October and in New- Mexico in November. In New England DFDP continues from April-May to October-November. There are three major groups of region types in the USA, having close climatic characteristics. The first group is typical for regions with cold winters. EDGDP is determined under influence of both air temperature and precipitation. These conditions are presented in the Rocky Mountains and in New England (Figure 3). In the
 in")

5 Figure 2. First month of DFDP (-1 all-year-round DFDP) in scale 1: Figure 3. Region types having similar climatic conditions favourable for debris-flow formation in scale 1:


6 Figure 4. First month of EDFDP in scale 1: Figure 5. Last month of EDFDP in scale 1:
7 Rocky Mountains of Montana, Wyoming and Idaho the continental climate with insufficient summer humidity conditions causes the existing the region types #13 and #6. The Front Range in Colorado is a barrier for cyclones and redundant summer humidity conditions and high altitudes cause appearance of region type #2. EDFDP observed in summer months from June to August (Figures 4-5). In New England the combination of cold winters and cold summers with redundant summer humidity conditions determines the region type #9. EDFDP holds from June to August. The second group is observed in regions with combination of warm winters with proportional precipitation distribution during a year. In this case monthly distribution of debris-flow events has a better correlation with warm year period precipitations. It is the most widespread group of dependency of monthly distribution of debrisflow events on climatic parameters in the USA. Dry continental regions of the Great Basin and the Colorado Plateau have dry continental climate with small sums of precipitations both in summer and winter months. On great areas region type #15 spreads (Figure 3). EDFDP occurs in summer months from May to June, in the Colorado Plateau from July to August-September. In the Appalachia south of the Hudson river against a background of all-the-year-round midlatitude cyclones significant precipitation sums observe in all months. Warm winter and summer in combination with redundant summer humidity conditions define region type #10. The most debris-flow danger months are also in summer (July-August) (Figures 4-5). The third group is typical for regions with subtropical and tropical climates and for moderate climate where there are no negative mean monthly air temperatures. The formation of monthly debris-flow events distribution depends only on precipitations patterns. In coast areas of California, western foothills of the Sierra Nevada, hills in Arizona and New-Mexico deserts and semi-deserts landscapes dominate, region types #19 and #20 have been identified (Figure 3). California has subtropical mediterranean climate with dry summer season and rainy winter months. The most debris-flow danger months are winter here. EDFDP occurs from December-January to February-March. The central and the south regions of Arizona have tropical climate with precipitation maximum in summer. EDFDP continues from July to August. On windward mountainsides of Washington, redundant summer humidity conditions (H 1.3) are to be found, which are typical of region type #11 (Figure 3). On leeward mountainsides of the Cascade Range, in the Sierra Nevada, and in the Coast Range north of San Francisco, the climate becomes drier, and the region type #16 has been determined.. The most debris-flow danger months are November, December and January. In conclusion, it is important to note that all region types observed in the investigated territory of the USA except #7 and #19 have the regionsanalogue in the territory of the USSR. For model developing the data from Los-Angeles region has been used for region type #19. The region types #7, #11, #17 and #20 are least secured by data. The calculated results for these territories are the most suspected. In general for validation of the model results the long-term debris-flow observed data is required for the investigated area. The author hopes that as the necessary information being collected the validation of the calculation results for the USA territory and possible updating of the model will be performed. 5. CONCLUSIONS Using the geographical approach in modeling allows making spatial assessments of phenomena having insufficient actual data. The described model has climatic parameters as input data that allows using it also for scenarios of climate change. The presented work is an example of small-scale hazard mapping as a result of model s calculations. These results are needed to be validated by the long-term debris-flow observed data. 6. REFERENCES Belaya N.L., Distribution model for periods of debris-flow danger Debris-Flow Hazards Mitigation: Mechanics, Prediction and Assessment. Proceedings of the third intern. Confer. On Debris-Flow hazards mitigation 2003, cтр Hromov, S.P. & Petrosyants, М.А Meteorology and climatology. Moscow: Moscow State University. Mygkov, S.M. (ed.) Geographia lavin. Мoscow: Moscow State University. New M., Hulme M. and Jones P. (1999) Representing twentieth century space-time climate variability. Part 1: Development of a mean monthly terrestrial climatology J.Climate 12, Perov V.F., Artyukhova, I.A., Budarina, O.I., Glazovskaya, T.G. & Sidorova, T.L Map of the world mudflow phenomena. In Cheng-lung Chen (ed), Debris-Flow Hazards Mitigation: Mechanics, Prediction, and Assessment. New York. ASCE:
8
Climate Classification
 Chapter 15: World Climates The Atmosphere: An Introduction to Meteorology, 12 th Lutgens Tarbuck Lectures by: Heather Gallacher, Cleveland State University Climate Classification Köppen classification:
March 1, 2003 Western Snowpack Conditions and Water Supply Forecasts
 Natural Resources Conservation Service National Water and Climate Center 101 SW Main Street, Suite 1600 Portland, OR 97204-3224 Date: March 17, 2003 Subject: March 1, 2003 Western Snowpack Conditions and
The following information is provided for your use in describing climate and water supply conditions in the West as of April 1, 2003.
 Natural Resources Conservation Service National Water and Climate Center 101 SW Main Street, Suite 1600 Portland, OR 97204-3224 Date: April 8, 2003 Subject: April 1, 2003 Western Snowpack Conditions and
Tropical Moist Rainforest
 Tropical or Lowlatitude Climates: Controlled by equatorial tropical air masses Tropical Moist Rainforest Rainfall is heavy in all months - more than 250 cm. (100 in.). Common temperatures of 27 C (80 F)
Energy Systems, Structures and Processes Essential Standard: Analyze patterns of global climate change over time Learning Objective: Differentiate
 Energy Systems, Structures and Processes Essential Standard: Analyze patterns of global climate change over time Learning Objective: Differentiate between weather and climate Global Climate Focus Question
Module 11: Meteorology Topic 3 Content: Climate Zones Notes
 Introduction Latitude is such an important climate factor that you can make generalizations about a location's climate based on its latitude. Areas near the equator or the low latitudes are generally hot
Our climate system is based on the location of hot and cold air mass regions and the atmospheric circulation created by trade winds and westerlies.
 CLIMATE REGIONS Have you ever wondered why one area of the world is a desert, another a grassland, and another a rainforest? Or have you wondered why are there different types of forests and deserts with
Climate Chapter 19. Earth Science, 10e. Stan Hatfield and Ken Pinzke Southwestern Illinois College
 Climate Chapter 19 Earth Science, 10e Stan Hatfield and Ken Pinzke Southwestern Illinois College The climate system A. Climate is an aggregate of weather B. Involves the exchanges of energy and moisture
Keys to Climate Climate Classification Low Latitude Climates Midlatitude Climates High Latitude Climates Highland Climates Our Changing Climate
 Climate Global Climates Keys to Climate Climate Classification Low Latitude Climates Midlatitude Climates High Latitude Climates Highland Climates Our Changing Climate Keys to Climate Climate the average
Earth s Climates. Understanding Weather and Climate. Chapter 15 Lecture. Seventh Edition
 Chapter 15 Lecture Understanding Weather and Climate Seventh Edition Earth s Climates Frode Stordal, University of Oslo Redina L. Herman Western Illinois University Climate and Controlling Factors Climate
Weather and Climate Summary and Forecast March 2018 Report
 Weather and Climate Summary and Forecast March 2018 Report Gregory V. Jones Linfield College March 7, 2018 Summary: The ridge pattern that brought drier and warmer conditions from December through most
Monthly Long Range Weather Commentary Issued: February 15, 2015 Steven A. Root, CCM, President/CEO
 Monthly Long Range Weather Commentary Issued: February 15, 2015 Steven A. Root, CCM, President/CEO sroot@weatherbank.com JANUARY 2015 Climate Highlights The Month in Review During January, the average
Weather and Climate Summary and Forecast November 2017 Report
 Weather and Climate Summary and Forecast November 2017 Report Gregory V. Jones Linfield College November 7, 2017 Summary: October was relatively cool and wet north, while warm and very dry south. Dry conditions
Meteorology. Chapter 15 Worksheet 1
 Chapter 15 Worksheet 1 Meteorology Name: Circle the letter that corresponds to the correct answer 1) The Tropic of Cancer and the Arctic Circle are examples of locations determined by: a) measuring systems.
Lecture Outlines PowerPoint. Chapter 20 Earth Science 11e Tarbuck/Lutgens
 Lecture Outlines PowerPoint Chapter 20 Earth Science 11e Tarbuck/Lutgens 2006 Pearson Prentice Hall This work is protected by United States copyright laws and is provided solely for the use of instructors
Weather and Climate Summary and Forecast Winter
 Weather and Climate Summary and Forecast Winter 2016-17 Gregory V. Jones Southern Oregon University February 7, 2017 What a difference from last year at this time. Temperatures in January and February
Monthly Long Range Weather Commentary Issued: NOVEMBER 16, 2015 Steven A. Root, CCM, Chief Analytics Officer, Sr. VP, sales
 Monthly Long Range Weather Commentary Issued: NOVEMBER 16, 2015 Steven A. Root, CCM, Chief Analytics Officer, Sr. VP, sales sroot@weatherbank.com OCTOBER 2015 Climate Highlights The Month in Review The
DEPARTMENT OF EARTH & CLIMATE SCIENCES Name SAN FRANCISCO STATE UNIVERSITY Nov 29, ERTH 360 Test #2 200 pts
 DEPARTMENT OF EARTH & CLIMATE SCIENCES Name SAN FRANCISCO STATE UNIVERSITY Nov 29, 2018 ERTH 360 Test #2 200 pts Each question is worth 4 points. Indicate your BEST CHOICE for each question on the Scantron
Weather and Climate Summary and Forecast Winter
 Weather and Climate Summary and Forecast Winter 2016-17 Gregory V. Jones Southern Oregon University December 5, 2016 Well after an October that felt more like November, we just finished a November that
Monthly Long Range Weather Commentary Issued: APRIL 1, 2015 Steven A. Root, CCM, President/CEO
 Monthly Long Range Weather Commentary Issued: APRIL 1, 2015 Steven A. Root, CCM, President/CEO sroot@weatherbank.com FEBRUARY 2015 Climate Highlights The Month in Review The February contiguous U.S. temperature
16 Global Climate. Learning Goals. Summary. After studying this chapter, students should be able to:
 16 Global Climate Learning Goals After studying this chapter, students should be able to: 1. associate the world s six major vegetation biomes to climate (pp. 406 408); 2. describe methods for classifying
Mozambique. General Climate. UNDP Climate Change Country Profiles. C. McSweeney 1, M. New 1,2 and G. Lizcano 1
 UNDP Climate Change Country Profiles Mozambique C. McSweeney 1, M. New 1,2 and G. Lizcano 1 1. School of Geography and Environment, University of Oxford. 2.Tyndall Centre for Climate Change Research http://country-profiles.geog.ox.ac.uk
Mediterranean Climates (Csa, Csb)
") Climatic Zones & Types Part II I've lived in good climate, and it bores the hell out of me. I like weather rather than climate. 1 John Steinbeck Mediterranean Climates (Csa, Csb) Main locations Western
Climatic Zones & Types Part II I've lived in good climate, and it bores the hell out of me. I like weather rather than climate. 1 John Steinbeck Mediterranean Climates (Csa, Csb) Main locations Western
CHAPTER 1: INTRODUCTION
 CHAPTER 1: INTRODUCTION There is now unequivocal evidence from direct observations of a warming of the climate system (IPCC, 2007). Despite remaining uncertainties, it is now clear that the upward trend
Weather and Climate Summary and Forecast January 2018 Report
 Weather and Climate Summary and Forecast January 2018 Report Gregory V. Jones Linfield College January 5, 2018 Summary: A persistent ridge of high pressure over the west in December produced strong inversions
Weather and Climate Summary and Forecast Summer 2017
 Weather and Climate Summary and Forecast Summer 2017 Gregory V. Jones Southern Oregon University August 4, 2017 July largely held true to forecast, although it ended with the start of one of the most extreme
Weather and Climate Summary and Forecast February 2018 Report
 Weather and Climate Summary and Forecast February 2018 Report Gregory V. Jones Linfield College February 5, 2018 Summary: For the majority of the month of January the persistent ridge of high pressure
Fig Major air masses of the world
 Fig. 9.3 Major air masses of the world CLASSIFICATION FOUR BASIC CATEGORIES OF AIR MASSES: POLAR - P ARCTIC - A TROPICAL - T EQUATORIAL - E TWO DESIGNATIONS OF SURFACE IN SOURCE REGION MARITIME - m. CONTINENTAL
Chapter 3 Section 3 World Climate Regions In-Depth Resources: Unit 1
 Guided Reading A. Determining Cause and Effect Use the organizer below to show the two most important causes of climate. 1. 2. Climate B. Making Comparisons Use the chart below to compare the different
Drought Monitoring in Mainland Portugal
 Drought Monitoring in Mainland Portugal 1. Accumulated precipitation since 1st October 2014 (Hydrological Year) The accumulated precipitation amount since 1 October 2014 until the end of April 2015 (Figure
Weather and Climate Summary and Forecast October 2017 Report
 Weather and Climate Summary and Forecast October 2017 Report Gregory V. Jones Linfield College October 4, 2017 Summary: Typical variability in September temperatures with the onset of fall conditions evident
Global Climates. Name Date
 Global Climates Name Date No investigation of the atmosphere is complete without examining the global distribution of the major atmospheric elements and the impact that humans have on weather and climate.
Weather and Climate Summary and Forecast Summer 2016
 Weather and Climate Summary and Forecast Summer 2016 Gregory V. Jones Southern Oregon University June 6, 2016 May 2016 continued the warm trend for portions of the west, while providing some relief for
National Wildland Significant Fire Potential Outlook
 National Wildland Significant Fire Potential Outlook National Interagency Fire Center Predictive Services Issued: September, 2007 Wildland Fire Outlook September through December 2007 Significant fire
Weather and Climate Summary and Forecast April 2018 Report
 Weather and Climate Summary and Forecast April 2018 Report Gregory V. Jones Linfield College April 4, 2018 Summary: A near Miracle March played out bringing cooler and wetter conditions to the majority
L.O Students will learn about factors that influences the environment
 Name L.O Students will learn about factors that influences the environment Date 1. At the present time, glaciers occur mostly in areas of A) high latitude or high altitude B) low latitude or low altitude
PART II. Physical Landscape Chapters 2 5 CLIMATE CLIMATE STUDYING CLIMATE R E M I N D E R S. PART II: People and their Physical Environment 10/26/2017
 R E M I N D E R S Two required essays are due by Nov. 13, 2017. (A third may be used for extra credit in place of a Think Geographically essay.) ESSAY TOPIS (choose any two): ontributions of a noted geographer,
Climate.tgt, Version: 1 1
 Name: Key Concepts Choose the letter of the best answer. (5 points each) 1. 2. 3. 4. 5. 6. 7. 8. 9. 10. Date: A city located in the middle of North America experiences extreme temperature changes during
Colorado State University, Fort Collins, CO Weather Station Monthly Summary Report
 Colorado State University, Fort Collins, CO Weather Station Monthly Summary Report Month: December Year: 2017 Temperature: Mean T max was 47.2 F which is 4.4 above the 1981-2010 normal for the month. This
Lab Activity: Climate Variables
 Name: Date: Period: Water and Climate The Physical Setting: Earth Science Lab Activity: Climate Variables INTRODUCTION:! The state of the atmosphere continually changes over time in response to the uneven
Climate Dataset: Aitik Closure Project. November 28 th & 29 th, 2018
 1 Climate Dataset: Aitik Closure Project November 28 th & 29 th, 2018 Climate Dataset: Aitik Closure Project 2 Early in the Closure Project, consensus was reached to assemble a long-term daily climate
CLIMATE DEFINED CLIMATE INFLUENCES STUDYING CLIMATE R E M I N D E R S. PART II: People and their 10/19/2018
 R E M I N D E R S Two required essays are due by Oct. 30, 2018. (A third may be used for extra credit in place of a Think Geographically essay.) ESSAY TOPIS (choose any two): ontributions of a noted geographer,
World Geography Chapter 3
 World Geography Chapter 3 Section 1 A. Introduction a. Weather b. Climate c. Both weather and climate are influenced by i. direct sunlight. ii. iii. iv. the features of the earth s surface. B. The Greenhouse
CLIMATE CLIMATE STUDYING CLIMATE. PART II: People and their 3/20/2018. GEOG 101 Part II People and their Physical Environment R E M I N D E R S
 Two required essays are due by March 27, 2018. (A third may be used for extra credit in place of a Think Geographically essay.) ESSAY TOPIS (choose any two): ontributions of a noted geographer, earth scientist
Funding provided by NOAA Sectoral Applications Research Project CLIMATE. Basic Climatology Colorado Climate Center
 Funding provided by NOAA Sectoral Applications Research Project CLIMATE Basic Climatology Colorado Climate Center Remember These? Factor 1: Our Energy Source Factor 2: Revolution & Tilt Factor 3: Rotation!
 Page 1 of 5 Home research global climate enso effects Research Effects of El Niño on world weather Precipitation Temperature Tropical Cyclones El Niño affects the weather in large parts of the world. The
Weather and Climate Summary and Forecast March 2019 Report
 Weather and Climate Summary and Forecast March 2019 Report Gregory V. Jones Linfield College March 2, 2019 Summary: Dramatic flip from a mild winter to a top five coldest February on record in many locations
Upper Missouri River Basin December 2017 Calendar Year Runoff Forecast December 5, 2017
 Upper Missouri River Basin December 2017 Calendar Year Runoff Forecast December 5, 2017 Calendar Year Runoff Forecast Explanation and Purpose of Forecast U.S. Army Corps of Engineers, Northwestern Division
MET 3102-U01 PHYSICAL CLIMATOLOGY (ID 17901) Lecture 14
 Lecture 14") MET 3102-U01 PHYSICAL CLIMATOLOGY (ID 17901) Lecture 14 The hydrologic cycle evaporation vapor transport precipitation precipitation evaporation runoff Evaporation, precipitation, etc. in cm Vapor transported
MET 3102-U01 PHYSICAL CLIMATOLOGY (ID 17901) Lecture 14 The hydrologic cycle evaporation vapor transport precipitation precipitation evaporation runoff Evaporation, precipitation, etc. in cm Vapor transported
Arizona Climate Summary February 2012
 Arizona Climate Summary February 2012 Summary of conditions for January 2012 January 2012 Temperature and Precipitation Summary January 1 st 20 th : The New Year has started on a very dry note. The La
ARUBA CLIMATOLOGICAL SUMMARY 2014 PRECIPITATION
 ARUBA CLIMATOLOGICAL SUMMARY 2014 PRECIPITATION The total amount of rainfall recorded at Reina Beatrix International Airport for the year 2014 was 309.2 mm. This is 34.4 % below normal ( Figure 1 ). During
Weather and Climate Summary and Forecast December 2017 Report
 Weather and Climate Summary and Forecast December 2017 Report Gregory V. Jones Linfield College December 5, 2017 Summary: November was relatively cool and wet from central California throughout most of
All objects emit radiation. Radiation Energy that travels in the form of waves Waves release energy when absorbed by an object. Earth s energy budget
 Radiation Energy that travels in the form of waves Waves release energy when absorbed by an object Example: Sunlight warms your face without necessarily heating the air Shorter waves carry more energy
CLIMATE. UNIT TWO March 2019
 CLIMATE UNIT TWO March 2019 OUTCOME 9.2.1Demonstrate an understanding of the basic features of Canada s landscape and climate. identify and locate major climatic regions of Canada explain the characteristics
forest tropical jungle swamp marsh prairie savanna pampas Different Ecosystems (rainforest)
") Different Ecosystems forest A region of land that is covered with many trees and shrubs. tropical jungle (rainforest) swamp A region with dense trees and a variety of plant life. It has a tropical climate.
Different Ecosystems forest A region of land that is covered with many trees and shrubs. tropical jungle (rainforest) swamp A region with dense trees and a variety of plant life. It has a tropical climate.
Weather and Climate Summary and Forecast October 2018 Report
 Weather and Climate Summary and Forecast October 2018 Report Gregory V. Jones Linfield College October 4, 2018 Summary: Much of Washington, Oregon, coastal California and the Bay Area and delta region
Prentice Hall EARTH SCIENCE
 Prentice Hall EARTH SCIENCE Tarbuck Lutgens Chapter 21 Climate 21.1 Factors That Affect Climate Factors That Affect Climate Latitude As latitude increases, the intensity of solar energy decreases. The
Lecture #14 March 29, 2010, Monday. Air Masses & Fronts
 Lecture #14 March 29, 2010, Monday Air Masses & Fronts General definitions air masses source regions fronts Air masses formation types Fronts formation types Air Masses General Definitions a large body
Name Period Date. Analyzing Climographs
 Name Period Date Analyzing Climographs Climographs: It is often helpful to plot two different types of data on the same graph. For example, a climograph is a single graph that charts both the average temperature
Prentice Hall EARTH SCIENCE
 Prentice Hall EARTH SCIENCE Tarbuck Lutgens Chapter 21 Climate 21.1 Factors That Affect Climate Factors That Affect Climate Latitude As latitude increases, the intensity of solar energy decreases. The
Potential impacts of aerosol and dust pollution acting as cloud nucleating aerosol on water resources in the Colorado River Basin
 Potential impacts of aerosol and dust pollution acting as cloud nucleating aerosol on water resources in the Colorado River Basin Vandana Jha, W. R. Cotton, and G. G. Carrio Colorado State University,
Antigua and Barbuda. General Climate. Recent Climate Trends. UNDP Climate Change Country Profiles. Temperature
 UNDP Climate Change Country Profiles Antigua and Barbuda C. McSweeney 1, M. New 1,2 and G. Lizcano 1 1. School of Geography and Environment, University of Oxford. 2. Tyndall Centre for Climate Change Research
Monthly Long Range Weather Commentary Issued: APRIL 18, 2017 Steven A. Root, CCM, Chief Analytics Officer, Sr. VP,
 Monthly Long Range Weather Commentary Issued: APRIL 18, 2017 Steven A. Root, CCM, Chief Analytics Officer, Sr. VP, sroot@weatherbank.com MARCH 2017 Climate Highlights The Month in Review The average contiguous
What is Climate? Understanding and predicting climatic changes are the basic goals of climatology.
 What is Climate? Understanding and predicting climatic changes are the basic goals of climatology. Climatology is the study of Earth s climate and the factors that affect past, present, and future climatic
Climate Classification Chapter 7
 Climate Classification Chapter 7 Climate Systems Earth is extremely diverse No two places exactly the same Similarities between places allow grouping into regions Climates influence ecosystems Why do we
Cuba. General Climate. Recent Climate Trends. UNDP Climate Change Country Profiles. Temperature. C. McSweeney 1, M. New 1,2 and G.
 UNDP Climate Change Country Profiles Cuba C. McSweeney 1, M. New 1,2 and G. Lizcano 1 1. School of Geography and Environment, University of Oxford. 2. Tyndall Centre for Climate Change Research http://country-profiles.geog.ox.ac.uk
Bugs in JRA-55 snow depth analysis
 14 December 2015 Climate Prediction Division, Japan Meteorological Agency Bugs in JRA-55 snow depth analysis Bugs were recently found in the snow depth analysis (i.e., the snow depth data generation process)
The Global Scope of Climate. The Global Scope of Climate. Keys to Climate. Chapter 8
 The Global Scope of Climate Chapter 8 The Global Scope of Climate In its most general sense, climate is the average weather of a region, but except where conditions change very little during the course
Monthly Long Range Weather Commentary Issued: SEPTEMBER 19, 2016 Steven A. Root, CCM, Chief Analytics Officer, Sr. VP,
 Monthly Long Range Weather Commentary Issued: SEPTEMBER 19, 2016 Steven A. Root, CCM, Chief Analytics Officer, Sr. VP, sroot@weatherbank.com SEPTEMBER 2016 Climate Highlights The Month in Review The contiguous
Northwest Outlook October 2016
 Northwest Outlook October 2016 Rainfall Opportunities and Challenges Rainfall over the month of September presented some challenges for the fall harvest while other producers benefitted. Figure 1a shows
Weather Atmospheric condition in one place during a limited period of time Climate Weather patterns that an area typically experiences over a long
 Weather Atmospheric condition in one place during a limited period of time Climate Weather patterns that an area typically experiences over a long period of time Many factors influence weather & climate
Trends and Variability of Climatic Parameters in Vadodara District
 GRD Journals Global Research and Development Journal for Engineering Recent Advances in Civil Engineering for Global Sustainability March 2016 e-issn: 2455-5703 Trends and Variability of Climatic Parameters
Analysis of Historical Pattern of Rainfall in the Western Region of Bangladesh
 24 25 April 214, Asian University for Women, Bangladesh Analysis of Historical Pattern of Rainfall in the Western Region of Bangladesh Md. Tanvir Alam 1*, Tanni Sarker 2 1,2 Department of Civil Engineering,
Brita Horlings
 Knut Christianson Brita Horlings brita2@uw.edu https://courses.washington.edu/ess431/ Natural Occurrences of Ice: Distribution and environmental factors of seasonal snow, sea ice, glaciers and permafrost
Weather and Climate Summary and Forecast Summer 2016
 Weather and Climate Summary and Forecast Summer 2016 Gregory V. Jones Southern Oregon University August 5, 2016 The month of July saw the continued flip, flop of the western US temperatures. It was warm
Champaign-Urbana 2001 Annual Weather Summary
 Champaign-Urbana 2001 Annual Weather Summary ILLINOIS STATE WATER SURVEY 2204 Griffith Dr. Champaign, IL 61820 wxobsrvr@sws.uiuc.edu Maria Peters, Weather Observer January: After a cold and snowy December,
National Wildland Significant Fire Potential Outlook
 National Wildland Significant Fire Potential Outlook National Interagency Fire Center Predictive Services Issued: April 1, 2008 Next Issue: May 1, 2008 Wildland Fire Outlook April 2008 through July 2008
A summary of the weather year based on data from the Zumwalt weather station
 ZUMWALT PRAIRIE WEATHER 2016 A summary of the weather year based on data from the Zumwalt weather station Figure 1. An unusual summer storm on July 10, 2016 brought the second-largest precipitation day
Weather and Climate Summary and Forecast August 2018 Report
 Weather and Climate Summary and Forecast August 2018 Report Gregory V. Jones Linfield College August 5, 2018 Summary: July 2018 will likely go down as one of the top five warmest July s on record for many
Long-Term Trend of Summer Rainfall at Selected Stations in the Republic of Korea
 Long-Term Trend of Summer Rainfall at Selected Stations in the Republic of Korea Il-Kon Kim Professor, Department of Region Information Rafique Ahmed Professor, Geography and Earth Science Silla University
Bell Work. REVIEW: Our Planet Earth Page 29 Document A & B Questions
 9.12.16 Bell Work REVIEW: Our Planet Earth Page 29 Document A & B Questions Intro to Climate & Weather https://www.youtube.com/watch?v=vhgyoa70q7y Weather vs. Climate Video Climate & Weather 3.1 Weather
Meteorology. Circle the letter that corresponds to the correct answer
 Chapter 3 Worksheet 1 Meteorology Name: Circle the letter that corresponds to the correct answer 1) If the maximum temperature for a particular day is 26 C and the minimum temperature is 14 C, the daily
PART II. Physical Landscape Chapters 2 5 CLIMATE CLIMATE STUDYING CLIMATE R E M I N D E R S. PART II: People and their Physical Environment 10/19/2017
 R E M I N D E R S Two required essays are due by Nov. 13, 2017. (A third may be used for extra credit in place of a Think Geographically essay.) ESSAY TOPIS (choose any two): ontributions of a noted geographer,
Chiang Rai Province CC Threat overview AAS1109 Mekong ARCC
 Chiang Rai Province CC Threat overview AAS1109 Mekong ARCC This threat overview relies on projections of future climate change in the Mekong Basin for the period 2045-2069 compared to a baseline of 1980-2005.
Weather and Climate Summary and Forecast January 2019 Report
 Weather and Climate Summary and Forecast January 2019 Report Gregory V. Jones Linfield College January 4, 2019 Summary: December was mild and dry over much of the west, while the east was much warmer than
Investigation IV: Seasonal Precipitation and Seasonal Surface Runoff in the US
 Investigation IV: Seasonal Precipitation and Seasonal Surface Runoff in the US Purpose Students will consider the seasonality of precipitation and surface runoff and think about how the time of year can
Variability Across Space
 Variability and Vulnerability of Western US Snowpack Potential impacts of Climactic Change Mark Losleben, Kurt Chowanski Mountain Research Station, University of Colorado Introduction The Western United
Climates of Earth. Lesson Outline LESSON 1. A. What is climate? 1. is the long-term average weather conditions that occur in a particular region.
 Lesson Outline LESSON 1 A. What is climate? 1. is the long-term average weather conditions that occur in a particular region. 2. Climate depends on how average weather conditions throughout the year. B.
Mid-latitude Cyclones & Air Masses
 Lab 9 Mid-latitude Cyclones & Air Masses This lab will introduce students to the patterns of surface winds around the center of a midlatitude cyclone of low pressure. The types of weather associated with
Weather and Climate Summary and Forecast Fall/Winter 2016
 Weather and Climate Summary and Forecast Fall/Winter 2016 Gregory V. Jones Southern Oregon University November 5, 2016 After a year where we were seemingly off by a month in terms of temperatures (March
Sierra Weather and Climate Update
 Sierra Weather and Climate Update 2014-15 Kelly Redmond Western Regional Climate Center Desert Research Institute Reno Nevada Yosemite Hydroclimate Workshop Yosemite Valley, 2015 October 8-9 Percent of
Prediction of Snow Water Equivalent in the Snake River Basin
 Hobbs et al. Seasonal Forecasting 1 Jon Hobbs Steve Guimond Nate Snook Meteorology 455 Seasonal Forecasting Prediction of Snow Water Equivalent in the Snake River Basin Abstract Mountainous regions of
GLOBAL CLIMATES FOCUS
 which you will learn more about in Chapter 6. Refer to the climate map and chart on pages 28-29 as you read the rest of this chapter. FOCUS GLOBAL CLIMATES What are the major influences on climate? Where
Climates of NYS. Definitions. Climate Regions of NYS. Storm Tracks. Climate Controls 10/13/2011. Characteristics of NYS s Climates
 Definitions Climates of NYS Prof. Anthony Grande 2011 Weather and Climate Weather the state of the atmosphere at one point in time. The elements of weather are temperature, air pressure, wind and moisture.
St Lucia. General Climate. Recent Climate Trends. UNDP Climate Change Country Profiles. Temperature. Precipitation
 UNDP Climate Change Country Profiles St Lucia C. McSweeney 1, M. New 1,2 and G. Lizcano 1 1. School of Geography and Environment, University of Oxford. 2. Tyndall Centre for Climate Change Research http://country-profiles.geog.ox.ac.uk
Geographical location and climatic condition of the
 Geographical location and climatic condition of the study sites North eastern region of India is comprised of eight states namely; Arunachal Pradesh, Assam, Manipur, Meghalaya, Mizoram, Nagaland, Sikkim
Drought in Southeast Colorado
 Drought in Southeast Colorado Nolan Doesken and Roger Pielke, Sr. Colorado Climate Center Prepared by Tara Green and Odie Bliss http://climate.atmos.colostate.edu 1 Historical Perspective on Drought Tourism
What factors affect climate? Dr. Michael J Passow
 What factors affect climate? Dr. Michael J Passow Energy from the Sun (mostly light and heat) radiates to Earth SUN 150 x 10 6 km (92 x 10 6 mi) EARTH Challenge: If the speed of light is 300,000 km/sec,
Constructing a typical meteorological year -TMY for Voinesti fruit trees region and the effects of global warming on the orchard ecosystem
 Constructing a typical meteorological year -TMY for Voinesti fruit trees region and the effects of global warming on the orchard ecosystem ARMEANU ILEANA*, STĂNICĂ FLORIN**, PETREHUS VIOREL*** *University
Weather History on the Bishop Paiute Reservation
 Weather History on the Bishop Paiute Reservation -211 For additional information contact Toni Richards, Air Quality Specialist 76 873 784 toni.richards@bishoppaiute.org Updated 2//214 3:14 PM Weather History