Relationship between weather factors and survival of mule deer fawns in the Peace Region of British Columbia
|
|
|
- Estella Shaw
- 5 years ago
- Views:
Transcription

1 P E A C E R E G I O N T E C H N I C A L R E P O R T Relationship between weather factors and survival of mule deer fawns in the Peace Region of British Columbia by: Nick Baccante and Robert B. Woods Fish and Wildlife Section Ministry of Environment th Avenue Fort St. John BC, V1J 6M7 December 28 F I S H & W I L D L I F E S E C T I O N
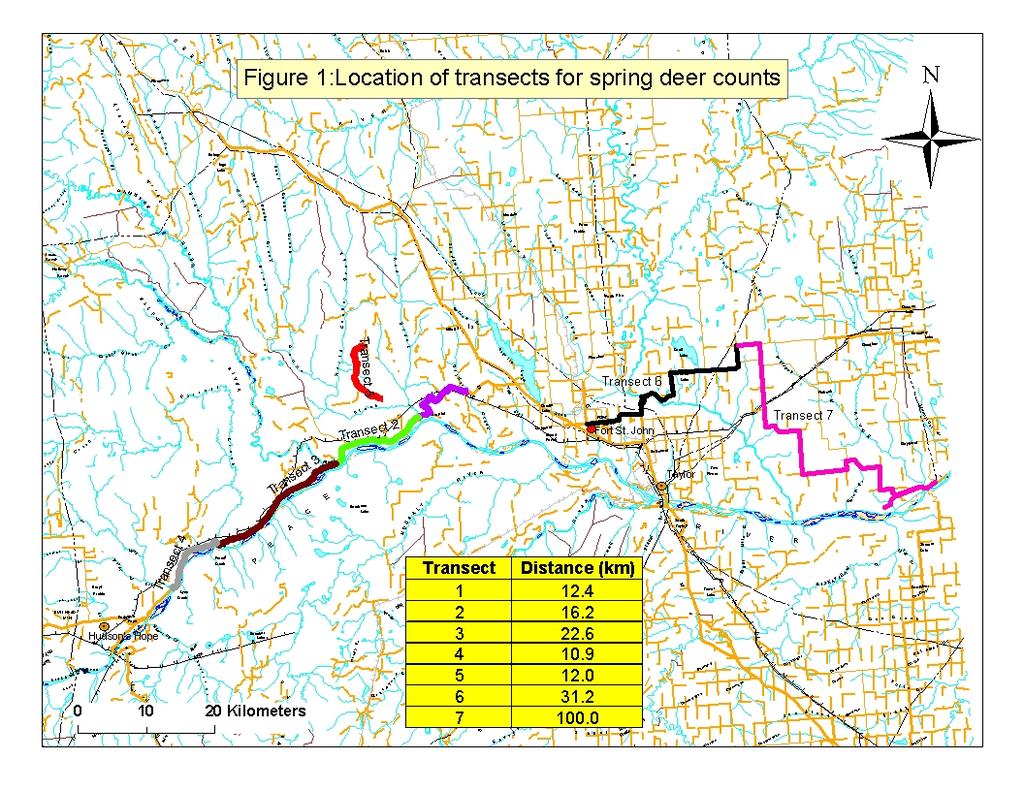
2 INTRODUCTION Mule deer (Odocoileus hemionus) are relatively abundant in the large agricultural area surrounding the Peace River valley in north-eastern British Columbia. They are important economically, as a game species, and ecologically, as part of the richly diverse ecosystems in this area. Mule deer, like other cervids, rut during the fall and fawns are born in June. Survival of fawns into the next year is greatly affected by snow and temperature conditions through their first winter. A number of studies have measured fawn survival through their first winter with the use of recapture data collected by collaring animals (Pojar and Bowden 24; Bishop et al. 25; Lomas and Bender 26). Our study does not measure survival directly, rather, we report annual counts of fawns as a relative measure of survival at the neonatal stage, and relate those differences to winter weather conditions just prior to birth. We do not track survival of these fawns over time. METHODS Annual spring counts of mule deer in the Peace Region have occurred since Counts are done by driving a vehicle along selected transects (Figure 1), these are roads that have good vantage points and cover known areas of high use by mule deer. Timing of the survey usually ranges from about mid-april to the first week in May. The vehicle is stopped
3 whenever deer are observed and observers (1-2 people) use spotting scopes to count and classify deer by sex and age class. From 1991 to 23 five transects (Lomas and Bender 27;Bishop; Unsworth, and Garton 25;Pojar and Bowden 24)were sampled varying in length between 12 and 16 km. In 24 an additional transect 31 km. long was added, and in 25 one more transect 1 km long was added. The number of transects has remained unchanged since 25, and we don t anticipate adding any more. Weather data, consisting of monthly summaries of mean, maximum and mean air temperatures, and snow precipitation, was obtained from the Environment Canada website ( ). The data used is for the Fort St. John, B.C. airport, which is the closest station to the study area. Following a methodology used by Ian Hatter (Ministry of Environment, Victoria, B.C., pers. comm.), we calculated a Winter Severity Index (WSI). The WSI integrates snowfall (centimetres) and air temperature ( o C) to quantify the impact of winter on fawns. The WSI is calculated by multiplying the snow precipitation (SNOW) by a factor which is dependent on temperature (TEMP): WSI = 4*(SNOW) if TEMP < -25 o C WSI = 3*(SNOW) if TEMP < -15 o C WSI = 2*(SNOW) if TEMP < -5 o C WSI = 1*(SNOW) if TEMP > 5 o C
4 Online weather data was available back to 1976, and temperatures, snowfall and WSI values were summarized monthly for the period starting November 1 to April 3 for each year. It is important to note that, the WSI represents the integration of weather data starting in November of one calendar year, to the end of April the following calendar year. For example, the year 1977 would represent the winter of , but in the figures and tables it would be represented as Lower values of the WSI represent milder winters, with lower snow precipitation and/or milder temperatures. RESULTS Data showing the total number of mule deer counted each spring, for all transects, are summarized in Table 1. Table 2 provides a further breakdown of the data by year, sex class and transect numbers. Winter Severity Index (WSI) values were calculated from weather data for the years that deer counts are available, and summarized in Table 3. Both WSI and fawn-to-doe ratios are plotted in Figure 2. The fawn-to-doe ratio is regressed against WSI in Figure 3. The plot shows a significant relationship with a negative slope of the fitted line, indicating higher fawn numbers in milder winters. Approximately 59 percent of the variation in fawn-to-doe ratios is explained by variations in the WSI. Categories are shown on the graph with dotted lines to indicate values of good fawn survival and mild, moderate and severe winter, based on the WSI. Using categories shown in Figure 3, during mild winters, characterized by WSI values of less than 35, the average
5 ratio of fawns per 1 does is 43. During moderate winters, WSI between 35 and 7, the average ratio is 18, and in severe winters, above 7, the average ratio is 14. Comparisons of plotted values of fawn-to-doe ratios over time, for each of the transects, indicate that trends are fairly similar for transects 1 through 4 (Figure 5). This is indicative of the fact that all of these transects are located along the Peace River, therefore have very similar habitats and weather conditions. Transect 5, which is located away from the river valley, in different habitats, shows some different trends from the others. Transects 6 and 7 don t yet have sufficient long-term data to identify trends. DISCUSSION The data from this study support the widely accepted notion among wildlife managers, that early spring survival of mule deer fawns is higher following mild winters. The relationship between fawn-to-doe ratio and WSI supports this hypothesis, with higher fawn ratios in years of less severe winters. There are a few data points that deviate from the fitted line more than others, so we attempted to explain these differences based on available weather data. Figure 6 is a plot of fawn-to-doe ratios against WSI, showing the fitted line and the 95 percent confidence intervals around the line. Most of the observations fall within or close to these confidence limits, four of the observations are well-outside these limits. These points correspond to data from the years 1994, 1996, 1999 and 27.
6 There are certainly many other factors that influence the fawn-to-doe ratios, but weather does appear to play a significant role. In 1994 the fawn-to-doe ratio was higher that expected for the corresponding WSI. For the other three years the ratios were lower than expected. We would therefore expect winter conditions to be milder during 1994 and harsher for 1996, 1999 and 27. More detailed examination of the available weather data show that 1994 had the least amount of snowfall during March and April, compared to all other years. It also had the third-warmest temperatures for March and April. It also had the highest snowfall in January and one of the coldest Januarys compared to other years. Based on these observations, it appears that, despite cold temperatures and high snowfall in January, if conditions in early spring are favourable, it can result in higher fawn-to-doe ratios in the spring. Conversely, the other three years, 1996, 1999 and 27, ranked in the top 23 percent of all the years, based on total snowfall for the period November to April. Also, 1996 and 1999 were colder and snowier than normal in January, while 27 was colder than normal in March and April. Additionally, 1999 had above average snowfall in March and April. These results suggest that the WSI can likely be refined by using different combinations of weather data rather then the combination outlined in the Methods. This will require more detailed analysis beyond the scope of this report. Long-term analysis of weather data suggests that winter weather conditions in the Peace Region are favourable for mule deer survival. We calculated WSI values from available weather data ( ) and found that, the probability of mild winters (based on WSI
7 categories shown in Figure 3) is much higher than moderate or severe. Figure 7 shows the predicted occurrences of mild, moderate and severe winters over a 1-year period, are 6, 37 and 3, respectively. The statistically significant relationship between WSI and fawn-to-doe ratios allows us to back-extrapolate and predict these ratios for years with no observations, other than weather data. Figure 8 shows a plot of observed fawn-to-doe ratios and those predicted using the regression line between WSI and fawn-to-doe ratios. The figure shows that, for the period for which we have available weather data, the occurrence of high fawn-to-doe ratios (>=3, n=43, as categorized in Figure 3), is about twice as many as lower ratios (<3, n=23). This suggests that, high survival of mule deer fawns in this area of the Peace Region occurs twice as many times as lower survival. It will be interesting to continue monitoring this pattern of survival in light of the current anticipated changes to temperatures at a global scale. In an attempt to detect long-term changes in the severity of winter seasons, we plotted the frequency of occurrence of WSI categories, by decade (Figure 9). No apparent trend is visible in this graph, but it will serve as a basis for further monitoring and comparison.
8 CONCLUSIONS Survival of deer fawns is higher after mild winters. Weather conditions in March and April likely more important than winter conditions in determining survival. Winter Survival Index (WSI) is a good integrator of snow and temperature conditions. WSI is a statistically reliable predictor of fawn survival. Ratios equal to, or greater than 3 fawns per 1 does are indicative of mild winters. Based on available weather data, over a 1-year period, 6 years are likely to be mild, 37 moderate and 3 severe. Using WSI as a predictor of fawn survival, over a 1-year period, 65 years are likely to have fawn per 1 does ratios >= 3. WSI data by decade does not suggest any obvious trends, so far. Similar pattern of survival is observed among the survey transects. This project provides very valuable long-term survival data, it will also provide evidence of effects from potential climate change.
9 RECCOMENDATIONS Continue project indefinitely. The cost is extremely low, relative to the benefits. Besides using these data for management of mule deer, some ideas for future analysis could include: Trends in other age and sex classes. Relationship between fawn survival and hunting success in subsequent years. Effects of climate change. ACKNOWLEDGEMENTS Thanks to Ian Hatter, Ministry of Environment, Victoria, B.C. for putting together the Peace Mule Deer Harvest Management Strategy, which includes some of the weather and survival analysis. Also thanks to Conrad Thiessen, Rod Backmeyer and others who have participated in the surveys over the years, Jessica Baccante for entry and analysis of weather data and Heather Hopkins for maintaining our wildlife library.
10 BIBLIOGRAPHY 1. Bishop, C. J.; Unsworth, J. W., and Garton, E. O. Mule Deer Survival among adjacent populations in southwest Idaho. Journal of Wildlife Management. 25; 69(1): Lomas, L. A. and Bender, L. C. Survival and Cause-Specific Mortality of Neonatal Mule Deer Fawns, North-Central New Mexico. The Journal of Wildlife Management. 27; 71(3): Pojar, T. M. and Bowden, D. C. Neonatal Mule Deer Fawn Survival in West-Central Colorado. Journal of Wildlife Management. 24; 68(3):55-56.
11 Table 1. Summary of observed mule deer counted and classified during the spring of each year. No counts were done in Number of Transects Total Transect Length (km) Total Males Total Females Total Fawns Total Unclassified Total Number of Deer Total Fawns per 1 females Total Bucks per 1 females no surveys done
12 Table 2: Summary of observed mule deer by year, transect number and sex classification. Transect Number Sex Class Totals 1991 Male Female Fawns Unclassified Male Female Fawns Unclassified Male Female Fawns Unclassified Male Female Fawns Unclassified 1996 Male Female Fawns Unclassified Male Female Fawns Unclassified 1998 Male Female Fawns Unclassified 1999 Male Female Fawns Unclassified 2 Male Female Fawns Unclassified 21 Male Female Fawns Unclassified 22 Male Female Fawns Unclassified Male Female Fawns Unclassified Male Female Fawns Unclassified 25 Male Female Fawns Unclassified 26 Male Female Fawns Unclassified Male Female Fawns Unclassified Male Female Fawns Unclassified Male Totals Female Totals Fawn Totals Unclassified Totals
13 Table 3. Winter Severity Index (WSI) values for the years that we have deer counts data. WSI
14
15 Figure 2: Winter Severity Index (WSI) and Fawn:Doe ratios for the survey period 1991 to WSI Fawn/Doe Winter Severity Index Fawns/1 Does
16 Figure 3. Plot of Fawn:Doe ratio against WSI. Fitted line and regression equation are also shown. Categories for each variable are shown with dotted lines. 6 mild moderate severe 5 Fawns per 1 Does Fawns Ratio = WSI R 2 =.59 n = 17 r =.77** p < Winter Severity Index
17 Figure 4. Plots of observed fawn-to-doe ratios, by year, for each of the transects. Transect 1: Wilder Ck. to Cache Ck. Transect 2: Cache Ck. to Halfway R. Transect 3: Halfway R. to Farrell Ck Fawns per 1 Does Fawns per 1 Does Fawns per 1 Does Transect 4: Farrell Ck. to Lynx Ck. Transect 5: Lower Cache to Schultie's Transect 6: Cecil Lake to Golata Ck Fawns per 1 Does Fawns per 1 Does Fawns per 1 Does Transect 7: Golata Ck. to Farmington 1 Fawns per 1 Does
18 Figure 5. Plot of mean fawn-to-doe ratios for each transect, by year. The dotted line joins average values for each year. Transect Counts 8 average 6 Fawns per 1 Does
19 Figure 6. Plot of fitted line by regression to fawn-to-doe ratios against WSI. Vertical bars represent 95% confidence limits and selected years are indicated by labels besides the data points. 6 5 Fawns per 1 Does Winter Severity Index 27

20 Figure 7. Predicted occurrence of WSI categories in the study area based on weather data from 1976 to 28.
21 Figure 8. Predicted (triangles) fawn-to-doe ratios based on a regression against WSI. Observed values are represented by circles. Predicted Observed Ratio >=3 n=43 Ratio <3 n=23 Fawns per 1 Does
White-tailed Deer Winter Severity Index Volunteer Winter Weather Monitors Required
 Weather Monitoring White-tailed Deer Winter Severity Index Volunteer Winter Weather Monitors Required The Manitoba Wildlife Federation, in partnership with Manitoba Sustainable Development - Wildlife and
J8.4 TRENDS OF U.S. SNOWFALL AND SNOW COVER IN A WARMING WORLD,
 J8.4 TRENDS OF U.S. SNOWFALL AND SNOW COVER IN A WARMING WORLD, 1948-2008 Richard R. Heim Jr. * NOAA National Climatic Data Center, Asheville, North Carolina 1. Introduction The Intergovernmental Panel
Colorado State University, Fort Collins, CO Weather Station Monthly Summary Report
 Colorado State University, Fort Collins, CO Weather Station Monthly Summary Report Month: December Year: 2016 Temperature: Mean T max was 39.7 F which is 3.1 below the 1981-2010 normal for the month. This
Colorado State University, Fort Collins, CO Weather Station Monthly Summary Report
 Colorado State University, Fort Collins, CO Weather Station Monthly Summary Report Month: December Year: 2017 Temperature: Mean T max was 47.2 F which is 4.4 above the 1981-2010 normal for the month. This
Pacific Decadal Oscillation ( PDO ):
:") Time again for my annual Winter Weather Outlook. Here's just a small part of the items I considered this year and how I think they will play out with our winter of 2015-2016. El Nino / La Nina: When looking
Time again for my annual Winter Weather Outlook. Here's just a small part of the items I considered this year and how I think they will play out with our winter of 2015-2016. El Nino / La Nina: When looking
Here s what a weak El Nino usually brings to the nation with temperatures:
 Time again for my annual Winter Weather Outlook. Here's just a small part of the items I considered this year and how I think they will play out with our winter of 2018-2019. El Nino / La Nina: When looking
A summary of the weather year based on data from the Zumwalt weather station
 ZUMWALT PRAIRIE WEATHER 2016 A summary of the weather year based on data from the Zumwalt weather station Figure 1. An unusual summer storm on July 10, 2016 brought the second-largest precipitation day
2015: A YEAR IN REVIEW F.S. ANSLOW
 2015: A YEAR IN REVIEW F.S. ANSLOW 1 INTRODUCTION Recently, three of the major centres for global climate monitoring determined with high confidence that 2015 was the warmest year on record, globally.
The Climate of Oregon Climate Zone 4 Northern Cascades
 /05 E55 Unbound issue No. 9/ is Does not circulate Special Report 916 May 1993 The Climate of Oregon Climate Zone 4 Property of OREGON STATE UNIVERSITY Library Serials Corvallis, OR 97331-4503 Agricultural
Moose Day Summary Report 8th Annual February 27th, 2016
 Moose Day Summary Report 8th Annual February 27th, 2016 Photo taken by Kathy McCurdy. Moose Day 2016 Prepared by: Paul Hood and Alyson Courtemanch Jackson Hole Wildlife Foundation Nature Mapping Jackson
Champaign-Urbana 2000 Annual Weather Summary
 Champaign-Urbana 2000 Annual Weather Summary ILLINOIS STATE WATER SURVEY 2204 Griffith Dr. Champaign, IL 61820 wxobsrvr@sws.uiuc.edu Maria Peters, Weather Observer January: January started on a mild note,
Winter. Here s what a weak La Nina usually brings to the nation with tempseraures:
 2017-2018 Winter Time again for my annual Winter Weather Outlook. Here's just a small part of the items I considered this year and how I think they will play out with our winter of 2017-2018. El Nino /
AN ANALYSIS OF THE TORNADO COOL SEASON
 AN ANALYSIS OF THE 27-28 TORNADO COOL SEASON Madison Burnett National Weather Center Research Experience for Undergraduates Norman, OK University of Missouri Columbia, MO Greg Carbin Storm Prediction Center
Monthly Long Range Weather Commentary Issued: APRIL 1, 2015 Steven A. Root, CCM, President/CEO
 Monthly Long Range Weather Commentary Issued: APRIL 1, 2015 Steven A. Root, CCM, President/CEO sroot@weatherbank.com FEBRUARY 2015 Climate Highlights The Month in Review The February contiguous U.S. temperature
H IGHWAY 3 WILDLIFE MORTALITY
 Miistakis Institute for the Rockies H IGHWAY 3 WILDLIFE MORTALITY CONTENTS Introduction 1 Methods 2 Data Limitations 3 Results 3 Discussion 8 Special points of interest: The analysis includes mortality
Drought Characterization. Examination of Extreme Precipitation Events
 Drought Characterization Examination of Extreme Precipitation Events Extreme Precipitation Events During the Drought For the drought years (1999-2005) daily precipitation data was analyzed to find extreme
Becky Bolinger Water Availability Task Force November 13, 2018
 Colorado Climate Center WATF Climate Update Becky Bolinger Water Availability Task Force November 13, 2018 COLORADO CLIMATE CENTER Water Year 2018 Colorado s Climate in Review COLORADO CLIMATE CENTER
Will it be a Good Ski Season? Correlation between El Niño and U.S. Weather
 Will it be a Good Ski Season? Correlation between El Niño and U.S. Weather Lillian Petersen 1 Abstract This study investigates the correlation between El Niño and the weather across the U.S. El Niño is
A Report on a Statistical Model to Forecast Seasonal Inflows to Cowichan Lake
 A Report on a Statistical Model to Forecast Seasonal Inflows to Cowichan Lake Prepared by: Allan Chapman, MSc, PGeo Hydrologist, Chapman Geoscience Ltd., and Former Head, BC River Forecast Centre Victoria
Colorado State University, Fort Collins, CO Weather Station Monthly Summary Report
 Colorado State University, Fort Collins, CO Weather Station Monthly Summary Report Month: January Year: 2019 Temperature: Mean T max was 47.2 F which is 3.0 above the 1981-2010 normal for the month. This
Arizona Climate Summary February 2018 Summary of conditions for January 2018
 Arizona Climate Summary February 2018 Summary of conditions for January 2018 January 2018 Temperature and Precipitation Summary January 1 st 19 th : The new year began with a ridge of high pressure over
2011 Year in Review TORNADOES
 2011 Year in Review The year 2011 had weather events that will be remembered for a long time. Two significant tornado outbreaks in April, widespread damage and power outages from Hurricane Irene in August
research highlight Wind-Rain Relationships in Southwestern British Columbia Introduction Methodology Figure 2 Lower Mainland meteorological stations
 research highlight June 2007 Technical Series 07-114 Introduction Building envelope failures in southwestern British Columbia has brought to light the strong influence of wind-driven rain on building envelopes.
Monthly Long Range Weather Commentary Issued: February 15, 2015 Steven A. Root, CCM, President/CEO
 Monthly Long Range Weather Commentary Issued: February 15, 2015 Steven A. Root, CCM, President/CEO sroot@weatherbank.com JANUARY 2015 Climate Highlights The Month in Review During January, the average
Weather and Climate Summary and Forecast Winter
 Weather and Climate Summary and Forecast Winter 2016-17 Gregory V. Jones Southern Oregon University February 7, 2017 What a difference from last year at this time. Temperatures in January and February
Champaign-Urbana 2001 Annual Weather Summary
 Champaign-Urbana 2001 Annual Weather Summary ILLINOIS STATE WATER SURVEY 2204 Griffith Dr. Champaign, IL 61820 wxobsrvr@sws.uiuc.edu Maria Peters, Weather Observer January: After a cold and snowy December,
Colorado State University, Fort Collins, CO Weather Station Monthly Summary Report
 Colorado State University, Fort Collins, CO Weather Station Monthly Summary Report Month: February Year: 2017 Webcam catching a hawk watching over the station. Temperature: Mean T max was 54.4 F which
Monthly Long Range Weather Commentary Issued: APRIL 18, 2017 Steven A. Root, CCM, Chief Analytics Officer, Sr. VP,
 Monthly Long Range Weather Commentary Issued: APRIL 18, 2017 Steven A. Root, CCM, Chief Analytics Officer, Sr. VP, sroot@weatherbank.com MARCH 2017 Climate Highlights The Month in Review The average contiguous
Update on Seasonal Conditions & Summer Weather Outlook
 Update on Seasonal Conditions & Summer Weather Outlook Andy Bryant National Weather Service Portland, Oregon June 6, 2018 Overview Quick review of winter and spring conditions Seasonal water supply forecasts
ARE HUGE NORTHEAST SNOW STORMS DUE TO GLOBAL WARMING? by Dr. Richard Keen
 ARE HUGE NORTHEAST SNOW STORMS DUE TO GLOBAL WARMING? by Dr. Richard Keen SPPI REPRINT SERIES January 7, 2011 ARE HUGE NORTHEAST SNOW STORMS DUE TO GLOBAL WARMING? by Dr. Richard Keen January 7, 2011 The
SEPTEMBER 2013 REVIEW
 Monthly Long Range Weather Commentary Issued: October 21, 2013 Steven A. Root, CCM, President/CEO sroot@weatherbank.com SEPTEMBER 2013 REVIEW Climate Highlights The Month in Review The average temperature
Weather History on the Bishop Paiute Reservation
 Weather History on the Bishop Paiute Reservation -211 For additional information contact Toni Richards, Air Quality Specialist 76 873 784 toni.richards@bishoppaiute.org Updated 2//214 3:14 PM Weather History
Weather and Climate Summary and Forecast Fall/Winter 2016
 Weather and Climate Summary and Forecast Fall/Winter 2016 Gregory V. Jones Southern Oregon University November 5, 2016 After a year where we were seemingly off by a month in terms of temperatures (March
Weather and Climate of the Rogue Valley By Gregory V. Jones, Ph.D., Southern Oregon University
 Weather and Climate of the Rogue Valley By Gregory V. Jones, Ph.D., Southern Oregon University The Rogue Valley region is one of many intermountain valley areas along the west coast of the United States.
Defining Normal Weather for Energy and Peak Normalization
 Itron White Paper Energy Forecasting Defining Normal Weather for Energy and Peak Normalization J. Stuart McMenamin, Ph.D Managing Director, Itron Forecasting 2008, Itron Inc. All rights reserved. 1 Introduction
Climate change projections for Ontario: an updated synthesis for policymakers and planners
 Ministry of Natural Resources and Forestry Climate change projections for Ontario: an updated synthesis for policymakers and planners Shannon Fera and Adam Hogg Ontario Ministry of Natural Resources and
Moose Stratified Block Census, Management Unit 8-5, Okanagan Region, February 2005
 Moose Stratified Block Census, Management Unit 8-5, Okanagan Region, February 2005 by Les W. Gyug, R.P.Bio. Okanagan Wildlife Consulting 3130 Ensign Way Westbank, B.C. V4T 1T9 Prepared for B.C. Ministry
Illinois Drought Update, December 1, 2005 DROUGHT RESPONSE TASK FORCE Illinois State Water Survey, Department of Natural Resources
 Illinois Drought Update, December 1, 2005 DROUGHT RESPONSE TASK FORCE Illinois State Water Survey, Department of Natural Resources For more drought information please go to http://www.sws.uiuc.edu/. SUMMARY.
Monthly Long Range Weather Commentary Issued: July 18, 2014 Steven A. Root, CCM, President/CEO
 Monthly Long Range Weather Commentary Issued: July 18, 2014 Steven A. Root, CCM, President/CEO sroot@weatherbank.com JUNE 2014 REVIEW Climate Highlights The Month in Review The average temperature for
Climate Change Impacts on Maple Syrup Yield
 Climate Change Impacts on Maple Syrup Yield Rajasekaran R. Lada, Karen Nelson, Arumugam Thiagarajan Maple Research Programme, Dalhousie Agricultural Campus Raj.lada@dal.ca Canada is the largest maple
January 2011 Calendar Year Runoff Forecast
 January 2011 Calendar Year Runoff Forecast 2010 Runoff Year Calendar Year 2010 was the third highest year of runoff in the Missouri River Basin above Sioux City with 38.8 MAF, behind 1978 and 1997 which
The Pennsylvania Observer
 The Pennsylvania Observer January 5, 2009 December 2008 Pennsylvania Weather Recap The final month of 2008 was much wetter than average and a bit colder than normal. In spite of this combination, most
ZUMWALT WEATHER AND CLIMATE ANNUAL REPORT ( )
") ZUMWALT WEATHER AND CLIMATE ANNUAL REPORT (26-29) FINAL DRAFT (9 AUGUST 21) J.D. HANSEN 1, R.V. TAYLOR 2, AND V.S. JANSEN 3 INTRODUCTION The Zumwalt Prairie in northeastern Oregon is a unique grassland
ZUMWALT WEATHER AND CLIMATE ANNUAL REPORT (26-29) FINAL DRAFT (9 AUGUST 21) J.D. HANSEN 1, R.V. TAYLOR 2, AND V.S. JANSEN 3 INTRODUCTION The Zumwalt Prairie in northeastern Oregon is a unique grassland
PROGRESS REPORT for COOPERATIVE BOBCAT RESEARCH PROJECT. Period Covered: 1 January 31 May Prepared by
 PROGRESS REPORT for COOPERATIVE BOBCAT RESEARCH PROJECT Period Covered: 1 January 31 May 2011 Prepared by John A. Litvaitis, Derek Broman, and Marian K. Litvaitis Department of Natural Resources University
2013 Aerial Moose Survey Final Results
 2013 Aerial Moose Survey Final Results Glenn D. DelGiudice, Forest Wildlife Populations and Research Group Introduction Each year, we conduct an aerial survey in northeastern Minnesota in an effort to
NatGasWeather.com Daily Report
 NatGasWeather.com Daily Report Issue Time: 5:15 pm EST Sunday, February 28 th, 2016 for Monday, Feb 29 th 7-Day Weather Summary (February 28 th March 5 th ): High pressure will dominate much of the US
Arizona Climate Summary January 2017 Summary of conditions for December 2016
 Arizona Climate Summary January 2017 Summary of conditions for December 2016 December 2016 Temperature and Precipitation Summary December 1 st 15 th : Similar to November, December began with a dry trough
Arizona Climate Summary February 2012
 Arizona Climate Summary February 2012 Summary of conditions for January 2012 January 2012 Temperature and Precipitation Summary January 1 st 20 th : The New Year has started on a very dry note. The La
Analysis on Temperature Variation over the Past 55 Years in Guyuan City, China
 Analysis on Temperature Variation over the Past 55 Years in Guyuan City, China Liu Rui 1, 2,*, Zhang ZhiHua 1, 2 1 School of Environmental Science and Engineering, Chang an University, No.126 Yanta Road,
Denver International Airport MDSS Demonstration Verification Report for the Season
 Denver International Airport MDSS Demonstration Verification Report for the 2015-2016 Season Prepared by the University Corporation for Atmospheric Research Research Applications Division (RAL) Seth Linden
Weather and Climate Summary and Forecast March 2018 Report
 Weather and Climate Summary and Forecast March 2018 Report Gregory V. Jones Linfield College March 7, 2018 Summary: The ridge pattern that brought drier and warmer conditions from December through most
Hudson River Estuary Climate Change Lesson Project. Grades 5-8 Teacher s Packet. Lesson 3. Climate Change in My City
 Grades 5-8 Teacher s Packet Lesson 3 Climate Change in My City Teacher s Packet 2 Climate Change in My City NYS Intermediate Level Science Standard 1: Analysis, Inquiry and Design/Scientific Inquiry S1.3
Who is polluting the Columbia River Gorge?
 Who is polluting the Columbia River Gorge? Final report to the Yakima Nation Prepared by: Dan Jaffe, Ph.D Northwest Air Quality, Inc. 7746 Ravenna Avenue NE Seattle WA 98115 NW_airquality@hotmail.com December
UNITED STATES AND SOUTH AMERICA OUTLOOK (FULL REPORT) Thursday, December 28, 2017
 Thursday, December 28, 2017") T-storm Weather Summary Despite scattered t-storms Sat.-Sun. in central and northern areas in Argentina, more will likely be needed especially in sunflower areas of the southwest. Some t-storms likely
T-storm Weather Summary Despite scattered t-storms Sat.-Sun. in central and northern areas in Argentina, more will likely be needed especially in sunflower areas of the southwest. Some t-storms likely
DEPARTMENT OF EARTH & CLIMATE SCIENCES Name SAN FRANCISCO STATE UNIVERSITY Nov 29, ERTH 360 Test #2 200 pts
 DEPARTMENT OF EARTH & CLIMATE SCIENCES Name SAN FRANCISCO STATE UNIVERSITY Nov 29, 2018 ERTH 360 Test #2 200 pts Each question is worth 4 points. Indicate your BEST CHOICE for each question on the Scantron
Arizona Climate Summary May 2012
 Arizona Climate Summary May 2012 Summary of conditions for April 2012 April 2012 Temperature and Precipitation Summary April 1 st 16 th : Although April began with another low pressure system sweeping
Champaign-Urbana 1999 Annual Weather Summary
 Champaign-Urbana 1999 Annual Weather Summary ILLINOIS STATE WATER SURVEY 2204 Griffith Dr. Champaign, IL 61820 wxobsrvr@sws.uiuc.edu Maria Peters, Weather Observer A major snowstorm kicked off the new
Meteorology. Circle the letter that corresponds to the correct answer
 Chapter 3 Worksheet 1 Meteorology Name: Circle the letter that corresponds to the correct answer 1) If the maximum temperature for a particular day is 26 C and the minimum temperature is 14 C, the daily
Arizona Climate Summary April 2013
 Arizona Climate Summary April 2013 Summary of conditions for March 2013 March 2013 Temperature and Precipitation Summary March 1 st 16 th : March began as a ridge of high pressure progressed across the
An ENSO-Neutral Winter
 An ENSO-Neutral Winter This issue of the Blue Water Outlook newsletter is devoted towards my thoughts on the long range outlook for winter. You will see that I take a comprehensive approach to this outlook
NEWS RELEASE. Province boosts winter highway safety measures
 For Immediate Release 2018TRAN0045-000567 April 4, 2018 NEWS RELEASE Province boosts winter highway safety measures VICTORIA Following an intense winter, the is undertaking several improvements to make
North Carolina Climate January 2012
 North Carolina Climate January 2012 Online: http://www.nc-climate.ncsu.edu/office/newsletters North Carolina Climate, the monthly newsletter of the State Climate Office of NC, covers information on experimental
Flood Risk Assessment
 Flood Risk Assessment February 14, 2008 Larry Schick Army Corps of Engineers Seattle District Meteorologist General Assessment As promised, La Nina caused an active winter with above to much above normal
Weather and Climate Summary and Forecast December 2017 Report
 Weather and Climate Summary and Forecast December 2017 Report Gregory V. Jones Linfield College December 5, 2017 Summary: November was relatively cool and wet from central California throughout most of
Colorado CoCoRaHS. Colorado CoCoRaHS. Because Every Drop Counts! November 2014 Volume 2, Issue 11
 U.S. PRECIPITATION (% OF AVERAGE) LOOKING BACK AT OCTOBER 2014 October was a fairly dry month for much of the nation with the exception of the Pacific Northwest, portions of New England and the Tennessee
Let s Talk Climate! Nolan Doesken Colorado Climate Center Colorado State University. Yampatika Seminar February 16, 2011 Steamboat Springs, Colorado
 Let s Talk Climate! Nolan Doesken Colorado Climate Center Colorado State University Yampatika Seminar February 16, 2011 Steamboat Springs, Colorado First -- A short background In 1973 the federal government
JEFF JOHNSON S Winter Weather Outlook
 JEFF JOHNSON S 2017-2018 Winter Weather Outlook TABLE OF CONTENTS ABOUT THE AUTHOR Components of the seasonal outlook... 2 ENSO state/ocean temperatures... 3 Sub-seasonal outlooks... 4 Forecast models...
1.Introduction 2.Relocation Information 3.Tourism 4.Population & Demographics 5.Education 6.Employment & Income 7.City Fees & Taxes 8.
 1.Introduction 2.Relocation Information 3.Tourism 4.Population & Demographics 5.Education 6.Employment & Income 7.City Fees & Taxes 8.Recreation & Activities 9.Climate Data 10.Economic Development History
138 ANALYSIS OF FREEZING RAIN PATTERNS IN THE SOUTH CENTRAL UNITED STATES: Jessica Blunden* STG, Inc., Asheville, North Carolina
 138 ANALYSIS OF FREEZING RAIN PATTERNS IN THE SOUTH CENTRAL UNITED STATES: 1979 2009 Jessica Blunden* STG, Inc., Asheville, North Carolina Derek S. Arndt NOAA National Climatic Data Center, Asheville,
Putative Canada Lynx (Lynx canadensis) Movements across I-70 in Colorado
 Movements across I-70 in Colorado") Putative Canada Lynx (Lynx canadensis) Movements across I-70 in Colorado INTRODUCTION March 8, 2012 Jake Ivan, Mammals Researcher Colorado Parks and Wildlife 317 W. Prospect Fort Collins, CO 80526 970-472-4310
Putative Canada Lynx (Lynx canadensis) Movements across I-70 in Colorado INTRODUCTION March 8, 2012 Jake Ivan, Mammals Researcher Colorado Parks and Wildlife 317 W. Prospect Fort Collins, CO 80526 970-472-4310
CLIMATE OF THE ZUMWALT PRAIRIE OF NORTHEASTERN OREGON FROM 1930 TO PRESENT
 CLIMATE OF THE ZUMWALT PRAIRIE OF NORTHEASTERN OREGON FROM 19 TO PRESENT 24 MAY Prepared by J. D. Hansen 1, R.V. Taylor 2, and H. Schmalz 1 Ecologist, Turtle Mt. Environmental Consulting, 652 US Hwy 97,
Colorado CoCoRaHS. Colorado CoCoRaHS. Because Every Drop Counts! October 2014 Volume 2, Issue 10
 U.S. PRECIPITATION (% OF AVERAGE) LOOKING BACK AT SEPTEMBER 2014 September was dry for much of the nation with a few exceptions; one of those being the central Rockies. In Colorado, it was wetter-than-average
Weather and Climate Summary and Forecast October 2017 Report
 Weather and Climate Summary and Forecast October 2017 Report Gregory V. Jones Linfield College October 4, 2017 Summary: Typical variability in September temperatures with the onset of fall conditions evident
John Erb, Minnesota Department of Natural Resources, Forest Wildlife Research Group
 FURBEARER WINTER TRACK SURVEY SUMMARY, John Erb, Minnesota Department of Natural Resources, Forest Wildlife Research Group INTRODUCTION Monitoring the distribution and abundance of carnivores can be important
Climatographs. Suggested Activity. Conduct an Investigation 1-1C on page 30. Climatograph Tofino, British Columbia, 49ºN. Average Precipitation (mm)
") BCS10_C01_F 3/11/08 12:44 P Page 16 Climatographs Conduct an Investigation 1-1C on page 30 onth verage Precipitation (mm) verage Temperature ( C) F S O N D 436 382 3 249 16 138 77 94 134 340 47 462 4 6
BCS10_C01_F 3/11/08 12:44 P Page 16 Climatographs Conduct an Investigation 1-1C on page 30 onth verage Precipitation (mm) verage Temperature ( C) F S O N D 436 382 3 249 16 138 77 94 134 340 47 462 4 6
Winter Climate Forecast
 Winter 2018-2019 Climate Forecast 26 th Winter Weather Meeting, OMSI and Oregon AMS, Portland Kyle Dittmer Hydrologist-Meteorologist Columbia River Inter-Tribal Fish Commission Portland, Oregon Professor
Fire Season Prediction for Canada, Kerry Anderson Canadian Forest Service
 Fire Season Prediction for Canada, 2014 Kerry Anderson Canadian Forest Service 1 Introduction The Canadian Forest Service is now presenting monthly and seasonal forecast maps through the Canadian Wildland
Monthly Long Range Weather Commentary Issued: May 15, 2014 Steven A. Root, CCM, President/CEO
 Monthly Long Range Weather Commentary Issued: May 15, 2014 Steven A. Root, CCM, President/CEO sroot@weatherbank.com APRIL 2014 REVIEW Climate Highlights The Month in Review The average temperature for
Climate also has a large influence on how local ecosystems have evolved and how we interact with them.
 The Mississippi River in a Changing Climate By Paul Lehman, P.Eng., General Manager Mississippi Valley Conservation (This article originally appeared in the Mississippi Lakes Association s 212 Mississippi
Arizona Climate Summary
 Arizona Climate Summary April 2014 Summary of conditions for March 2014 March 2014 Temperature and Precipitation Summary March 1 st 16 th : We started off the month of March with a significant precipitation
Winter Climate Forecast
 Winter 2017-2018 Climate Forecast 25 th Winter Weather Meeting, OMSI and Oregon AMS, Portland Kyle Dittmer Hydrologist-Meteorologist Columbia River Inter-Tribal Fish Commission Portland, Oregon Professor
Weather and Climate Summary and Forecast April 2018 Report
 Weather and Climate Summary and Forecast April 2018 Report Gregory V. Jones Linfield College April 4, 2018 Summary: A near Miracle March played out bringing cooler and wetter conditions to the majority
Ryan P. Shadbolt * Central Michigan University, Mt. Pleasant, Michigan
 14A.1 RECENT CLIMATE CHANGE IN THE HIGH ELEVATIONS OF THE SOUTHERN APPALACHIANS Ryan P. Shadbolt * Central Michigan University, Mt. Pleasant, Michigan 1. INTRODUCTION Island species are often vulnerable
Weather and Climate Summary and Forecast March 2019 Report
 Weather and Climate Summary and Forecast March 2019 Report Gregory V. Jones Linfield College March 2, 2019 Summary: Dramatic flip from a mild winter to a top five coldest February on record in many locations
UNST 232 Mentor Section Assignment 5 Historical Climate Data
 UNST 232 Mentor Section Assignment 5 Historical Climate Data 1 introduction Informally, we can define climate as the typical weather experienced in a particular region. More rigorously, it is the statistical
The weather in Iceland 2014
 Icelandic Meteorological Office Climate summary 2014 published 22.3.2015 The weather in Iceland 2014 Climate summary Rainbow by Elliðaey - one of the Westman islands off the south coast - 14 July 2014.
but 2012 was dry Most farmers pulled in a crop
 After a winter that wasn t, conditions late in the year pointed to a return to normal snow and cold conditions Most farmers pulled in a crop but 2012 was dry b y M i k e Wr o b l e w s k i, w e a t h e
Weather and Climate Summary and Forecast February 2018 Report
 Weather and Climate Summary and Forecast February 2018 Report Gregory V. Jones Linfield College February 5, 2018 Summary: For the majority of the month of January the persistent ridge of high pressure
Average Weather For Coeur d'alene, Idaho, USA
 Average Weather For Coeur d'alene, Idaho, USA Information courtesy of weatherspark.com Location This report describes the typical weather at the Coeur d'alene Air Terminal (Coeur d'alene, Idaho, United
Upper Missouri River Basin February 2018 Calendar Year Runoff Forecast February 6, 2018
 Upper Missouri River Basin February 2018 Calendar Year Runoff Forecast February 6, 2018 Calendar Year Runoff Forecast Explanation and Purpose of Forecast U.S. Army Corps of Engineers, Northwestern Division
Weather and Climate Summary and Forecast Summer into Harvest 2016
 Weather and Climate Summary and Forecast Summer into Harvest 2016 Gregory V. Jones Southern Oregon University September 3, 2016 With school and football season starting a hint of fall is right on time
Tracking the Climate Of Northern Colorado Nolan Doesken State Climatologist Colorado Climate Center Colorado State University
 Tracking the Climate Of Northern Colorado Nolan Doesken State Climatologist Colorado Climate Center Colorado State University Northern Colorado Business Innovations November 20, 2013 Loveland, Colorado
SOUTHERN CLIMATE MONITOR
 SOUTHERN CLIMATE MONITOR MARCH 2011 VOLUME 1, ISSUE 3 IN THIS ISSUE: Page 2 to 4 Severe Thunderstorm Climatology in the SCIPP Region Page 4 Drought Update Page 5 Southern U.S. Precipitation Summary for
Chiang Rai Province CC Threat overview AAS1109 Mekong ARCC
 Chiang Rai Province CC Threat overview AAS1109 Mekong ARCC This threat overview relies on projections of future climate change in the Mekong Basin for the period 2045-2069 compared to a baseline of 1980-2005.
Spatio-temporal Patterns of Wildlife Distribution and Movement in Canmore s Benchlands Corridor.
 Spatio-temporal Patterns of Wildlife Distribution and Movement in Canmore s Benchlands Corridor. March 2010 Prepared by Tracy Lee, Samantha Managh and Neil Darlow Prepared for: Alberta Tourism, Parks and
Confronting Climate Change in the Great Lakes Region. Technical Appendix Climate Change Projections EXTREME EVENTS
 Confronting Climate Change in the Great Lakes Region Technical Appendix Climate Change Projections EXTREME EVENTS Human health and well-being, as well as energy requirements, building standards, agriculture
 AMO and PDO- The Real Climate Makers In United States? By Matt Vooro For decades we have been urged to urgently prepare for unprecedented global warming or there will be gloom and doom for the world. Yet
Monthly Long Range Weather Commentary Issued: NOVEMBER 16, 2015 Steven A. Root, CCM, Chief Analytics Officer, Sr. VP, sales
 Monthly Long Range Weather Commentary Issued: NOVEMBER 16, 2015 Steven A. Root, CCM, Chief Analytics Officer, Sr. VP, sales sroot@weatherbank.com OCTOBER 2015 Climate Highlights The Month in Review The
Weather and Climate Summary and Forecast January 2019 Report
 Weather and Climate Summary and Forecast January 2019 Report Gregory V. Jones Linfield College January 4, 2019 Summary: December was mild and dry over much of the west, while the east was much warmer than
Moisture Situation Update December 19, 2016
 Synopsis November marked a notable shift in Alberta s precipitation patterns, with most of the province experiencing a drying trend over the past 7 weeks (see map 1). This is particularly true for those