January 2011 Calendar Year Runoff Forecast
|
|
|
- Emerald Hicks
- 5 years ago
- Views:
Transcription

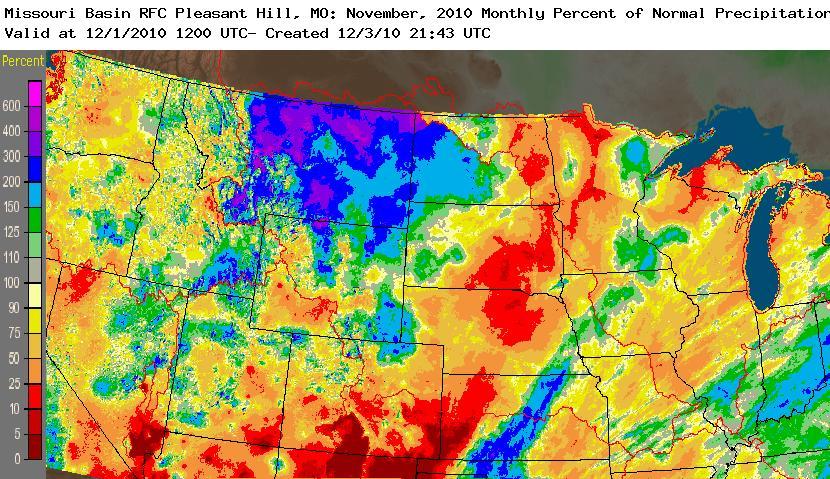
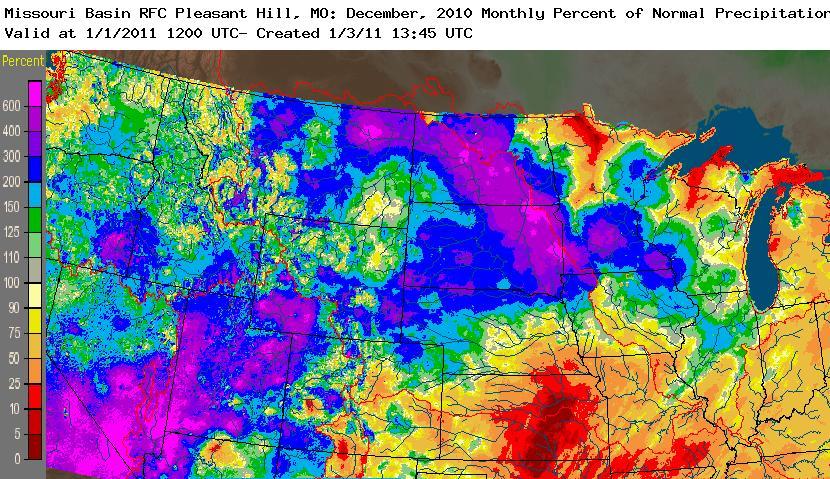
1 January 2011 Calendar Year Runoff Forecast 2010 Runoff Year Calendar Year 2010 was the third highest year of runoff in the Missouri River Basin above Sioux City with 38.8 MAF, behind 1978 and 1997 which was the highest year of runoff on record was preceded by a very wet October 2009 that led to a very early and cold winter with above average plains snow pack. Mountain snowpack peaked late yet below the average peak accumulation. Runoff in the spring and summer was aided by large and frequent spring and summer storms that produced 125 to 150 percent of normal annual precipitation. Antecedent Moisture Conditions Precipitation beginning in September 2010 was over 200% of normal in the Northern Plains; however, precipitation departures were well below normal in October. November 2010 precipitation was 200% of normal in Montana, western North Dakota, and northern Wyoming, yet very dry throughout Nebraska and the eastern Dakotas. In December 2010 winter precipitation accumulations in the Missouri Basin above Sioux City, IA was greater than 200% of normal as a result of a jet stream path that channeled moisture through the northern Plains. Along and north of the Missouri River, especially in the James and Big Sioux River basins, precipitation accumulations were 300 to 400 % of normal. Soil moisture at the end of the month was generally in the 80 th percentile for the entire basin with the exception of Wyoming. In the James, Big Sioux, Garrison and Oahe subbasins, soil moisture ranged from the 90 t0 99 th percentile. The December 2010 runoff summation above Gavins Point Dam was 157% of normal, while the summation above Sioux City, IA, was 169% of normal. Figure 1 December 2010 Soil Moisture Conditions. 1
2 Plains Snow Pack December precipitation and snowfall in the basin are summarized in Table 1. In all locations, precipitation and snowfall was well above normal. Table 1 December 2010 precipitation accumulations, departures, and snowfall in the Missouri River Basin. Precipitation, in Departure, in Snow, in EOM Depth, in Glasgow, MT Great Falls, MT Williston, ND Bismarck, ND Jamestown, ND M M Aberdeen, SD Huron, SD Pierre, SD Sisseton, SD Sioux Falls, SD Watertown, SD According to NOAA s NOHRSC, 2 to 3 inches of SWE are present across North Dakota, northern South Dakota, and much of northeast Montana as of January 3, These accumulations are also present over a majority of the James River Basin and the upper half of the Big Sioux River Basin. Approximately 1 to 2 inches of SWE exist in the remainder of South Dakota and a small portion of northwest Iowa. Less than 1 inch of SWE is present in Nebraska and western Iowa. Compared to normal accumulated snowfall depths, snow depths in South Dakota and North Dakota are about 4 to 8 inches above normal. These conditions are similar to the conditions present on January 3, 2010, with the exception that there is less snow in Iowa, Nebraska, and southeast South Dakota in


3 Figure 2 Plains Snow Water Equivalent (SWE) on January 3, Figure 3 Plains Snow Depth Departure from Normal on January 3, Mountain Snow Pack Mountain snowpack as of January 3, 2011 was 111% of normal above Fort Peck and 111% of normal in the Fort Peck to Garrison reach. Missouri River Basin mountain snowpack normally peaks near on April 15. By January 1, normally 42% of the peak accumulation has occurred. 3
4 January 2011 Calendar Year Runoff Forecast The overall calendar year 2011 runoff forecast is 25.0 MAF (110% of normal) above Gavins Point dam and 27.8 MAF (112% or normal) above Sioux City, IA. Due to higher than normal runoff in December 2010 and average temperature conditions, runoff volumes are expected to remain above normal in January and February. The accumulation of plains snow is above normal in the Northern Plains. Snowfall is expected to be above normal especially in Montana and North Dakota, while temperatures through March are expected to be slightly below normal, favoring above average plains accumulations. The March April runoff volumes for Fort Peck, Garrison, Oahe and Sioux City were based on the Moderate (formerly the aaverage category) plains snow cover condition categoryrunoff during snow accumulation years, while in the Fort Peck, Oahe, Fort Randall and the Gavins Point reaches, runoff volumes were based on the l Light plains snow cover condition categoryrunoff during snow accumulation years. The Light category represents basinwide snow accumulations and runoff that would result in above average March April runoff. The plains snow volume forecasts based on plains snow accumulation years resulted in % of normal runoff in March and % of normal runoff in April above Sioux City. May July runoff determined primarily by mountain snow accumulation is estimated to be % of normal, which is a direct correlation to the percent of mountain snowpack. Runoff in the Gavins Point to Sioux City subbasin is expected to be above normal throughout the remainder of the 2011 calendar year as a result of wet antecedent moisture conditions and much higher than average monthly runoff in Oahe, Fort Randall, and Gavins Point reaches return to normal runoff volumes in May Fort Peck and Garrison reaches return to normal in August
5 5
6 February 2011 Calendar Year Runoff Forecast 2011 January Runoff January 2011 runoff above Sioux City, IA, was 170.8% of normal at KAF. Fort Peck received KAF (140%), Garrison received KAF (118%), Oahe received KAF (965%), Fort Randall received 86.4 KAF (346%), Gavins Point received 67 KAF (67%), and the Sioux City reach received 266 KAF (664%). Antecedent Moisture & Precipitation Soil moisture conditions on January 30, 2011 continue to rank very high in the Northern Plains including eastern Montana and the Dakotas, and the Northern Rockies in Montana and northwest Wyoming (Figure 1). Soil moisture conditions rank in at least the 70 th percentile, with particularly wet areas ranking 90 percent or higher. The Upper Missouri basin in the Northern Rockies, northeast Montana, northern North Dakota, and eastern South Dakota all rank in the 99 th percentile for soil moisture. Wetter than normal conditions also exist in southeast Wyoming, much of Nebraska and Iowa. Precipitation during the month of January was well above normal throughout most of the Missouri River basin (Figure 2). Greater than 175% of normal occurred throughout much of the basin upstream of Rulo, NE. As a result, Northern Plains and Northern Rockies snow accumulations benefitted greatly. Mountain Snow Pack Mountain snowpack as of January 31, 2011 was 112% of normal above Fort Peck and 111% of normal in the Fort Peck to Garrison reach. Missouri River Basin mountain snowpack normally peaks near on April 15. By January 1, normally 61% of the peak accumulation has occurred. Plains Snow Pack Plains snow pack as snow water equivalent (SWE) is shown in Figure 3 and snow depth departure from normal is in Figure 4. For comparison, SWE in the Missouri River basin on January 31 of 2009 and 2010 are shown in Figures 5 and 6, while peak SWE in 2009 and 2010 are shown in Figures 7 and 8, respectively. Basinwide Pplains snow pack in the Fort Peck subbasin is characterized as Light to Moderate Average, when compared to all runoff years in which snow accumulations influenced March April runoff. In while in the Fort Peck to Garrison reach it is characterized as Moderate compared to all runoff years in which snow accumulation influenced March April runoff. According to NOAA s NOHRSC snow model (Figure 3), about 1 3 inches of SWE are present in the Fort Peck subbasin, while 3 5 inches cover much of the Fort Peck to Garrison subbasin, especially in the Milk River basin and the Yellowstone River basin downstream of Miles City, MT, and the lower half of the Little Missouri basin. It is not uncommon for the NOHRSC model to show 5 6 inches of SWE on the plains in the lower Milk River basin and along the Missouri River and its tributaries between Fort Peck Dam and Williston, ND. SWE measurements by the NWS in northeast Montana ranged from 3.0 to 6.5 inches. Snow water equivalent in the Fort Peck to Garrison reach on January 31, 2011, is greater than the snow pack that 1
7 existed on January 31 in 2009 (Figure 5) and 2010 (Figure 6). It bears some similarities to the peak amounts that occurred on April 2, 2009 (Figure 7), and March 15, 2010 (Figure 8); however, it is too early in the season to make an accurate prediction of runoff based on snow pack alone. Plains snow pack in the Oahe reach is characterized as Average Moderate. The Ssnow depths in this subbasin isare well above average and plains SWE is 2 4 inches according to the NOHRSC snow model (Figure 3). Plains snow pack in the Fort Randall and Gavins Point subbasins are characterized as Light. In the Fort Randall subbasin, SWE ranges from inches of SWE, while less snow exists in the Gavins Point subbasin (Figure 3). Plains snow pack in the Sioux City subbasin is characterized as Moderate. NOHRSC snow model estimates (Figure 3) indicate 3 5 inches of SWE in the upper two thirds of the James River basin and upper half of the Big Sioux River basin, and about inches of SWE in the lower portions of the basin. Cooperative observer measurements verify that 4 inches of SWE exist in the middle and upper James and the upper Big Sioux basins. Similar amounts of SWE were present in the Sioux City subbasin as of January 31, 2010 (Figure 6); however, field verifications in 2010 indicated NOHRSC s modeled estimates were about one inch too high. Climate Outlook From February April, there is a higher probability that temperatures will continue to fall below normal in the Northern Plains and Rocky Mountains with more normal temperatures in Nebraska, Kansas, and Missouri. This should increase the likelihood that the Northern Plains snow pack and mountain snow pack will persist later into spring with limited melting. With regard to temperatures, there is a higher probability that above normal precipitation will occur in the Northern Rockies and Plains from February April, with precipitation trending to below normal accumulations in Colorado, Nebraska, Kansas, and western Missouri. The higher probabilities of precipitation in the Northern Rockies and Plains, combined with cooler temperatures indicate snow accumulation trends will continue at their existing above normal pace, followed by a later season melt. February 2011 Calendar Year Runoff Forecast The overall calendar year 2011 runoff forecast is 25.2 MAF (111% of normal) above Gavins Point dam and 28.4 MAF (114% of normal) above Sioux City, IA. The accumulation of plains snow is above normal in the Northern Plains. In the Fort Peck subbasin, snow accumulation is characterized as llight ; however, in the Fort Peck to Garrison subbasin, the snow accumulation is considered to be m Moderate in much of the Milk, lower Yellowstone River, Little Missouri, and Missouri River basins. The snow accumulation in the Oahe subbasin is average Moderate, while it is Light light in the Fort Randall and Gavins Point subbasins. The Sioux City reach contains Mmoderate snow accumulations in a majority of its river basins. Mountain snow 2
8 accumulations as a percent of long term averages are 112% of normal in the Fort Peck subbasin and 111% of normal in the Fort Peck to Garrison subbasin. NOAA s Climate Prediction Center outlook indicates higher probabilities of precipitation in the Northern Rockies and Plains. Combined with cooler temperatures through April, snow accumulation trends will continue at their existing above normal pace. With regard to March and April runoff, the higher than average snow pack has led us to set the percent of normal runoff above Gavins Point at 132% of normal in March and 135% of normal in April. Including the Gavins Point to Sioux City reach, the accumulated runoff forecast above Sioux City is 139% of normal in March and 138% of normal in April. The May July runoff above Fort Peck will be 106% of normal while in the Fort Peck to Garrison reach it will be 103% of normal. All runoff is expected to return to normal above Gavins Point by August 2011 with the exception of the Sioux City subbasin. High antecedent moisture conditions, moderate snow pack, and high historic streamflows will continue to produce well above normal runoff throughout the calendar year. 3
9 Figure 1 End of January 2011 Soil Moisture Ranking Percentile. Figure 2 30 day precipitation as a percent of normal, ending January 31,
 on January 31,")

10 Figure 3 Plains Snow Water Equivalent (SWE) on January 31, Figure 4 Plains Snow Depth Departure from Normal on January 31,


11 Figure 5 Plains SWE on January 31, Figure 6 Plains SWE on January 31,


12 Figure 7 Plains SWE on April 2, Figure 8 Plains SWE on March 15,
13 March 2011 Calendar Year Runoff Forecast 2011 February Runoff February 2011 runoff above Sioux City, IA, was 217% of normal at 2,333 KAF, partly due to some early plains snow melt runoff. Fort Peck received 580 KAF (161%), Garrison received 457 KAF (128%), Oahe received 318 KAF (354%), Fort Randall received 217 KAF (443%), Gavins Point received 236 KAF (182%), and the Sioux City reach received 524 KAF (570%). Antecedent Moisture & Precipitation Soil moisture conditions on February 28, 2011 continue to rank very high in the Northern Plains including eastern Montana and the Dakotas, and the Northern Rockies in Montana and northwest Wyoming (Figure 1). Soil moisture conditions rank in at least the 70 th percentile, with particularly wet areas ranking 90 percent or higher. The Upper Missouri basin in the Northern Rockies, northern Montana, northern North Dakota, and eastern South Dakota all rank in the 95 th percentile or higher. Wetter than normal conditions also exist in southeast Wyoming, much of Nebraska and Iowa. Precipitation during the month of February was well above normal throughout most of the Missouri River basin (Figure 2). Greater than 175% of normal occurred throughout much of the basin upstream of Rulo, NE. As a result, Northern Plains and Northern Rockies snow accumulations benefitted greatly. Mountain Snow Pack Mountain snowpack as of February 28, 2011 was 110% of normal above Fort Peck and 108% of normal in the Fort Peck to Garrison reach. Missouri River Basin mountain snowpack normally peaks near on April 15. By March 1, normally 79% of the peak accumulation has occurred. Plains Snow Pack The Plains snow pack on March 1, 2010, contains pockets of relatively heavy snow cover within a l Light to average Moderate cover according to the Plains Snow Cover Condition methodology used for forecasting March April runoff by snow cover. It extendings from north central Montana through eastern Montana and across the Dakotas. Very little snow cover exists in Iowa or Nebraska. Above Fort Peck Lake, snow cover is Llight, while in the reach between Fort Peck and Garrison Dams, overall snow cover is considered llight to mmoderate due to good overall coverage and pockets of heavy SWE ranging from 3 5 inches in the Milk River Basin and in tributary areas north of the Missouri River reach between Fort Peck and Garrison. Light to mmoderate SWE ranging from 2 4 inches covers portions of the lower Yellowstone River, the Little Missouri River and areas surrounding Lake Sakakawea. Snow cover surrounding Oahe is considered l Light with SWE estimates generally equal to 2 inches and not exceeding 3 inches. Snow cover surrounding the Fort Randall and Gavins Point reaches is llight with SWE amounts of about 1 inch. 1
14 In the Gavins Point to Sioux City reach, SWE amounts diminished in southern portions of the James and Big Sioux basins as a result of snowmelt during the middle of February, while limited melt occurred in the lower James and Vermillion Rivers. Following the snowmelt, a very heavy winter storm produced 10 to 20 inches of snow over eastern South Dakota. Moderate to h Heavy snow cover exists from Mitchell, SD to Sioux Falls, SD, northward to the state line. SWE ranges from 3 4 inches with some pockets of 5 and 6 inches in the northernmost portion of the Big Sioux Basin. The James River Basin above Jamestown, ND, contains an average of 3.77 inches of SWE, compared to 3.8 inches at that time in Compared to 2010, SWE in 2011 are greater than 2010 in the Milk River Basin and the Garrison reach. SWE is less in the Oahe to Gavins Point reaches, while it is similar in amount in the Sioux City reach with the exception of the southern portions of the James and Big Sioux River which has much less SWE than at this time in Climate Outlook During the next five days temperatures in the Missouri Basin will be several degrees below normal in Montana and the Dakotas, and about normal in all other areas. This pattern is likely to prevail into mid March. In terms of precipitation, the next five days will be dry with continued snow accumulations in the Rocky Mountains. Through mid March the probability of precipitation throughout the Missouri Basin will be above average. In March, the Climate Prediction Center is forecasting a greater probability of below normal temperatures in Montana, Wyoming and the Dakotas, while equal chances of above or below normal temperatures in all other areas of the Missouri Basin. With regard to precipitation, the CPC is forecasting increased chances of precipitation in Montana, Wyoming, and the Dakotas, while there are equal chances of above or below normal precipitation (see Figures 6 and 7) During the March May period, temperatures will trend toward cooler than normal in Montana and the Dakotas while they will likely be normal in all other areas. Overall precipitation probabilities will be normal in Montana, Wyoming and the Dakotas with a trend toward drier than normal conditions extending from Colorado through Nebraska and Kansas into western Iowa. March 2011 Calendar Year Runoff Forecast The overall calendar year 2011 runoff forecast is 25.4 MAF (112% of normal) above Gavins Point Dam, which is an increase of 0.2 MAF from the February 2011 forecast. The summation above Sioux City is 29.8 MAF (120% of normal), an increase from 28.4 MAF. With regard to March and April runoff, the areas of mmoderate to hheavy snow pack will cause above average runoff into the system. Despite some early snowmelt, an increase in the snowmelt runoff volume is expected in the Sioux City reach due to the additional SWE accumulated in the mid 2
15 February snow storm, expected colder temperatures, wet soil moisture conditions and high tributary flows experienced during the winter. Mountain snow accumulations as a percent of long term averages are 110% of normal in the Fort Peck subbasin and 108% of normal in the Fort Peck to Garrison subbasin. As a result, the May July runoff above Fort Peck is expected to be 105% of normal, while the Fort Peck to Garrison reach is expected to receive 103% of normal runoff. Runoff in all reaches above the System are forecasted to return to normal by August 2011, while above average runoff is forecasted in the Gavins to Sioux City reach due to persistent moist soil conditions. 3

16 Figure 1 End of February 2011 Soil Moisture Ranking Percentile. Figure 2 30 day precipitation as a percent of normal, ending February 28,
 on March 1,")

17 Figure 3 Plains Snow Water Equivalent (SWE) on March 1, Figure 4 Plains Snow Water Equivalent on March 1,

18 Figure 5 Plains Snow Water Equivalent on March 1,
19 7
20 April 2011 Calendar Year Runoff Forecast 2011 March Runoff March 2011 runoff above Sioux City, IA, was 231% of normal at 6653 KAF, and above Gavins Point Dam runoff was 213% of normal at 5501 KAF. The actual March runoff into the system was 2451 KAF greater than forecasted March runoff above Gavins Point. Fort Peck received 1049 KAF (176%), Garrison received 1567 KAF (156%), Oahe received 1806 KAF (319%), Fort Randall received 686 KAF (328%), Gavins Point received 392 KAF (190%), and the Sioux City reach received 1152 KAF (385%). Antecedent Moisture & Precipitation Soil moisture conditions on March 31, 2011, continue to rank very high in the Northern Plains including eastern Montana and the Dakotas, and the Northern Rockies in Montana and northwest Wyoming (Figure 1). Soil moisture conditions rank in at least the 70 th percentile, with particularly wet areas ranking 90 percent or higher. The Upper Missouri basin in the Northern Rockies, northern Montana, northern North Dakota, and eastern South Dakota all rank in the 95 th percentile or higher. Wetter than normal soil conditions are also present northern Nebraska and northwest Iowa. Drier than normal soil conditions have developed in eastern Colorado, western Kansas and a small portion of central Missouri. Thirty day precipitation departures as a percent of normal ending on March 31, 2011 is shown in Figure 2. A large area extending from eastern Montana through central North Dakota, also including northeast Wyoming, and western and northern South Dakota received greater than 150% of normal precipitation in March. A large area within this region including northeast Montana, and western and central North Dakota has been very wet, receiving over 200% of normal precipitation with some areas receiving over 300% of normal precipitation. In other areas such as central South Dakota, Nebraska, Iowa, and Kansas, precipitation was less than 75% or normal in March. Mountain Snow Pack Mountain snowpack as of March 31, 2011 was 116% of normal above Fort Peck and 112% of normal in the Fort Peck to Garrison reach. This is an increase from 110% of normal above Fort Peck and 108% of normal in the Fort Peck to Garrison reach on February 28, Missouri River Basin mountain snowpack normally peaks near on April 15. By April 1, normally 96% of the peak accumulation has occurred. The current SWE accumulations in each reach are greater than the normal annual peak accumulations. Plains Snow Pack The Plains snow pack on April 1, 2010, contains pockets of relatively heavy snow cover within a light to average cover extending from north central Montana through eastern Montana and across the Dakotas. Very little snow cover exists in Iowa or Nebraska. Snow water equivalent conditions are shown in Figures 3 and 4. Figure 3 shows the plains SWE in inches on March 31, Figure 4 shows the plains SWE on March 10, 2011, which is near the date of peak SWE accumulation prior to the snowmelt that melted a majority of the snow in South Dakota. 1
21 Above Fort Peck Lake, the snow cover has thinned significantly; however, 1 2 inch amounts of SWE remain in central Montana, and trace amounts of SWE remain south of the reservoir. The Fort Peck to Garrison reach contains the greatest amounts of plains snow with very heavy pockets of SWE remain in the Milk River Basin and tributary basins primarily north of the Missouri River extending into north central North Dakota. Very limited snowmelt has occurred in the Fort Peck to Garrison reach north of the Missouri River; however, south of the River in the lower Yellowstone and Little Missouri River basins, some snowmelt and runoff has occurred. SWE amounts in the Milk River Basin range from 2.5 to 4.5 inches according to measurements, while in the Missouri River reach from Fort Peck to Williston, 2 4 inches of SWE remain. NOAA s NOHRSC office is estimating heavy pockets of 6 8 inches of SWE in the Milk River Basin in Canada and in an areas extending from east of Fort Peck, northwestward into Canada (Figure 3). In the lower Yellowstone and Little Missouri River Basins, snow cover is sparse, yet some remaining SWE and meltwater has not reached rivers and streams. Snow conditions at the end of March bare similarities to the mid March SWE in the Garrison reach that was present in In the Oahe reach, much of the snow in the tributaries west of the Missouri River has melted leaving only heavy pockets in tree rows and protected areas. Only a trace to 1 inch amounts covers the plains as a result of recent light snow. Areas within the Knife and Heart River Basins in North Dakota still contain small pockets of 2 3 inches of SWE (adjusted down from NOHRSC estimates). In the Oahe to Gavins Point reaches, trace to 0.5 inch amounts exist as a result of recent snows. In the Gavins Point to Sioux City reach, a trace to 0.5 inch coverage exists in the James and Big Sioux River Basins south of U.S. Highway 212 that runs through Watertown, SD. In mid March most of the plains snow melted as a result of warmer temperatures. In northern South Dakota and North Dakota, very limited snowmelt occurred in March, so with the approach of warmer temperatures at the end of March and beginning of April, snowmelt in the Big Sioux and the James River north of U.S. 212 will recommence. SWE in the upper James River Basin ranges from inches according to on the ground measurements, while in the Big Sioux north of Watertown, SWE ranges from 3 4 inches. Climate Outlook During the next five days temperatures in the Missouri Basin will be normal in southern portions of the basin; however colder temperatures will prevail in the Northern Plains with daily high temperatures expected to be 5 10 degrees Fahrenheit below normal. During the 6 10 day period, temperatures will continue to be below normal through the Northern Plains and Rockies, and normal in the lower basin. Through the remainder of April, temperatures will trend below normal (Figure 5). In terms of precipitation, during the next five days, the Missouri Basin will receive light precipitation in the Central Plains; however, a powerful winter storm will produce heavy snow in the Northern Rockies and a mix of rain and snow in the Northern Plains. During the 6 10 day period, the Northern Plains could continue to receive precipitation while the southern half of the Missouri River Basin will likely be dry. Through the end of April, the wet conditions in the north and dry conditions in the south are expected to continue (Figure 6). 2
22 During the April June period, temperatures are forecast to trend below normal from the Midwest to the Northern Rockies. Precipitation chances are forecast to be normal throughout the basin with the exception of above normal chances in North Dakota and northeast Montana. In relation to drought, normal (non drought) hydrologic conditions are expected to prevail in the Dakotas, Wyoming, Montana and Iowa through June (Figure 7). Moderate to severe drought already affecting eastern Colorado and western Kansas are expected to persist, while abnormally dry conditions and moderate drought will continue to develop in southern Nebraska and central Kansas. April 2011 Calendar Year Runoff Forecast The overall calendar year 2011 runoff forecast is 28.7 MAF (126% of normal) above Gavins Point Dam, which is an increase of 3.35 MAF over the March 2011 forecast. This increase is due in part to actual March runoff being higher than forecasted March runoff, an increase in forecasted runoff into the Garrison reach, and an increase in the expected mountain snowmelt runoff due to increased mountain SWE. The summation above Sioux City is 33.8 MAF (136% of normal), an increase of 4.0 MAF. The remaining plains snow pack ( inches of SWE) in the Fort Peck to Garrison reach north of the Missouri River has not melted, and as a result Garrison is expected to receive up to 1.5 MAF of runoff in the month of April, which represents about 0.75 inch of snowmelt runoff from the contributing area covered with snow (35,000 square miles). The total March April runoff forecast into Garrison is 2.9 MAF. Similar runoff volumes occurred in March and April of calendar years 1949 (2.9 MAF), 1960 (2.8 MAF), 1969 (3.4 MAF), and 1979 (4.5 MAF), which were all impacted by moderate to heavy plains snow in the Garrison reach. Mountain snow accumulations as a percent of long term averages are 116% of normal above Fort Peck and 112% of normal in the Fort Peck to Garrison reach. As a result, the May July runoff above Fort Peck is expected to be 115% of normal, while the Fort Peck to Garrison reach is expected to receive 109% of normal runoff using snow to runoff regression equations. Runoff in all reaches above the System are forecasted to return to normal by August 2011, while above average runoff is forecasted in the Gavins to Sioux City reach due to persistently high streamflow conditions. 3

23 Figure 1 March 30, 2011 Soil Moisture Ranking Percentile. Figure 2 30 day precipitation as a percent of normal, ending March 31,


24 Figure 3 Plains Snow Water Equivalent on March 31, Figure 4 Plains Snow Water Equivalent on March 10,
25 Figure 5 April 2011 temperature outlook. Figure 6 April 2011 precipitation outlook 6

26 Figure 7 U.S. Drought Outlook through June
27 May 2011 Calendar Year Runoff Forecast 2011 April Runoff April 2011 runoff above Sioux City, IA was 7713 kaf, 267% of normal. April 2011 runoff above Gavins Point Dam was 5632 kaf, 222% of normal. April 2011 runoff: Fort Peck 895 kaf (138% of normal), Garrison 2748 kaf (254% of normal), Oahe 1617 kaf (336% of normal), Fort Randall 238 kaf (165% of normal), Gavins Point 134 kaf (74% of normal), and Gavins to Sioux City 2081 kaf (578% of normal). While the bulk of the runoff in April occurred from plains snowmelt, precipitation in the basin during April was well above normal above the upper three projects and slightly above normal between Oahe and Sioux City. As of May 1, 2011 the accumulated runoff above Sioux City, IA was 18.0 maf (236% of normal), while above Gavins Point Dam, the accumulated runoff was 15.9 maf (220% of normal). Antecedent Moisture & Precipitation Soil moisture conditions on April 30, 2011 continue to rank very high in the Northern Plains and Rocky Mountains (Figure 1); and, percentile rankings have increased slightly from the March 31, 2011 rankings. Soil moisture percentiles range from the 95 th to the 99 th percentile in much of Montana including the Missouri River basin in western and northern Montana. Soil moisture ranks in the 99 th percentile in southwest Montana and northwest Wyoming in the headwaters of the Missouri and Yellowstone River basin. Across the Northern Plains region soil moisture ranks above normal, while in eastern Montana and most of the Dakotas percentiles rank above the 90 th percentile. In contrast, drier conditions have prevailed in the upper South Plate and Kansas River basins, thus soil moisture conditions rank normal to below normal (30 th percentile). The thirty day precipitation departure as a percent of normal ending on April 30, 2011 is shown in Figure 2. A precipitation pattern similar to March 2011 (Figure 3) occurred in April. The Northern Plains continued to receive abundant precipitation with over 200% of normal in the Fort Peck to Garrison reach, and areas of % of normal precipitation across Montana, northern Wyoming and North Dakota. Precipitation in the Fall of 2010 was 150% of normal in the Northern Plains; however, in the Rocky Mountains, precipitation accumulations were below normal. Mountain Snow Pack Mountain snowpack is the primary factor used to predict May July natural runoff volumes in the Fort Peck and Fort Peck to Garrison mainstem reaches. Greater than average mountain snow accumulations are usually associated with greater than average May July runoff volumes, especially when greater than average runoff and snow accumulations occur in successive years. 1
28 Mountain snowpack as of March 31, 2011 was 116% of normal above Fort Peck and 112% of normal in the Fort Peck to Garrison reach. By April 15, 2011, the average date of the mountain snow accumulation, snowpack above Fort Peck rose to 126% of normal while snowpack between Fort Peck and Garrison rose to 121% of normal. During the final 15 days of April, mountain snow continued to accumulate, and on May 1, 2011, the mountain snow accumulations above Fort Peck and from Fort Peck to Garrison were 153 and 141% of normal, respectively. As a percent of peak accumulation 140% of normal was present above Fort Peck, while 136% of normal was present between Fort Peck and Garrison. The Missouri River basin mountain snowpack normally peaks around April 15, and the current snowpack appeared to be peaking in early May. Since 1987, the 2011 peak accumulation above Fort Peck is higher than the 135% that occurred in 1997, while the 2011 peak accumulation from Fort Peck to Garrison is second highest to the 139% that occurred in Table 1. Mountain snowpack accumulation as a percent of normal. Date Above Fort Peck Fort Peck to Garrison February 28, March 31, April 15, May 1, May 1, 2011 % of Average Peak Plains Snow Pack The Plains snow pack melted in the Missouri River Basin from mid March through early April resulting in high runoff volumes entering the mainstem reservoirs in March and April. As of May 1, 2011, only small pockets of snow remained in northern Montana where deep accumulations occurred in drifts and ditches. Additional snowmelt will not impact runoff into the mainstem reservoirs; however, existing recession flows will continue to keep streamflows higher than average. Climate Outlook During the two weeks temperatures in the Missouri River Basin above Sioux City will likely trend below normal daily temperatures with increased chances of precipitation in the Northern Plains and Northern Rocky Mountains. Through the end of May, precipitation chances are expected to be greater than normal in the Northern Plains and Rockies with a continuing cooler than normal pattern in the Northern Rockies and Plains (Figure 4). During the May July period (Figure 5), temperatures are again expected to be below normal from the Northern Rockies into the Midwest, while the outlook for precipitation will be normal, with slightly above normal chances in the Northern Plains and lower Missouri River basin. With regard to drought, most traces in the Missouri River basin above Sioux City are gone; however, moderate to severe drought conditions have developed in the South Platte River basin, while moderate 2
29 conditions have developed in the Kansas River basin. During the next three months, these drought conditions are expected to persist in these basins (Figure 6). May 2011 Calendar Year Runoff Forecast The overall calendar year 2011 runoff forecast is 36.0 MAF (158% of normal) above Gavins Point Dam, while the total system runoff above Sioux City is forecast to be 44.0 MAF (178% of normal). The increase from the April 1 forecasts (33.8 maf above Sioux City and 28.8 maf above Gavins Point) is due to greater than expected April runoff and significant increases in mountain snowpack totals during the month of April. During the critical runoff months of May, June and July, forecasted runoff into the mainstem reservoir system above Gavins Point are forecasted to total 4505 kaf (the equivalent of 73 kcfs/day) in May, 7655 kaf (124 kcfs/day) in June, and 4500 kaf (73 kcfs/day) in July. Fort Peck & Garrison The May July runoff forecast is based on regression equations that relate the peak mountain snow accumulations to May July runoff volumes. As of May 1, 2011 the Fort Peck basin contained 140% of the normal April 15 peak mountain snowpack, while the Fort Peck to Garrison basin contained 136% of the normal April 15 peak mountain snowpack. Total forecasted runoff from May July above Fort Peck is 6230 kaf (177% of normal). This forecast would rank the May July runoff period above Fort Peck as the 5th highest of record since Likewise, total runoff forecast to occur during May July in the Fort Peck to Garrison reach is 8527 kaf (150% of normal). This forecast would rank the May July runoff period from Garrison to Fort Peck as the 10th highest of record since Above Fort Peck, the distribution of the May July forecasted runoff is 31% (May), 46% (June) and 23% (July). In the Fort Peck to Garrison reach, the distribution of the May July forecasted runoff is 22% (May), 47% (June), and 31% (July). These distributions are based on historic runoff patterns. Runoff into both of these projects are forecasted to be above normal in August as the high streamflows recede from the snowmelt runoff, and subsequent months runoff returns to more normal conditions. Oahe, Fort Randall & Gavins Point Since Oahe received much greater than normal runoff in March and April, and streamflows continue to be high in the Oahe reach, expect runoff volumes in May to be greater than normal, but slowly recede to normal by August. Runoff volumes into Fort Randall and Gavins Point are expected to be normal assuming normal conditions. Sioux City In the Gavins Point to Sioux City reach, we expect May runoff from the James, Vermillion and Big Sioux Rivers to contribute 1,370 kaf (20,600 cfs/day). This forecast was determined by receding the May 1, 2011 discharge in each river at their historic recession rates. We expect subsequent runoff volumes in this reach to be above normal through the remainder of the calendar year due to elevated contributions from the James and Big Sioux River basins from persistent wet soil conditions. The forecasted calendar 3
30 year runoff in the Gavins to Sioux City reach is expected to be 7980 kaf, almost 400% of normal, but less than the 520% of normal received in

31 Figure 1. April 30, 2011 Soil Moisture Ranking Percentile. 5


32 Figure day precipitation as a percent of normal, ending April 30, Figure day precipitation as a percent of normal, ending March 31,
33 Figure 4. May 2011 temperature and precipitation outlook. 7
34 Figure 5. May July 2011 temperature and precipitation outlook. 8

35 Figure 6 U.S. Drought Outlook through July
36 June 2011 Calendar Year Runoff Forecast 2011 May Runoff May 2011 runoff above Sioux City, IA was 10,468 kaf, 321% of normal. May inflow was the 2 nd highest monthly total of all months from , exceeded only in April 1952 (13,200 kaf), and the highest May runoff (previous record May was 7200 kaf in 1995). May 2011 runoff above Gavins Point Dam was 8,866 kaf, 298% of normal. May 2011 runoff: Fort Peck 2,871 kaf (266% of normal), and highest May of record, Garrison 4,414 kaf (355% of normal), and highest May of record, Oahe 1,259 kaf (403% of normal), Fort Randall 305 kaf (207% of normal), Gavins Point 17 kaf (9% of normal), and Gavins to Sioux City 1603 kaf (549% of normal). A large majority of the inflow occurred as a result of extremely high amounts of rainfall that covered all of Montana, northern Wyoming, and western South and North Dakota. These areas received at a minimum 3.0 inches more rainfall than normal May rainfall amounts. Many areas in Montana received between 4 and 8 inches greater than normal precipitation. Rainfall is discussed further in the next section. Additionally, some snowmelt occurred in the Northern Rockies, but continued accumulation slowed the decline in existing snowpack. As of June 1, 2011 the accumulated runoff above Sioux City, IA was maf (262% of normal), while above Gavins Point Dam, the accumulated runoff was maf (233% of normal). Antecedent Moisture & Precipitation Soil moisture conditions on May 31, 2011 increased in the Northern Plains and Rocky Mountains (Figure 1); and, percentile rankings increased to 99 th percentile rankings throughout Montana, Wyoming, and parts of the Dakotas. A monumental amount of precipitation occurred throughout the upper Missouri River Basin in May (Figure 1). In Montana and northern Wyoming, a large area received greater than 10 inches of rainfall. Billings, MT received 9.54 inches (7.06 inches above normal), Glasgow, MT received 6.97 inches (5.25 inches above normal), Lander, WY received 6.77 inches (4.35 inches above normal), and Zortman, MT received inches (more than 14 inches above normal). Also areas near Bighorn Reservoir (Yellowtail Dam) received greater than 15 inches during the month. Departures from normal are shown in Figure 2. This weather pattern was influenced by a mean trough of low pressure over the Pacific Northwest, which although normal in May, it was particularly strong. The trough guided a number of areas of low pressure through the area causing repeated precipitation in the Northern Rockies and Plains. 1
37 Figure 1. May 2011 precipitation in the Missouri River Basin. Source: NOAA. Figure 2. May 2011 precipitation departures in the Missouri River Basin. Source: NOAA. 2
38 Mountain Snow Pack Mountain snowpack is the primary factor used to predict May July natural runoff volumes in the Fort Peck and Fort Peck to Garrison mainstem reaches. Greater than average mountain snow accumulations are usually associated with greater than average May July runoff volumes, especially when greater than average runoff and snow accumulations occur in successive years. Mountain snowpack as of March 31, 2011 was 116% of normal above Fort Peck and 112% of normal in the Fort Peck to Garrison reach. By April 15, 2011, the average date of the mountain snow accumulation, snowpack above Fort Peck rose to 126% of normal while snowpack between Fort Peck and Garrison rose to 121% of normal. During the final 15 days of April, mountain snow continued to accumulate, and on May 1, 2011, the mountain snow accumulations above Fort Peck and from Fort Peck to Garrison were 153 and 141% of normal, respectively. As a percent of peak accumulation, snow peaked at 141% of normal above Fort Peck and 136% of normal between Fort Peck and Garrison on May 2, The Missouri River basin mountain snowpack normally peaks around April 15, and the current snowpack appeared to be peaking in early May. Although the mountain snowpack has declined since May 2, continued accumulations due to persistent snowfall and cooler than normal temperatures have slowed mountain snowmelt. As of June 1, 2011, 104% of the normal peak accumulation existed above Fort Peck, and 127% of the normal peak accumulation existed in the Fort Peck to Garrison reach. As a percent of normal for June 1, above Fort Peck the snow accumulation was 243% of normal, and between Fort Peck and Garrison Dams it was 281% of normal. For forecasting purposes, it was determined that 75% of the Fort Peck peak accumulation existed on June 1 and 95% of the Fort Peck to Garrison peak accumulation existed. Table 1. Mountain snowpack accumulation as a percent of normal. Date Above Fort Peck Fort Peck to Garrison February 28, March 31, April 15, May 1, May 2, 2011 % of Average Peak June 1, 2011 % of Average Peak Climate Outlook During the first two weeks of June, probabilities for precipitation will be greater than normal in the upper Missouri River Basin. Temperatures are expected to be cooler than normal, slowing the mountain snowmelt after a brief period of warm weather end June 4. During the month of June the Climate Prediction Center is forecasting higher probabilities that temperatures will be below normal in the Upper Basin, as a result of continued cloudiness and precipitation expected to move through the area. This trend will likely delay or slow the rate of mountain snowmelt initially; however, by late June, a majority of the mountain snow is expected to be melted with the exception of the high elevation snow. 3
39 Precipitation is expected to be influenced by continued troughing over the Pacific Northwest, which will create greater than average precipitation chances for much of the Missouri River basin, especially the Northern Plains. Two week temperatures in the Missouri River Basin above Sioux City will likely trend below normal daily temperatures with increased chances of precipitation in the Northern Plains and Northern Rocky Mountains. Through the end of May, precipitation chances are expected to be greater than normal in the Northern Plains and Rockies with a continuing cooler than normal pattern in the Northern Rockies and Plains (Figure 4). During the May July period (Figure 5), temperatures are again expected to be below normal from the Northern Rockies into the Midwest, while the outlook for precipitation will be normal, with slightly above normal chances in the Northern Plains and lower Missouri River basin. With regard to drought, most traces in the Missouri River basin above Sioux City are gone; however, moderate to severe drought conditions have developed in the South Platte River basin, while moderate conditions have developed in the Kansas River basin. During the next three months, these drought conditions are expected to persist in these basins (Figure 6). May June 2011 Calendar Year Runoff Forecast The overall calendar year 2011 runoff forecast is 54.6 MAF (220% of normal) above Gavins Point Dam, while the total system runoff above Sioux City is forecast to be 46.2 MAF (203% of normal). The increase from the April 1 forecasts (44.0 maf above Sioux City and 36.0 maf above Gavins Point) is due to the much greater than expected May runoff from Fort Peck to Oahe and significant increases in the Fort Peck and Garrison June July forecast runoff. Fort Peck & Garrison Methodology The methodology used to forecast runoff into Fort Peck and Garrison Reservoirs in June and July relied on mountain snowpack, temperature and precipitation. Three sets of equations described in the D 96 report were used including: 1) the June 1 % of normal equation, 2) Peak SWE equation, and 3) the Peak SWE, P & T The June 1 Percent of Normal equation (1) uses the percent of normal snowpack on June 1 in the two reaches to compute a May July natural runoff volume. On June 1, snow pack was 243% and 281% of normal in the Fort Peck and Garrison reaches, respectively. This equation yielded the lowest threemonth runoff volumes. The Peak SWE equation (2) uses the percent of peak snowpack accumulation to compute the May July runoff volume. Mountain snowpack peaked at 141 and 136% of normal on May 2, 2011 above Fort Peck and from Fort Peck to Garrison, respectively. This equation yields a higher three month runoff volume than the June 1 percent of normal. 4
40 The third estimate used the Peak SWE, Temperature and Precipitation equation (3). The temperature component is an April June ratio of monthly maximum daily temperature compared to normal maximum daily temperatures at a total of six long term monitoring stations in Montana and Wyoming. Forecast Parameters Maximum daily temperatures compared to normal were computed as 88% and 92% of normal in April and May above Fort Peck, and 94% and 87% of normal in April and May between Fort Peck and Garrison. June temperatures were assumed to be 94% of normal based the current trend and outlook, for overall three month values of 91% above Fort Peck and 92% between Fort Peck and Garrison. The affect of lower than average maximum daily temperatures is two fold: it delays the melting of mountain snowpack and allows the accumulation of precipitation in the form of snow, both increasing the volume of May July runoff. The precipitation component is a ratio of total May July precipitation to average May July precipitation at a total of 13 monitoring stations. Precipitation as compared to normal was computed as 168% of normal above Fort Peck and 321% of normal from Fort Peck to Garrison in May. Precipitation in June and July were estimated to be 130% and 150% in June above Fort Peck and from Fort Peck to Garrison, respectively; and, 100% of normal in July. The overall three month values were 133% and 190%. The affect of above normal precipitation is to increase May July runoff volumes by both increasing runoff and building additional snowpack. Since the computed May runoff volumes far exceeded the May 1 forecast, the June July forecasted runoff volumes were divided between the remaining months by both dividing it according to historic monthly ratios, and apportioning it according to the remaining mountain snow pack. Above Fort Peck, 25% of the peak snow pack amount had melted, so 50% and 25% were assigned to June and July. From Fort Peck to Garrison, about 5% of the peak snow pack had melted (95% of peak remaining) so 57% and 38% was assigned to June and July, respectively. These estimates assume 75% of the three month computed runoff will occur in June and July above Fort Peck, and 95% of the computed runoff will occur in June and July from Fort Peck to Garrison. Forecast Results A summary of computations using the three equations is presented in Attachment 1. The forecast results are compared in Table 2. The forecast provide a range of inflow volumes based on various basin conditions. When existing and future precipitation and temperature are taken into consideration in Method 3, a very conservative estimate is computed. Late May preliminary forecasts used to compute reservoir releases at the onset of the May rainfall runoff event are provided in Table 3. These estimates included three methods including: 4) preliminary runoff volumes patterned to the 1997 inflow hydrographs, 5) runoff volumes patterned to the 1997 hydrographs with an early May storm, and 6) an additional 10% increase to Method 5. These runoff forecasts are provided in Table 3. Table 2. June 1 June July Forecast Results. Above Fort Peck, kaf Fort Peck to Garrison, kaf 5
41 (1) June 1 Percent of Normal (2) Peak SWE + 10% (3) Peak SWE, P & T June July (75%) 3,551 5,158 5,859 June (50%) July (25%) June July (95%) 2,368 1,184 7,471 3,422 1,736 8,910 3,906 1,953 10,353 June (57%) July (38%) 4,482 5,346 6,212 2,988 3,564 4,141 Table 3. Preliminary June July Forecast Results. (4) 1997 Pattern (5) 1997 Pattern + storm (6) 1997 Pattern + storm + 10% Above Fort Peck, kaf June July 4,632 5,037 5,541 Fort Peck to Garrison, kaf June July 7,440 8,237 9,061 The June 1 forecasts in Table 2 are very comparable to the late May preliminary forecasts in Table 3, thus they verify that the preliminary estimates provided good initial operating plans for the mainstem system of reservoirs. The June 1 operating plan was determined by both the Peak SWE + 10% (2) runoff forecast and the Peak SWE, P & T (3) runoff forecasts. The June 1 June July forecast for Fort Peck is 5,158 kaf (212% of normal) above Fort Peck and 8,910 kaf (200% of normal) from Fort Peck to Garrison. After further discussion of the reservoir operation plan, the June July forecast was revised to 5,859 kaf (240% of normal) above Fort Peck and 10,353 kaf (233% of normal) from Fort Peck to Garrison, which is the Peak SWE, P & T (3) method. This forecast was used because it was based on actual mountain SWE, April May temperatures, and May precipitation. Furthermore, it puts more stress on the already sensitive high pools in the upper three reservoirs; therefore, maximizing the reservoir release plan in order to attain greater flexibility later in the summer. Oahe, Fort Randall & Gavins Point Since Oahe received much greater than normal runoff in March, April and May, the June and July forecast runoff is expected to remain above normal. Fort Randall and Gavins Point runoff is expected to be normal through the remainder of the year. Sioux City James, Vermillion, and Big Sioux River flows continued to be higher than normal in the Gavins Point to Sioux City reach. Since May inflows were 1,603 kaf (549% of normal), inflows through the end of the year are forecast to be high. June inflows are forecast to be 1,100 kaf (385% of normal) while July inflows are forecast to be 600 kaf (275% of normal). 6

42 Figure 3. MAY 31, 2011 Soil Moisture Ranking Percentile. 7
43 Figure 4. May June 2011 temperature and precipitation outlook. 8
44 July 2011 Calendar Year Runoff Forecast 2011 June Runoff June 2011 runoff above Sioux City, IA was 13,836 KAF, 260% of normal. June inflow was the highest monthly total of all months from , while May 2011 (10,468 KAF) was third of all time. Prior to 2011, the highest June runoff was 9,800 KAF in June 2011 runoff above Gavins Point Dam was 12,744 KAF, 253% of normal. June 2011 runoff: Fort Peck 4,035 KAF (250% of normal), and 2 nd highest June of record, Garrison 6,467 KAF (242% of normal), and highest June/month of record, Oahe 1,009 KAF (239% of normal), Fort Randall 932 KAF (613% of normal), and highest June of record, Gavins Point 301 KAF (169% of normal), and Gavins Point to Sioux City 1,092 KAF (382% of normal), and 4 th highest May of record. Much of the inflow occurred as a result of mountain snowmelt runoff, heavy precipitation in Montana, and heavy precipitation in the Dakotas. Mountain snowmelt coupled with abundant precipitation in Montana produced high runoff volumes into Fort Peck and Garrison Reservoirs. Snowmelt runoff was overshadowed by rainfall, therefore a number of runoff peaks occurred into Fort Peck and Garrison. In the Dakotas a series of intense thunderstorms occurred from mid to late June in the Oahe, Fort Randall, Gavins Point, and Sioux City reaches. As of July 1, 2011 the accumulated runoff above Sioux City, IA was 42.3 MAF (261% of normal), while above Gavins Point Dam, the accumulated runoff was 35.6 MAF (240% of normal). Hydrologic Factors Soil Moisture Conditions Soil moisture conditions across the upper Missouri River basin continue to be extremely wet (Figure 1). Soil moisture conditions on June 30, 2011, were in the 99 th ranking percentile across a majority of Montana except for western Montana which was in the 80 th to 95 th ranking percentile. Western North and South Dakota were also ranked in the 99 th percentile for moisture with 80 th to 95 th rankings in the much of the Missouri River basin from the mouth of the Platte River upstream. Figure 2 shows changes to soil moisture anomalies from May 31 to June 27. During June, soil moisture anomalies increased by 50 to 70 mm (soil became wetter) across much of western Montana, while central and southeastern Montana and Wyoming soil moisture decreased in moisture anomaly, indicating some drying. Soil moisture anomalies increased by 50 to 80 mm from eastern North Dakota through central South Dakota into western Nebraska as a result of very heavy rains during June. Increases in soil moisture also occurred in Iowa and northern Missouri. 1


45 Figure 1. Soil Moisture Ranking Percentile as of June 27, Figure 2. Soil moisture anomaly change since May 31,
46 June Precipitation June rainfall continued to be well above normal in many locations across the Missouri River Basin including northern and central Montana which received 3.0 to 6.0 plus inches, and the Dakotas, Nebraska, Iowa, northeast Kansas and the northern half of Missouri, which generally received amounts ranging from 2.5 to 6.0 plus inches. The June 2011 precipitation accumulation is shown in Figure 3. Precipitation departures are shown in Figure 4. Departures across Montana were generally greater than 1.0 inch in many locations while areas in excess of 3.0 inches occurred in the vicinity of Great Falls, MT, and in much of northeast Montana. Departures greater than 3.0 inches occurred in an area extending from central North Dakota through northern Nebraska. In addition some areas in Iowa and northern Missouri received more than 3.0 inches above normal. Point rainfall amounts in June include: 3.13 inches in Miles City, MT; 5.13 inches in Glasgow, MT; 2.55 inches in Great Falls, MT, 4.22 inches in Lewistown, MT; 3.94 inches in Helena, MT; 5.98 inches in Wolf Point, MT; 1.67 inches in Sheridan, WY; 0.55 inches in Lander, WY; 3.19 inches in Bismarck, ND; 5.67 inches in Jamestown, ND; 4.69 inches in Aberdeen, SD; 5.07 inches in Mobridge, SD; 7.73 inches in Pierre, SD; 4.26 inches in Sioux Falls, SD; and 5.03 inches in Sioux City, IA. May Precipitation A monumental amount of precipitation occurred throughout the upper Missouri River Basin in May (Figure 5). In Montana and northern Wyoming, a large area received greater than 10 inches of rainfall. Billings, MT received 9.54 inches (7.06 inches above normal), Glasgow, MT received 6.97 inches (5.25 inches above normal), Lander, WY received 6.77 inches (4.35 inches above normal), and Zortman, MT received inches (more than 14 inches above normal). Also areas near Bighorn Reservoir (Yellowtail Dam) received greater than 15 inches during the month. Departures from normal are shown in Figure 6. This weather pattern was influenced by a mean trough of low pressure over the Pacific Northwest, which although a normal occurrence during spring, it was particularly strong in May The trough guided a number of low pressure systems through the area causing repeated precipitation in the Northern Rockies and Plains. 3


47 Figure 3. June 2011 precipitation in the Missouri River Basin. Source: NOAA. Figure 4. June 2011 precipitation departures in the Missouri River Basin. Source: NOAA. 4


48 Figure 5. May 2011 precipitation in the Missouri River Basin. Source: NOAA. Figure 6. May 2011 precipitation departures in the Missouri River Basin. Source: NOAA. 5
Upper Missouri River Basin December 2017 Calendar Year Runoff Forecast December 5, 2017
 Upper Missouri River Basin December 2017 Calendar Year Runoff Forecast December 5, 2017 Calendar Year Runoff Forecast Explanation and Purpose of Forecast U.S. Army Corps of Engineers, Northwestern Division
Upper Missouri River Basin February 2018 Calendar Year Runoff Forecast February 6, 2018
 Upper Missouri River Basin February 2018 Calendar Year Runoff Forecast February 6, 2018 Calendar Year Runoff Forecast Explanation and Purpose of Forecast U.S. Army Corps of Engineers, Northwestern Division
Upper Missouri River Basin January 2018 Calendar Year Runoff Forecast January 3, 2018
 Calendar Year Runoff Forecast Upper Missouri River Basin January 2018 Calendar Year Runoff Forecast January 3, 2018 Explanation and Purpose of Forecast U.S. Army Corps of Engineers, Northwestern Division
Upper Missouri River Basin May 2018 Calendar Year Runoff Forecast May 4, 2018
 Calendar Year Runoff Forecast Explanation and Purpose of Forecast Upper Missouri River Basin May 2018 Calendar Year Runoff Forecast May 4, 2018 U.S. Army Corps of Engineers, Northwestern Division Missouri
Missouri River Basin Water Management
 Missouri River Basin Water Management US Army Corps of Engineers Missouri River Navigator s Meeting February 12, 2014 Bill Doan, P.E. Missouri River Basin Water Management US Army Corps of Engineers BUILDING
Missouri River Basin Water Management Monthly Update
 Missouri River Basin Water Management Monthly Update Participating Agencies 255 255 255 237 237 237 0 0 0 217 217 217 163 163 163 200 200 200 131 132 122 239 65 53 80 119 27 National Oceanic and Atmospheric
Missouri River Basin Water Management Monthly Update
 Missouri River Basin Water Management Monthly Update Participating Agencies 255 255 255 237 237 237 0 0 0 217 217 217 163 163 163 200 200 200 131 132 122 239 65 53 80 119 27 National Oceanic and Atmospheric
Missouri River Basin Climate Outlook 1 May Dr. Dennis Todey State Climatologist South Dakota State Univ.
 Missouri River Basin Climate Outlook 1 May 2014 Dr. Dennis Todey State Climatologist South Dakota State Univ. dennis.todey@sdstate.edu 605-688-5141 Photo taken Feb 19, 2013 General Information Providing
Oregon Water Conditions Report April 17, 2017
 Oregon Water Conditions Report April 17, 2017 Mountain snowpack continues to maintain significant levels for mid-april. By late March, statewide snowpack had declined to 118 percent of normal after starting
NIDIS Drought and Water Assessment
 NIDIS Drought and Water Assessment PRECIPITATION The images above use daily precipitation statistics from NWS COOP, CoCoRaHS, and CoAgMet stations. From top to bottom, and left to right: most recent 7-days
MISSOURI RIVER BASIN WATER MANAGEMENT SPRING 2019 PUBLIC MEETINGS
 MISSOURI RIVER BASIN WATER MANAGEMENT SPRING 2019 PUBLIC MEETINGS April 9 11:00 a.m. Fort Peck, MT April 9 6:00 p.m. Bismarck, ND April 10 10:00 a.m. Pierre, SD April 10 4:00 p.m. Sioux City, IA April
Weather and Climate Summary and Forecast Winter
 Weather and Climate Summary and Forecast Winter 2016-17 Gregory V. Jones Southern Oregon University February 7, 2017 What a difference from last year at this time. Temperatures in January and February
Summary of Actual 2010 Regulation
 US Army Corps of Engineers Northwestern Division Missouri River Mainstem Reservoir System Summary of Actual 2010 Regulation Missouri River Basin Fort Peck Garrison Oahe Big Bend Gavins Point Fort Randall
National Wildland Significant Fire Potential Outlook
 National Wildland Significant Fire Potential Outlook National Interagency Fire Center Predictive Services Issued: April 1, 2008 Next Issue: May 1, 2008 Wildland Fire Outlook April 2008 through July 2008
Flood Risk Assessment
 Flood Risk Assessment February 14, 2008 Larry Schick Army Corps of Engineers Seattle District Meteorologist General Assessment As promised, La Nina caused an active winter with above to much above normal
Weather and Climate Summary and Forecast October 2017 Report
 Weather and Climate Summary and Forecast October 2017 Report Gregory V. Jones Linfield College October 4, 2017 Summary: Typical variability in September temperatures with the onset of fall conditions evident
Central Region Climate Outlook May 15, 2014
 Central Region Climate Outlook May 15, 2014 Dr. Jim Angel State Climatologist IL State Water Survey University of Illinois jimangel@illinois.edu 217-333-0729 Chicago-area flooding General Information Providing
Weather and Climate Summary and Forecast February 2018 Report
 Weather and Climate Summary and Forecast February 2018 Report Gregory V. Jones Linfield College February 5, 2018 Summary: For the majority of the month of January the persistent ridge of high pressure
Missouri River Flood Task Force River Management Working Group Improving Accuracy of Runoff Forecasts
 Missouri River Flood Task Force River Management Working Group Improving Accuracy of Runoff Forecasts Kevin Grode, P.E. Reservoir Regulation Team Lead Missouri River Basin Water Management Northwestern
NIDIS Intermountain West Drought Early Warning System February 12, 2019
 NIDIS Intermountain West Drought Early Warning System February 12, 2019 Precipitation The images above use daily precipitation statistics from NWS COOP, CoCoRaHS, and CoAgMet stations. From top to bottom,
INVISIBLE WATER COSTS
 Every Drop Every Counts... Drop Counts... INVISIBLE WATER COSTS Corn - 108.1 gallons per pound How much water it takes to produce... Apple - 18.5 gallons to grow Beef - 1,581 gallons per pound Oats - 122.7
Weather and Climate Summary and Forecast March 2018 Report
 Weather and Climate Summary and Forecast March 2018 Report Gregory V. Jones Linfield College March 7, 2018 Summary: The ridge pattern that brought drier and warmer conditions from December through most
Central Region Climate Outlook March20, 2014
 Central Region Climate Outlook March20, 2014 Dr. Jim Angel State Climatologist IL State Water Survey University of Illinois jimangel@illinois.edu 217-333-0729 Happy Spring Equinox! General Information
National Wildland Significant Fire Potential Outlook
 National Wildland Significant Fire Potential Outlook National Interagency Fire Center Predictive Services Issued: September, 2007 Wildland Fire Outlook September through December 2007 Significant fire
NIDIS Intermountain West Drought Early Warning System January 15, 2019
 NIDIS Drought and Water Assessment NIDIS Intermountain West Drought Early Warning System January 15, 2019 Precipitation The images above use daily precipitation statistics from NWS COOP, CoCoRaHS, and
Summary of Actual Operations
 Missouri River Region US Army Corps of Engineers Since 1953 Reservoir Control Center Northwestern Division Missouri River Region Reservoir Control Center Missouri River Basin Fort Peck Montana Garrison
NIDIS Intermountain West Drought Early Warning System April 18, 2017
 1 of 11 4/18/2017 3:42 PM Precipitation NIDIS Intermountain West Drought Early Warning System April 18, 2017 The images above use daily precipitation statistics from NWS COOP, CoCoRaHS, and CoAgMet stations.
Monthly Long Range Weather Commentary Issued: February 15, 2015 Steven A. Root, CCM, President/CEO
 Monthly Long Range Weather Commentary Issued: February 15, 2015 Steven A. Root, CCM, President/CEO sroot@weatherbank.com JANUARY 2015 Climate Highlights The Month in Review During January, the average
Weather and Climate Summary and Forecast January 2018 Report
 Weather and Climate Summary and Forecast January 2018 Report Gregory V. Jones Linfield College January 5, 2018 Summary: A persistent ridge of high pressure over the west in December produced strong inversions
SEPTEMBER 2013 REVIEW
 Monthly Long Range Weather Commentary Issued: October 21, 2013 Steven A. Root, CCM, President/CEO sroot@weatherbank.com SEPTEMBER 2013 REVIEW Climate Highlights The Month in Review The average temperature
January 25, Summary
 January 25, 2013 Summary Precipitation since the December 17, 2012, Drought Update has been slightly below average in parts of central and northern Illinois and above average in southern Illinois. Soil
Midwest and Great Plains Climate- Drought Outlook 17 April 2014
 Midwest and Great Plains Climate- Drought Outlook 17 April 2014 Dr. Dennis Todey State Climatologist South Dakota State Univ. dennis.todey@sdstate.edu 605-688-5141 Photo taken Feb 19, 2013 Tornado-Trenton,
PRECIPITATION. Last Week Precipitation:
 2/24/2015 NIDIS Drought and Water Assessment PRECIPITATION The images above use daily precipitation statistics from NWS COOP, CoCoRaHS, and CoAgMet stations. From top to bottom, and left to right: most
Missouri River Basin Water Management Monthly Update
 Missouri River Basin Water Management Monthly Update Participating Agencies 255 255 255 237 237 237 0 0 0 217 217 217 163 163 163 200 200 200 131 132 122 239 65 53 80 119 27 National Oceanic and Atmospheric
Illinois Drought Update, December 1, 2005 DROUGHT RESPONSE TASK FORCE Illinois State Water Survey, Department of Natural Resources
 Illinois Drought Update, December 1, 2005 DROUGHT RESPONSE TASK FORCE Illinois State Water Survey, Department of Natural Resources For more drought information please go to http://www.sws.uiuc.edu/. SUMMARY.
NIDIS Intermountain West Drought Early Warning System February 6, 2018
 NIDIS Intermountain West Drought Early Warning System February 6, 2018 Precipitation The images above use daily precipitation statistics from NWS COOP, CoCoRaHS, and CoAgMet stations. From top to bottom,
Missouri Basin Climate Outlook. 4 April 2014
 Missouri Basin Climate Outlook Dr. Dennis Todey South Dakota State Climatologist South Dakota State University 4 April, 2014 Dennis.todey@sdstate.edu 605-688-5141 4 April 2014 Gavins Point Dam July 2011
Preliminary Runoff Outlook February 2018
 Preliminary Runoff Outlook February 2018 Prepared by: Flow Forecasting & Operations Planning Water Security Agency General Overview The Water Security Agency (WSA) is preparing for 2018 spring runoff including
Oregon Water Conditions Report May 1, 2017
 Oregon Water Conditions Report May 1, 2017 Mountain snowpack in the higher elevations has continued to increase over the last two weeks. Statewide, most low and mid elevation snow has melted so the basin
Midwest and Great Plains Drought and Climate Summary 20 February 2014
 Midwest and Great Plains Drought and Climate Summary 20 February 2014 Wendy Ryan Assistant State Climatologist Colorado Climate Center Colorado State University wendy.ryan@colostate.edu 970-491-8506 General
The following information is provided for your use in describing climate and water supply conditions in the West as of April 1, 2003.
 Natural Resources Conservation Service National Water and Climate Center 101 SW Main Street, Suite 1600 Portland, OR 97204-3224 Date: April 8, 2003 Subject: April 1, 2003 Western Snowpack Conditions and
-Assessment of current water conditions. - Precipitation Forecast. - Recommendations for Drought Monitor
 April 27, 2010 -Assessment of current water conditions - Precipitation Forecast - Recommendations for Drought Monitor 7 Day Precipitation 19-25 April 2010 Month-to-Date Precipitation 1-25 April 2010
NIDIS Intermountain West Regional Drought Early Warning System February 7, 2017
 NIDIS Drought and Water Assessment NIDIS Intermountain West Regional Drought Early Warning System February 7, 2017 Precipitation The images above use daily precipitation statistics from NWS COOP, CoCoRaHS,
Weather and Climate Summary and Forecast Winter
 Weather and Climate Summary and Forecast Winter 2016-17 Gregory V. Jones Southern Oregon University December 5, 2016 Well after an October that felt more like November, we just finished a November that
2012 Growing Season Weather Summary for North Dakota. Adnan Akyüz and Barbara A. Mullins Department of Soil Science October 30, 2012
 2012 Growing Season Weather Summary for North Dakota Adnan Akyüz and Barbara A. Mullins Department of Soil Science October 30, 2012 Introduction The 2012 growing season (the period from April through September)
Weather and Climate Summary and Forecast Summer 2017
 Weather and Climate Summary and Forecast Summer 2017 Gregory V. Jones Southern Oregon University August 4, 2017 July largely held true to forecast, although it ended with the start of one of the most extreme
Midwest/Great Plains Climate-Drought Outlook September 20, 2018
 Midwest/Great Plains Climate-Drought Outlook September 20, 2018 Brian Fuchs National Drought Mitigation Center University of Nebraska-Lincoln School of Natural Resources September 20, 2018 General Information
Wind River Indian Reservation and Surrounding Area Climate and Drought Summary
 Northern Arapaho Tribe Wind River Indian Reservation and Surrounding Area Climate and Drought Summary Spring Events & Summer Outlook 2015 Spring Was Warm And Very Wet Across The Region The spring season
Weather and Climate Summary and Forecast November 2017 Report
 Weather and Climate Summary and Forecast November 2017 Report Gregory V. Jones Linfield College November 7, 2017 Summary: October was relatively cool and wet north, while warm and very dry south. Dry conditions
Weather and Climate Summary and Forecast Fall/Winter 2016
 Weather and Climate Summary and Forecast Fall/Winter 2016 Gregory V. Jones Southern Oregon University November 5, 2016 After a year where we were seemingly off by a month in terms of temperatures (March
Weather and Climate Summary and Forecast April 2018 Report
 Weather and Climate Summary and Forecast April 2018 Report Gregory V. Jones Linfield College April 4, 2018 Summary: A near Miracle March played out bringing cooler and wetter conditions to the majority
Weather and Climate Summary and Forecast December 2017 Report
 Weather and Climate Summary and Forecast December 2017 Report Gregory V. Jones Linfield College December 5, 2017 Summary: November was relatively cool and wet from central California throughout most of
PRECIPITATION. Last Week Precipitation:
 12/3/2014 NIDIS Drought and Water Assessment PRECIPITATION The images above use daily precipitation statistics from NWS COOP, CoCoRaHS, and CoAgMet stations. From top to bottom, and left to right: most
2016 Fall Conditions Report
 2016 Fall Conditions Report Prepared by: Hydrologic Forecast Centre Date: December 13, 2016 Table of Contents TABLE OF FIGURES... ii EXECUTIVE SUMMARY... 1 BACKGROUND... 5 SUMMER AND FALL PRECIPITATION...
Weather and Climate Summary and Forecast March 2019 Report
 Weather and Climate Summary and Forecast March 2019 Report Gregory V. Jones Linfield College March 2, 2019 Summary: Dramatic flip from a mild winter to a top five coldest February on record in many locations
Weather and Climate Summary and Forecast Summer into Harvest 2016
 Weather and Climate Summary and Forecast Summer into Harvest 2016 Gregory V. Jones Southern Oregon University September 3, 2016 With school and football season starting a hint of fall is right on time
Monthly Long Range Weather Commentary Issued: APRIL 1, 2015 Steven A. Root, CCM, President/CEO
 Monthly Long Range Weather Commentary Issued: APRIL 1, 2015 Steven A. Root, CCM, President/CEO sroot@weatherbank.com FEBRUARY 2015 Climate Highlights The Month in Review The February contiguous U.S. temperature
2017 Fall Conditions Report
 2017 Fall Conditions Report Prepared by: Hydrologic Forecast Centre Date: November 15, 2017 Table of Contents TABLE OF FIGURES... ii EXECUTIVE SUMMARY... 1 BACKGROUND... 4 SUMMER AND FALL PRECIPITATION...
Monthly Long Range Weather Commentary Issued: APRIL 18, 2017 Steven A. Root, CCM, Chief Analytics Officer, Sr. VP,
 Monthly Long Range Weather Commentary Issued: APRIL 18, 2017 Steven A. Root, CCM, Chief Analytics Officer, Sr. VP, sroot@weatherbank.com MARCH 2017 Climate Highlights The Month in Review The average contiguous
March 1, 2003 Western Snowpack Conditions and Water Supply Forecasts
 Natural Resources Conservation Service National Water and Climate Center 101 SW Main Street, Suite 1600 Portland, OR 97204-3224 Date: March 17, 2003 Subject: March 1, 2003 Western Snowpack Conditions and
Monthly Long Range Weather Commentary Issued: July 18, 2014 Steven A. Root, CCM, President/CEO
 Monthly Long Range Weather Commentary Issued: July 18, 2014 Steven A. Root, CCM, President/CEO sroot@weatherbank.com JUNE 2014 REVIEW Climate Highlights The Month in Review The average temperature for
Missouri River Basin Water Management Monthly Update
 Missouri River Basin Water Management Monthly Update Participating Agencies 255 255 255 237 237 237 0 0 0 217 217 217 163 163 163 200 200 200 131 132 122 239 65 53 80 119 27 National Oceanic and Atmospheric
NIDIS Intermountain West Drought Early Warning System November 21, 2017
 NIDIS Drought and Water Assessment NIDIS Intermountain West Drought Early Warning System November 21, 2017 Precipitation The images above use daily precipitation statistics from NWS COOP, CoCoRaHS, and
Souris River Basin Spring Runoff Outlook As of March 1, 2019
 Souris River Basin Spring Runoff Outlook As of March 1, 2019 Prepared by: Flow Forecasting & Operations Planning Water Security Agency Basin Conditions Summer rainfall in 2018 over the Saskatchewan portion
NIDIS Intermountain West Drought Early Warning System December 11, 2018
 NIDIS Drought and Water Assessment NIDIS Intermountain West Drought Early Warning System December 11, 2018 Precipitation The images above use daily precipitation statistics from NWS COOP, CoCoRaHS, and
Becky Bolinger Water Availability Task Force November 13, 2018
 Colorado Climate Center WATF Climate Update Becky Bolinger Water Availability Task Force November 13, 2018 COLORADO CLIMATE CENTER Water Year 2018 Colorado s Climate in Review COLORADO CLIMATE CENTER
Current Water Conditions in Massachusetts January 11, 2008
 Current Water Conditions in Massachusetts January 11, 2008 December precipitation was above normal December streamflows were below normal and normal December ground-water levels were below normal and normal
2011 Year in Review TORNADOES
 2011 Year in Review The year 2011 had weather events that will be remembered for a long time. Two significant tornado outbreaks in April, widespread damage and power outages from Hurricane Irene in August
Weather and Climate Summary and Forecast January 2019 Report
 Weather and Climate Summary and Forecast January 2019 Report Gregory V. Jones Linfield College January 4, 2019 Summary: December was mild and dry over much of the west, while the east was much warmer than
NIDIS Weekly Climate, Water and Drought Assessment Summary. Upper Colorado River Basin
 NIDIS Weekly Climate, Water and Drought Assessment Summary Upper Colorado River Basin August 3, 2010 Precipitation and Snowpack Fig. 1: July precipitation in inches Fig. 2: July precip as percent of average
Weather and Climate Summary and Forecast Summer 2016
 Weather and Climate Summary and Forecast Summer 2016 Gregory V. Jones Southern Oregon University August 5, 2016 The month of July saw the continued flip, flop of the western US temperatures. It was warm
Investigation IV: Seasonal Precipitation and Seasonal Surface Runoff in the US
 Investigation IV: Seasonal Precipitation and Seasonal Surface Runoff in the US Purpose Students will consider the seasonality of precipitation and surface runoff and think about how the time of year can
Reservoir Control Center U. S Army Corps of Engineers Northwestern Division - Missouri River Basin Omaha, Nebraska
 US Army Corps of Engineers Fort Peck Garrison Oahe Big Bend Gavins Point Ft. Randall Reservoir Control Center U. S Army Corps of Engineers Northwestern Division - Missouri River Basin Omaha, Nebraska April
Weather and Climate Summary and Forecast Summer 2016
 Weather and Climate Summary and Forecast Summer 2016 Gregory V. Jones Southern Oregon University June 6, 2016 May 2016 continued the warm trend for portions of the west, while providing some relief for
Water Supply Conditions and Outlook October 1, 2018
 Water Supply Conditions and Outlook October 1, 2018 Flow Forecasting & Operations Planning Water Security Agency Overview Water supply conditions across Saskatchewan remain near normal, with most reservoirs
Great Lakes Update. Volume 199: 2017 Annual Summary. Background
 Great Lakes Update Volume 199: 2017 Annual Summary Background The U.S. Army Corps of Engineers (USACE) tracks and forecasts the water levels of each of the Great Lakes. This report is primarily focused
NIDIS Intermountain West Drought Early Warning System October 30, 2018
 10/30/2018 NIDIS Drought and Water Assessment NIDIS Intermountain West Drought Early Warning System October 30, 2018 Precipitation The images above use daily precipitation statistics from NWS COOP, CoCoRaHS,
UNITED STATES AND SOUTH AMERICA OUTLOOK (FULL REPORT) Wednesday, April 18, 2018
 Wednesday, April 18, 2018") T-storm Weather Summary Coolness continues over the next week in much of the central U.S., most likely producing the coldest April since 1907 in the Corn Belt, but followed by seasonable to mild weather
T-storm Weather Summary Coolness continues over the next week in much of the central U.S., most likely producing the coldest April since 1907 in the Corn Belt, but followed by seasonable to mild weather
Precipitation. Standardized Precipitation Index. NIDIS Intermountain West Regional Drought Early Warning System January 3, 2017
 1/3/2017 NIDIS Drought and Water Assessment NIDIS Intermountain West Regional Drought Early Warning System January 3, 2017 Precipitation The images above use daily precipitation statistics from NWS COOP,
NIDIS Intermountain West Drought Early Warning System October 17, 2017
 NIDIS Drought and Water Assessment NIDIS Intermountain West Drought Early Warning System October 17, 2017 Precipitation The images above use daily precipitation statistics from NWS COOP, CoCoRaHS, and
-Assessment of current water conditions. - Precipitation Forecast. - Recommendations for Drought Monitor
 2 May 1 st, 2012 -Assessment of current water conditions - Precipitation Forecast - Recommendations for Drought Monitor AHPS Water Year Precipitation as Percentage of Normal 7-day average
Wind River Indian Reservation and Surrounding Area Climate and Drought Summary
 Northern Arapaho Tribe Wind River Indian Reservation and Surrounding Area Climate and Drought Summary Spring Events & Summer Outlook 2016 Wet Spring Leads To Flooding Spring was very wet across most of
California 120 Day Precipitation Outlook Issued Tom Dunklee Global Climate Center
 California 120 Day Precipitation Outlook Issued 11-01-2008 Tom Dunklee Global Climate Center This is my second updated outlook for precipitation patterns and amounts for the next 4 s of the current rainy
2011 National Seasonal Assessment Workshop for the Eastern, Southern, & Southwest Geographic Areas
 2011 National Seasonal Assessment Workshop for the Eastern, Southern, & Southwest Geographic Areas On January 11-13, 2011, wildland fire, weather, and climate met virtually for the ninth annual National
NIDIS Intermountain West Drought Early Warning System January 16, 2018
 NIDIS Drought and Water Assessment NIDIS Intermountain West Drought Early Warning System January 16, 2018 Precipitation The images above use daily precipitation statistics from NWS COOP, CoCoRaHS, and
NIDIS Intermountain West Drought Early Warning System March 26, 2019
 NIDIS Intermountain West Drought Early Warning System March 26, 2019 The images above use daily precipitation statistics from NWS COOP, CoCoRaHS, and CoAgMet stations. From top to bottom, and left to right:
May 2016 Volume 23 Number 5
 The Weather Wire May 2016 Volume 23 Number 5 Contents: Winter Summary Current Colorado and West-wide Snow Pack Drought Monitor April Summary/Statistics May Preview Snowfall Totals Winter Summary The Front
Wind River Indian Reservation and Surrounding Area Climate and Drought Summary
 Northern Arapaho Tribe Wind River Indian Reservation and Surrounding Area Climate and Drought Summary Summer Events & Fall Outlook 2015 Summer Was Near, Precipitation Was Highly Variable Across The Region
Wind River Indian Reservation and Surrounding Area Climate and Drought Summary
 Northern Arapaho Tribe Wind River Indian Reservation and Surrounding Area Climate and Drought Summary Winter Events & Spring Outlook 2015-2016 Winter Was Warm And Dry Winter was warm and dry for the Wind
 October 16 th, 2012 2010-12 La Niña event reached its biggest peak since the mid-70s in late 2010, followed by a brief excursion to ENSOneutral conditions during mid-2011; it reached a second peak last
Weather and Climate Summary and Forecast October 2018 Report
 Weather and Climate Summary and Forecast October 2018 Report Gregory V. Jones Linfield College October 4, 2018 Summary: Much of Washington, Oregon, coastal California and the Bay Area and delta region
HyMet Company. Streamflow and Energy Generation Forecasting Model Columbia River Basin
 HyMet Company Streamflow and Energy Generation Forecasting Model Columbia River Basin HyMet Inc. Courthouse Square 19001 Vashon Hwy SW Suite 201 Vashon Island, WA 98070 Phone: 206-463-1610 Columbia River
Webinar and Weekly Summary February 15th, 2011
 Webinar and Weekly Summary February 15th, 2011 -Assessment of current water conditions - Precipitation Forecast - Recommendations for Drought Monitor Upper Colorado Normal Precipitation Upper Colorado
PRECIPITATION. Last Week Precipitation:
 12/30/2014 NIDIS Drought and Water Assessment PRECIPITATION The images above use daily precipitation statistics from NWS COOP, CoCoRaHS, and CoAgMet stations. From top to bottom, and left to right: most
Climate. Annual Temperature (Last 30 Years) January Temperature. July Temperature. Average Precipitation (Last 30 Years)
 January Temperature. July Temperature. Average Precipitation (Last 30 Years)") Climate Annual Temperature (Last 30 Years) Average Annual High Temp. (F)70, (C)21 Average Annual Low Temp. (F)43, (C)6 January Temperature Average January High Temp. (F)48, (C)9 Average January Low Temp.
Climate Annual Temperature (Last 30 Years) Average Annual High Temp. (F)70, (C)21 Average Annual Low Temp. (F)43, (C)6 January Temperature Average January High Temp. (F)48, (C)9 Average January Low Temp.
DK DM M EMORANDUM D ECEMBER 28, 2018 SUBJECT:
 TO: CC: FROM: SUBJECT: BOARD OF DIRECTORS M EMORANDUM D ECEMBER 28, 2018 ANDY MUELLER, GENERAL MANAGER DAVE DK KANZER, P.E. & DON MEYER, P.E. DK DM COLORADO RIVER BASIN WATER SUPPLY CONDITIONS UPDATE AND
Water Supply Conditions and Outlook June 4, 2018
 Water Supply Conditions and Outlook June 4, 2018 Flow Forecasting & Operations Planning Water Security Agency Overview Water supply conditions across Saskatchewan are generally good with most reservoir
NIDIS Intermountain West Drought Early Warning System December 18, 2018
 NIDIS Intermountain West Drought Early Warning System December 18, 2018 Precipitation The images above use daily precipitation statistics from NWS COOP, CoCoRaHS, and CoAgMet stations. From top to bottom,
Great Lakes Update. Volume 193: 2015 January through June Summary. Vol. 193 Great Lakes Update August 2015
 Great Lakes Update Volume 193: 2015 January through June Summary The U.S. Army Corps of Engineers (USACE) monitors the water levels of each of the Great Lakes. This report provides a summary of the Great
NIDIS Weekly Climate, Water and Drought Assessment Summary Upper Colorado River Basin Pilot Project 13 July 2010
 NIDIS Weekly Climate, Water and Drought Assessment Summary Upper Colorado River Basin Pilot Project 13 July 2010 Precipitation and Snowpack Over the past week, precipitation in the Upper Colorado River