Introduction to GIS Sarah Watson University of Kentucky Libraries March 6, 2017
|
|
|
- Moris Bryant
- 6 years ago
- Views:
Transcription


1 Introduction to GIS Sarah Watson University of Kentucky Libraries March 6, 2017
2 Outline Overview of various terms Quick overview of ArcGIS and QGIS Geocoding Activity Considering Map Design ArcGIS Online


3 What is a Map? Simple Definition: A spatial representation of reality Why are maps useful? Maps can simplify & make reality easier to understand Less is Sometimes More Maps can help us see new realities Maps can show us what we cannot easily see with our eyes

4 In 1996, J.H. Andrews compiled 321 definitions of map ( What Was a Map? Cartographica 33:4, pp. 1-11). After editing out all the source information/miscellaneous stuff, you have a bunch of words that can be pumped into a word cloud generator The word cloud visualization does help to make some sense out of the 8106 words in the 321 definitions.
5 What is a Map? The map has a narrative Elements and information are framed for the viewer Consider how they depict cause and effect Maps actively construct new knowledges and serve as interventions into our understandings of the world Requires mapmakers and map readers to consider: What counts as data? The role of images/symbols and design in effectively depicting
6 What is GIS? Geographic Information System (GIS) is A set of tools that captures, stores, analyzes, manages, and presents data that are linked to a location Spatial or Data Analysis: Study of the spatial visualization of patterns, properties, and relationships. Examples of variables that are often analyzed include population demographics, quality of life indexes, illness distributions, and business sales (Camera et al. 2001)

7 What Features Appear on Maps?
8 Map Features Title Is there a label describing what the map shows? Scale Is there a scale to read distances? Explanatory Text Text blocks to communicate information (map content, goals, etc.) Legend Is there a legend (key) to aid readers? Necessary in helping readers unlock the map symbols Orientation Which way is North? Border Helps to draw/unite all the information Date Is there a date? Sources, Credits, Etc. date, author, map series, organization Inserts and Locator Maps

9 Explanatory text Title Locator Map Source

10 Title Legend Inset Explanatory Text Directional Indicator Scale bar

11 Map Features If you have to know the rules, before you can break them! Santa Fe


12 The convention of orienting maps with North at the top is so widespread, that maps often lack a directional indicator (aka North Arrow ) unless it is oriented differently.
 run east-west, parallel to the Equator and measure distance north and south, from 0 degrees at the Equator to 90 degrees at the North and South Poles.")
13 Map Features: Latitude & longitude Latitude and longitude are imaginary lines encircling the globe, intersecting each other to form a grid that helps us pinpoint location our "global address. Latitude lines (also called "parallels") run east-west, parallel to the Equator and measure distance north and south, from 0 degrees at the Equator to 90 degrees at the North and South Poles. Longitude lines (also called "meridians") run northsouth and meet at the poles, measuring distance east and west of the Prime Meridian, from 0 degrees at the Prime
14 Map Features: Scale The scale of a map shows how much you would have to enlarge your map to get the actual size of the piece of land you are looking at. Typically, represented in one of three ways on a map: Verbal - scale is expressed in words: 1 inch = 1000 mi Visual bar line that graphically depicts the relationship between map distance and ground distance Representative Fraction: Ratio 1:1,200,000 First number of the scale is always one. It's your unit of measurement, usually an inch. The second number is the ground distance. For example, if your U.S. Geological Survey (USGS) map has a scale of 1:24,000, it means that one inch on the map is equal to 24,000 inches (2000 feet or meters) in the real world

15 Map Features: Scale The terms 'large scale' and 'small scale' are used to describe different scales. However, they can be confusing : Large scale maps have low number in the scale, such as 1: The features are shown are large or are zoomed in Small scale maps have a high number in the scale, such as 1: Individual features shown are small or are zoomed out
16 Map Features: Projections A map projection is: The systematic transformation of the latitudes and longitudes of locations on the surface of a sphere or an ellipsoid into locations on a plane. Map projections are necessary for creating maps. All map projections distort the surface in some fashion.
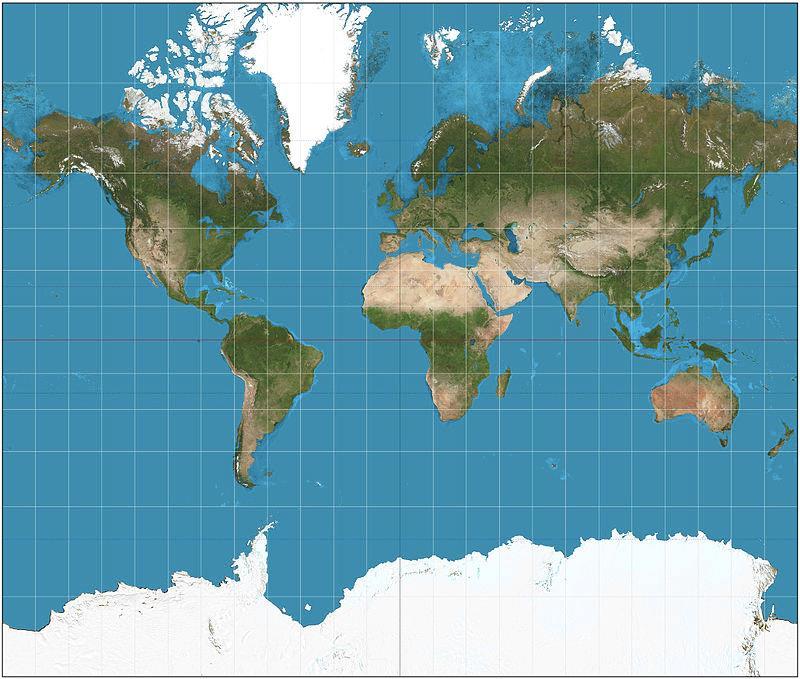
17 Mercator Projection

18 Gall Peters Projection

19 Winkel Tripel Projection Standard projection for world maps made by the National Geographic Society

20 Types of GIS File Formats Vector - geographical features are often expressed as vectors Points Lines Polygons Popular File Formats Shapefile Very Common, developed by Esri Tiger Topologically Integrated Geographic Encoding and Referencing KML Keyhole Markup Language XML based open standard

21 Types of GIS File Formats Raster Pixels. Can be digital aerial photographs, digital pictures, scanned maps Popular GIS file formats GeoTiff Tiff variant enriched with GIS relevant metadata JPEG2000 Digital raster graphic (DRG)
22 Map Data Discrete: Data only found at fixed locations or when the data represent only specific values. Buildings and roads are features that have distinct boundaries Can be shown as a point, line, or a polygon. Points could be cities Lines could be roads Polygons could be provinces in a country
23 Map Data Continuous data does not have well-defined boundaries and sometimes has no boundaries. It is typically seen throughout the mapped area and smoothly transitions from one value to another. Temperature measurements Atmospheric pressure Elevation

24 Thinking about Making Maps
25 Don t reinvent the wheel
26 Esri (ArcGIS Products) & QGIS ArcGIS Online cloud based mapping platform. ArcMap Desktop application (does not work with Macs) Consult UKY GIS Campus Support for access information QGIS Free and Open Source GIS Platform Works with Windows, Mac, and Linux
27 ArcMap Interface Main Menu Table of Contexts The Data Frame View Toolbar
28 Geocoding The conversion of addresses into geographic coordinates GeoSearch When converting one address Batch Geocoding When converting many BatchGEO ( a free online tool that geocodes addresses, maps them and creates a KML file Reverse Geocoding Take coordinates and change into address Your Address Standardization Coordinates Points on a Map
29 Map Communication/Design Map Communication oftentimes deals with the fusion of: Intellectual Hierarchy what are the different elements around the map, and what are their relative importance to the overall communication Visual hierarchy choose your visual hierarchy that reflects the intellectual hierarchy Map Communication is shaped by how the map features, visual arrangements, and symbolization interact with one another Good design enhances map communication Poor design inhibits communication Important to remember that communication is linked to the audience: Know who you are talking to Experts or Novices How will maps be displayed: Printed or Web Size Color or B/W


 Elements of Foreground and Background")
30 Visual Hierarchy (figure-ground) Figure-ground effect: Figures on maps are seen as separate from the rest of the map Can be used to emphasize what is important in the map The main focus of the composition (positive space) Ground: The secondary portion of the composition (negative space) Elements of Foreground and Background Figure Ground


31 Visual Arrangement Key Elements Visual Center slightly above the actual center Balance some map pieces are heavier than others so you want to move pieces around to keep the visual balanced Symmetry balance around a central vertical axis
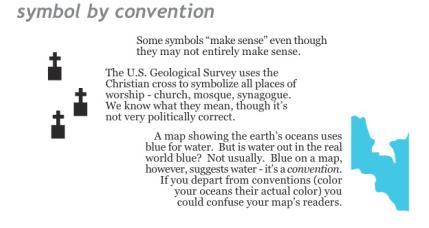
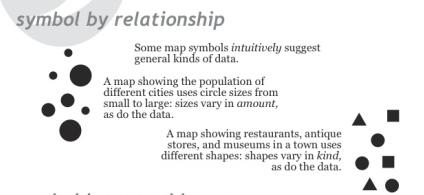
32 Map Symbolization Everything on a map is a symbol Symbol - A thing representing something else because of relationship, association, convention, or resemblance Map symbols are tied to data and concepts Choose symbols that best match your data Oftentimes: Symbolize by shape/unique symbol or color hue for qualitative data Symbolize by size or color value for quantitative data
33


34 Enhancing Visual Difference Overview Visual Difference Detail Edges Texture Layering Shape & Size Closure Proximity Simplicity Direction Familiarity Color Weaker Stronger Weaker Stronger


35 Visual Hierarchy Design choices effect visual order Separate and layer information in rough proportion to their relevance Important information sits on top of the visual hierarchy Push supporting elements to the back Discard what is not relevant Style and layering set visual order

36 Visual Hierarchy (visual difference) Visual contrast emphasizes figure-ground relationship Darker or brighter features stand out Features with less contrast appear to belong together Poor Figure Ground OK Figure Ground Good Figure Ground

37 Visual Hierarchy (Separation) Defined edges between features Deemphasized backgrounds

38 Visual Hierarchy (layering) Proper layering enhances visual order Continue Ground behind Figure
39 Color on Maps Does your map need to be in color? Gray scale maps can be very effective Avoid cultural associations Best for b&w reproductions Color Use color sparingly Spot colors on muted field emphasize data Color on muted background draws the eye to your data Connect color choice to your data Common Colors Blue - lakes, rivers, streams, oceans, reservoirs, highways, local borders Red - major highways, roads, urban areas, airports, special interest sites, military sites, place names, buildings, borders Yellow - built-up or urban areas Green - parks, golf courses, reservations, forest, orchards, highways

40

41 Representing Data Different visual variables are more effective for showing qualitative or quantitative differences
42 Some Questions to ask Yourself: Map Title is it brief and directly related to the map? Map scale is it correct? Do legend symbols match the map? Does your map include source(s) and author information? Does it reproduce ok in b&w? Will the map fit the page or screen?
43 Additional Resources Great Site to Search for Answers: Google!!! Or me! Feel free to talk with me about any project.
Geographers Perspectives on the World
 What is Geography? Geography is not just about city and country names Geography is not just about population and growth Geography is not just about rivers and mountains Geography is a broad field that
Lesson Plan 2 - Middle and High School Land Use and Land Cover Introduction. Understanding Land Use and Land Cover using Google Earth
 Understanding Land Use and Land Cover using Google Earth Image an image is a representation of reality. It can be a sketch, a painting, a photograph, or some other graphic representation such as satellite
Popular Mechanics, 1954
 Introduction to GIS Popular Mechanics, 1954 1986 $2,599 1 MB of RAM 2017, $750, 128 GB memory, 2 GB of RAM Computing power has increased exponentially over the past 30 years, Allowing the existence of
GEOREFERENCING, PROJECTIONS Part I. PRESENTING DATA Part II
 Week 7 GEOREFERENCING, PROJECTIONS Part I PRESENTING DATA Part II topics of the week Georeferencing Coordinate systems Map Projections ArcMap and Projections Geo-referencing Geo-referencing is the process
Introduction to Geographic Information Systems
 Introduction to Geographic Information Systems Lynn_Carlson@brown.edu 401-863-9917 The Environmental And Remote TecHnologies Lab MacMillan Hall, Room 105 http://www.brown.edu/research/earthlab/ Outline
GIS Lecture 5: Spatial Data
 GIS Lecture 5: Spatial Data GIS 1 Outline Vector Data Formats Raster Data Formats Map Projections Coordinate Systems US Census geographic files US Census data files GIS Data Sources GIS 2 Vector Data Formats
Chapter 3 Models of the Earth. 3.1 Finding Locations on the Earth. 3.1 Objectives
 Chapter 3 Models of the Earth 3.1 Finding Locations on the Earth 3.1 Objectives Explain latitude and longitude. How can latitude and longitude be used to find locations on Earth? How can a magnetic compass
Lesson Plan - Middle and High School Land Use and Land Cover Introduction. Understanding Land Use and Land Cover using ArcGIS Online
 Lesson Plan - Middle and High School Land Use and Land Cover Understanding Land Use and Land Cover using ArcGIS Online Image an image is a representation of reality. It can be a sketch, a painting, a photograph,
DATA 301 Introduction to Data Analytics Geographic Information Systems
 DATA 301 Introduction to Data Analytics Geographic Information Systems Dr. Ramon Lawrence University of British Columbia Okanagan ramon.lawrence@ubc.ca DATA 301: Data Analytics (2) Why learn Geographic
Lecture 6 - Raster Data Model & GIS File Organization
 Lecture 6 - Raster Data Model & GIS File Organization I. Overview of Raster Data Model Raster data models define objects in a fixed manner see Figure 1. Each grid cell has fixed size (resolution). The
Import Digital Spatial Data (Shapefiles) into OneStop
 into OneStop") Import Digital Spatial Data (Shapefiles) into OneStop» Intended User: Pipeline Licence Applicants Overview To apply for a pipeline or pipeline installation licence, applicants must upload the proposed
Import Digital Spatial Data (Shapefiles) into OneStop» Intended User: Pipeline Licence Applicants Overview To apply for a pipeline or pipeline installation licence, applicants must upload the proposed
Lecture 9: Reference Maps & Aerial Photography
 Lecture 9: Reference Maps & Aerial Photography I. Overview of Reference and Topographic Maps There are two basic types of maps? Reference Maps - General purpose maps & Thematic Maps - maps made for a specific
Mapping Earth. How are Earth s surface features measured and modeled?
 Name Mapping Earth How are Earth s surface features measured and modeled? Before You Read Before you read the chapter, think about what you know about maps Record your thoughts in the first column Pair
What is a map? A Map is a two or three-dimensional model or representation of the Earth s surface. 2-Dimensional map
 What is a map? A Map is a two or three-dimensional model or representation of the Earth s surface. 2-Dimensional map What is a Map Projection? Planar Projection Projection A Projection is a mathematical
EnvSci 360 Computer and Analytical Cartography
 EnvSci 360 Computer and Analytical Cartography Lecture 7 Mapping Images, Surfaces, and 3-D Data Brief Overview of Imagery What is Imagery? A spatial data model that defines space as an array of equally
Week 8 Cookbook: Review and Reflection
 : Review and Reflection Week 8 Overview 8.1) Review and Reflection 8.2) Making Intelligent Maps: The map sheet as a blank canvas 8.3) Making Intelligent Maps: Base layers and analysis layers 8.4) ArcGIS
Map image from the Atlas of Oregon (2nd. Ed.), Copyright 2001 University of Oregon Press
, Copyright 2001 University of Oregon Press") Map Layout and Cartographic Design with ArcGIS Desktop Matthew Baker ESRI Educational Services Redlands, CA Education UC 2008 1 Seminar overview General map design principles Working with map elements
Map Layout and Cartographic Design with ArcGIS Desktop Matthew Baker ESRI Educational Services Redlands, CA Education UC 2008 1 Seminar overview General map design principles Working with map elements
Topographic Map Series:
 DEFINITION OF A MAP A MAP IS A GEOGRAPHIC PREPRESENTATION OF A PORTION OF THE EARTH S SURFACE DRAWN TO SCALE, AS SEEN FROM ABOVE. IT S USES COLORS, SYMBOLS AND LABELS TO REPRESENT FEATURES FOUND ON THE
NR402 GIS Applications in Natural Resources
 NR402 GIS Applications in Natural Resources Lesson 1 Introduction to GIS Eva Strand, University of Idaho Map of the Pacific Northwest from http://www.or.blm.gov/gis/ Welcome to NR402 GIS Applications in
Illustrator: Vector base Each line/point store some sort of information Mapping Representation of the world
 Illustrator: Vector base Each line/point store some sort of information Mapping Representation of the world Photoshop Raster base Images can be overlaid Pixel vector data model: [data models] A representation
CHAPTER 9 DATA DISPLAY AND CARTOGRAPHY
 CHAPTER 9 DATA DISPLAY AND CARTOGRAPHY 9.1 Cartographic Representation 9.1.1 Spatial Features and Map Symbols 9.1.2 Use of Color 9.1.3 Data Classification 9.1.4 Generalization Box 9.1 Representations 9.2
Geographical Information Systems
 Geographical Information Systems Geographical Information Systems (GIS) is a relatively new technology that is now prominent in the ecological sciences. This tool allows users to map geographic features
Uncollaring a Kentucky Scanned GQ
 Overview Uncollaring a Kentucky Scanned GQ This How to outlines a simple procedure for removing the legend, key, cross sections, scale bar, etc. from a scanned USGS 7.5 Geological Quadrangle map (GQ) (fig.
Basic Map Skills for the Outdoors
 Geography 80-20 80% of what there is to know, for 20% of the sweat Basic Map Skills for the Outdoors Map Scale Map source: US Geological Survey Four ways to indicate map scale: Representative fraction
AP Human Geography Chapter 1: Thinking Geographically Key Issue 1: How do Geographers describe where things are?
 AP Human Geography Chapter 1: Thinking Geographically Key Issue 1: How do Geographers describe where things are? Studying Human Geography Physical Geography Physical geography deals with Earth s natural
Unit 1, Lesson 2. What is geographic inquiry?
 What is geographic inquiry? Unit 1, Lesson 2 Understanding the way in which social scientists investigate problems will help you conduct your own investigations about problems or issues facing your community
Geographic Information Systems. Introduction to Data and Data Sources
 Geographic Information Systems Introduction to Data and Data Sources Presented by John Showler, NJDA-SSCC NJ SCD GIS Training Session December 10, 209 The Objectives of this session are 3-fold: 1. Introduce
Export Basemap Imagery from GIS to CAD
 Export Basemap Imagery from GIS to CAD This tutorial illustrates how to add high resolution imagery as a basemap into an existing CAD drawing using ArcGIS and AutoCAD. Through this method, the imagery
 estrandh@uoregon.edu Introduction The general topic of this paper describes a unique cartographic project depicting a mountain landscape for the Friends of Opal Creek (F.O.C.), a non-profit organization.
Chapter 5. Presenting Data
 Chapter 5. Presenting Data Copyright McGraw-Hill Education. Permission required for reproduction or display. 5-1 Basic principles of map design 5-2 1 Map Design Process 5-3 The map objective The first
Key Issue #1. How do geographers describe where things are? 2014 Pearson Education, Inc.
 Key Issue #1 How do geographers describe where things are? Learning Outcomes 1.1.1: Explain differences between early maps and contemporary maps. 1.1.2: Describe the role of map scale and projections and
Using Maps. Using Maps. Using Maps. Using Maps
 A is a visual representation, or model, of part or all of the earth. lines are imaginary lines that run east to west around the globe; they are also known as parallels. They show distances in degrees north
Welcome to NR502 GIS Applications in Natural Resources. You can take this course for 1 or 2 credits. There is also an option for 3 credits.
 Welcome to NR502 GIS Applications in Natural Resources. You can take this course for 1 or 2 credits. There is also an option for 3 credits. The 1st credit consists of a series of readings, demonstration,
These modules are covered with a brief information and practical in ArcGIS Software and open source software also like QGIS, ILWIS.
 Online GIS Training and training modules covered are: 1. ArcGIS, Analysis, Fundamentals and Implementation 2. ArcGIS Web Data Sharing 3. ArcGIS for Desktop 4. ArcGIS for Server These modules are covered
Introducing IMS. v) Select the Zoom to Full Extent tool. Did you return to the original view?
 Select the Zoom to Full Extent tool. Did you return to the original view?") Ocean/ENVIR 260, Winter 2006 Lab 1, Get to Know the Puget Sound Watershed Name Introducing IMS 1) Open your web browser and navigate to http://128.208.23.127/website/lab1. (This link can be found on the
Ocean/ENVIR 260, Winter 2006 Lab 1, Get to Know the Puget Sound Watershed Name Introducing IMS 1) Open your web browser and navigate to http://128.208.23.127/website/lab1. (This link can be found on the
Outline Anatomy of ArcGIS Metadata Data Types Vector Raster Conversion Adding Data Navigation Symbolization Methods Layer Files Editing Help Files
 UPlan Training Lab Exercise: Introduction to ArcGIS Outline Anatomy of ArcGIS Metadata Data Types Vector Raster Conversion Adding Data Navigation Symbolization Methods Layer Files Editing Help Files Anatomy
Using the Stock Hydrology Tools in ArcGIS
 Using the Stock Hydrology Tools in ArcGIS This lab exercise contains a homework assignment, detailed at the bottom, which is due Wednesday, October 6th. Several hydrology tools are part of the basic ArcGIS
STUDY GUIDE. Exploring Geography. Chapter 1, Section 1. Terms to Know DRAWING FROM EXPERIENCE ORGANIZING YOUR THOUGHTS
 For use with textbook pages 19 22. Exploring Geography Terms to Know location A specific place on the earth (page 20) absolute location The exact spot at which a place is found on the globe (page 20) hemisphere
The Geodatabase Working with Spatial Analyst. Calculating Elevation and Slope Values for Forested Roads, Streams, and Stands.
 GIS LAB 7 The Geodatabase Working with Spatial Analyst. Calculating Elevation and Slope Values for Forested Roads, Streams, and Stands. This lab will ask you to work with the Spatial Analyst extension.
Lecture 2. Introduction to ESRI s ArcGIS Desktop and ArcMap
 Lecture 2 Introduction to ESRI s ArcGIS Desktop and ArcMap Outline ESRI What is ArcGIS? ArcGIS Desktop ArcMap Overview Views Layers Attribute Tables Help! Scale Tips and Tricks ESRI Environmental Systems
Topographic Maps and Landforms Geology Lab
 Topographic Maps and Landforms Geology Lab Ray Rector: Instructor Today s Lab Activities 1) Discussion of Last Week s Lab 2) Lecture on Topo Maps and Elevation Contours 3) Construct Topographic Maps and
What Is a Globe? Hemispheres. Main Idea Globes and maps provide different ways of showing features of the earth. Terms to Know
 r Main Idea Globes and maps provide different ways of showing features of the earth. Terms to Know hemisphere latitude longitude scale bar scale relief elevation contour line What Is a Globe? A globe is
Outline. Chapter 1. A history of products. What is ArcGIS? What is GIS? Some GIS applications Introducing the ArcGIS products How does GIS work?
 Outline Chapter 1 Introducing ArcGIS What is GIS? Some GIS applications Introducing the ArcGIS products How does GIS work? Basic data formats The ArcCatalog interface 1-1 1-2 A history of products Arc/Info
REFERENCING COORDINATE SYSTEMS MAP PROJECTIONS GEOREFERENCING
 GIS in Ecology SPATIAL REFERENCING COORDINATE SYSTEMS MAP PROJECTIONS GEOREFERENCING : :1 Where on earth? Early mapmakers recognized the need for a system that could locate features on the earth's surface.
Unit 1, Lesson 3 What Tools and Technologies Do Geographers Use?
 Unit 1, Lesson 3 What Tools and Technologies Do Geographers Use? Geographers use a variety of tools and technologies in investigating geographic questions. Maps and globes both represent the earth, but
Lauren Jacob May 6, Tectonics of the Northern Menderes Massif: The Simav Detachment and its relationship to three granite plutons
 Lauren Jacob May 6, 2010 Tectonics of the Northern Menderes Massif: The Simav Detachment and its relationship to three granite plutons I. Introduction: Purpose: While reading through the literature regarding
GEOGRAPHIC INFORMATION SYSTEMS (GIS)
") AN INTRODUCTION TO GEOGRAPHIC INFORMATION SYSTEMS (GIS) Joana Magos Brehm 1, Ali Shehadeh 2 1 Botanical Garden, National Museum of Natural History, University of Lisbon (Portugal) 2 Genetic Resources Unit,
AN INTRODUCTION TO GEOGRAPHIC INFORMATION SYSTEMS (GIS) Joana Magos Brehm 1, Ali Shehadeh 2 1 Botanical Garden, National Museum of Natural History, University of Lisbon (Portugal) 2 Genetic Resources Unit,
Map Skills and Geographic Tools
 Name: Period: Map Skills and Geographic Tools TEKS: 8.9C interpret topographic maps and satellite views to identify land and erosional features and predict how these features may be reshaped by weathering
Projections and Coordinate Systems
 Projections and Coordinate Systems Overview Projections Examples of different projections Coordinate systems Datums Projections Overview Projections and Coordinate Systems GIS must accurately represent
Performing Map Cartography. using Esri Production Mapping
 AGENDA Performing Map Cartography Presentation Title using Esri Production Mapping Name of Speaker Company Name Kannan Jayaraman Agenda Introduction What s New in ArcGIS 10.1 ESRI Production Mapping Mapping
Introducing GIS analysis
 1 Introducing GIS analysis GIS analysis lets you see patterns and relationships in your geographic data. The results of your analysis will give you insight into a place, help you focus your actions, or
Determining the Location of the Simav Fault
 Lindsey German May 3, 2012 Determining the Location of the Simav Fault 1. Introduction and Problem Formulation: The issue I will be focusing on involves interpreting the location of the Simav fault in
Geography Can Be Cool. Seriously
 Geography Can Be Cool Seriously Why does geography matter? Geography: the study of looking at every aspect of the Earth s systems, such as human economies, societies, cultures, plants, animals, & climate.
Mapping Earth s Surface Chapter 2 Section 3
 Mapping Earth s Surface Chapter 2 Section 3 Day 1 Objective I will understand maps can be used to find locations on Earth and to represent information about features on Earth s Surface I will understand
Gis Unit TropMed Mahidol U.
 Gis Unit TropMed Mahidol U. Database Information System Database Concepts 1. Non-Spatial Database table, document.. 2. Spatial Database locational databases (geographic) + attribute databases Gis Unit
Delineation of Watersheds
 Delineation of Watersheds Adirondack Park, New York by Introduction Problem Watershed boundaries are increasingly being used in land and water management, separating the direction of water flow such that
2. GETTING STARTED WITH GIS
 2. GETTING STARTED WITH GIS What are geographic information systems and what are they used for? ArcGIS: ArcMap, ArcCatalog and ArcToolbox Vector data vs. raster data vs. attribute tables Polygons, polylines,
10/13/2011. Introduction. Introduction to GPS and GIS Workshop. Schedule. What We Will Cover
 Introduction Introduction to GPS and GIS Workshop Institute for Social and Environmental Research Nepal October 13 October 15, 2011 Alex Zvoleff azvoleff@mail.sdsu.edu http://rohan.sdsu.edu/~zvoleff Instructor:
Data Structures & Database Queries in GIS
 Data Structures & Database Queries in GIS Objective In this lab we will show you how to use ArcGIS for analysis of digital elevation models (DEM s), in relationship to Rocky Mountain bighorn sheep (Ovis
Lesson 5: Map Scale and Projections
 Organizing Data and Information Lesson 5: Map Scale and Projections Map Scales Projections Information can be organized as lists, numbers, tables, text, pictures, maps, or indexes. Clusters of information
In this exercise we will learn how to use the analysis tools in ArcGIS with vector and raster data to further examine potential building sites.
 GIS Level 2 In the Introduction to GIS workshop we filtered data and visually examined it to determine where to potentially build a new mixed use facility. In order to get a low interest loan, the building
Introduction INTRODUCTION TO GIS GIS - GIS GIS 1/12/2015. New York Association of Professional Land Surveyors January 22, 2015
 New York Association of Professional Land Surveyors January 22, 2015 INTRODUCTION TO GIS Introduction GIS - GIS GIS 1 2 What is a GIS Geographic of or relating to geography the study of the physical features
Using Map and Compass Together
 Using Map and Compass Together In situations where you foresee a potential evacuation on foot, where there are no roads, and no indication as to the direction of travel (i.e., road signs), it is recommended
ENV101 EARTH SYSTEMS
 ENV101 EARTH SYSTEMS Practical Exercise 2 Introduction to ArcMap and Map Projections 1. OVERVIEW This practical is designed to familiarise students with the use of ArcMap for visualising spatial data and
Learning ArcGIS: Introduction to ArcCatalog 10.1
 Learning ArcGIS: Introduction to ArcCatalog 10.1 Estimated Time: 1 Hour Information systems help us to manage what we know by making it easier to organize, access, manipulate, and apply knowledge to the
Overview key concepts and terms (based on the textbook Chang 2006 and the practical manual)
") Introduction Geo-information Science (GRS-10306) Overview key concepts and terms (based on the textbook 2006 and the practical manual) Introduction Chapter 1 Geographic information system (GIS) Geographically
Introduction Geo-information Science (GRS-10306) Overview key concepts and terms (based on the textbook 2006 and the practical manual) Introduction Chapter 1 Geographic information system (GIS) Geographically
ORIENTEERING. The challenge is to use the map to decide the best route to complete the course in the quickest time. Orienteering Map. Compass.
 ORIENTEERING Orienteering is similar to a cross-country race but you navigate using a map instead of following a set course. It is an outdoor sport where competitors navigate their own way, you can run,
Dr. ABOLGHASEM AKBARI Faculty of Civil Engineering & Earth Resources, University Malaysia Pahang (UMP)
") Workshop on : Dr. ABOLGHASEM AKBARI Faculty of Civil Engineering & Earth Resources, University Malaysia Pahang (UMP) 14-15 April 2016 Venue: Tehran, Iran GIS definitions GIS: A simplified view of the real
Workshop on : Dr. ABOLGHASEM AKBARI Faculty of Civil Engineering & Earth Resources, University Malaysia Pahang (UMP) 14-15 April 2016 Venue: Tehran, Iran GIS definitions GIS: A simplified view of the real
Acknowledgments xiii Preface xv. GIS Tutorial 1 Introducing GIS and health applications 1. What is GIS? 2
 Acknowledgments xiii Preface xv GIS Tutorial 1 Introducing GIS and health applications 1 What is GIS? 2 Spatial data 2 Digital map infrastructure 4 Unique capabilities of GIS 5 Installing ArcView and the
MAR-E1004 Basics of GIS: Georeferencing Jaakko Madetoja Slides adopted from Paula Ahonen-Rainio
 MAR-E1004 Basics of GIS: Georeferencing Jaakko Madetoja Slides adopted from Paula Ahonen-Rainio Learning goals In this session you will learn To describe the basics of different types of referencing systems
Theory, Concepts and Terminology
 GIS Workshop: Theory, Concepts and Terminology 1 Theory, Concepts and Terminology Suggestion: Have Maptitude with a map open on computer so that we can refer to it for specific menu and interface items.
Projections & GIS Data Collection: An Overview
 Projections & GIS Data Collection: An Overview Projections Primary data capture Secondary data capture Data transfer Capturing attribute data Managing a data capture project Geodesy Basics for Geospatial
Chapter 2: Studying Geography, Economics, and Citizenship
 Chapter 2: Studying Geography, Economics, and Citizenship Lesson 2.1 Studying Geography I. Displaying the Earth s Surface A. A globe of the Earth best shows the sizes of continents and the shapes of landmasses
PROJECTIONS AND COORDINATES EXPLORED THROUGH GOOGLE EARTH EXERCISE (SOLUTION SHEET)
") PROJECTIONS AND COORDINATES EXPLORED THROUGH GOOGLE EARTH EXERCISE (SOLUTION SHEET) Name: Date: Period: Note: Correct answers on some problems are indicated with a yellow highlight. PROJECTIONS 1. Here
PROJECTIONS AND COORDINATES EXPLORED THROUGH GOOGLE EARTH EXERCISE (SOLUTION SHEET) Name: Date: Period: Note: Correct answers on some problems are indicated with a yellow highlight. PROJECTIONS 1. Here
The World of Geography Pre-Test/Study Guide Chapter 1 Test
 Read each statement or question. On the lines below write the letter of the best answer. 1. Geographers look at the Earth 5. What are the two specific A. by studying cities first. measurements of Earth
Global Atmospheric Circulation Patterns Analyzing TRMM data Background Objectives: Overview of Tasks must read Turn in Step 1.
 Global Atmospheric Circulation Patterns Analyzing TRMM data Eugenio Arima arima@hws.edu Hobart and William Smith Colleges Department of Environmental Studies Background: Have you ever wondered why rainforests
GIS Workshop Data Collection Techniques
 GIS Workshop Data Collection Techniques NOFNEC Conference 2016 Presented by: Matawa First Nations Management Jennifer Duncan and Charlene Wagenaar, Geomatics Technicians, Four Rivers Department QA #: FRG
Module 7, Lesson 1 Water world
 Module 7, Lesson 1 Water world Imagine that the year is 2100. Scientists have determined that the rapidly warming climate of the earth will cause the ice sheets of Antarctica to break apart and melt at
(THIS IS AN OPTIONAL BUT WORTHWHILE EXERCISE)
") PART 2: Analysis in ArcGIS (THIS IS AN OPTIONAL BUT WORTHWHILE EXERCISE) Step 1: Start ArcCatalog and open a geodatabase If you have a shortcut icon for ArcCatalog on your desktop, double-click it to start
PART 2: Analysis in ArcGIS (THIS IS AN OPTIONAL BUT WORTHWHILE EXERCISE) Step 1: Start ArcCatalog and open a geodatabase If you have a shortcut icon for ArcCatalog on your desktop, double-click it to start
GED 554 IT & GIS. Lecture 6 Exercise 5. May 10, 2013
 GED 554 IT & GIS Lecture 6 Exercise 5 May 10, 2013 Free GIS data sources ******************* Mapping numerical data & Symbolization ******************* Exercise: Making maps for presentation GIS DATA SOFTWARE
Chapter 02 Maps. Multiple Choice Questions
 Chapter 02 Maps Multiple Choice Questions 1. Every projection has some degree of distortion because A. a curved surface cannot be represented on a flat surface without distortion. B. parallels and meridians
Among various open-source GIS programs, QGIS can be the best suitable option which can be used across partners for reasons outlined below.
 Comparison of Geographic Information Systems (GIS) software As of January 2018, WHO has reached an agreement with ESRI (an international supplier of GIS software) for an unlimited use of ArcGIS Desktop
The Elements of GIS. Organizing Data and Information. The GIS Database. MAP and ATRIBUTE INFORMATION
 GIS s Roots in Cartography Getting Started With GIS Chapter 2 Dursun Z. Seker MAP and ATRIBUTE INFORMATION Data (numbers and text) store as files refer to them collectively as a database gather inform.
Geography 281 Map Making with GIS Project Eight: Comparing Map Projections
 Geography 281 Map Making with GIS Project Eight: Comparing Map Projections In this activity, you will do a series of projection comparisons using maps at different scales and geographic extents. In this
GIS FOR PLANNING. Course Overview. Schedule. Instructor. Prerequisites. Urban Planning 792 Thursday s 5:30-8:10pm SARUP 158
 GIS FOR PLANNING Urban Planning 792 Thursday s 5:30-8:10pm SARUP 158 Schedule Class/Lab - SARUP 158 Thursdays 5:30pm - 8:10pm Office Hours - By Appointment Project Ideas - Week 4 Final - 5/10/2018 Instructor
Environmental Systems Research Institute
 Introduction to ArcGIS ESRI Environmental Systems Research Institute Redlands, California 2 ESRI GIS Development Arc/Info (coverage model) Versions 1-7 from 1980 1999 Arc Macro Language (AML) ArcView (shapefile
Map Skills Unit. Note taking unit
 Map Skills Unit Note taking unit Introduction To learn about the Earth, we are going to learn about two geographic tools you can use.globes and maps. Globe A globe is a round model of the planet Earth
UNIT 4: USING ArcGIS. Instructor: Emmanuel K. Appiah-Adjei (PhD) Department of Geological Engineering KNUST, Kumasi
 Department of Geological Engineering KNUST, Kumasi") UNIT 4: USING ArcGIS Instructor: Emmanuel K. Appiah-Adjei (PhD) Department of Geological Engineering KNUST, Kumasi Getting to Know ArcGIS ArcGIS is an integrated collection of GIS software products ArcGIS
UNIT 4: USING ArcGIS Instructor: Emmanuel K. Appiah-Adjei (PhD) Department of Geological Engineering KNUST, Kumasi Getting to Know ArcGIS ArcGIS is an integrated collection of GIS software products ArcGIS
Task 1: Start ArcMap and add the county boundary data from your downloaded dataset to the data frame.
 Exercise 6 Coordinate Systems and Map Projections The following steps describe the general process that you will follow to complete the exercise. Specific steps will be provided later in the step-by-step
Applied Cartography and Introduction to GIS GEOG 2017 EL. Lecture-1 Chapters 1 and 2
 Applied Cartography and Introduction to GIS GEOG 2017 EL Lecture-1 Chapters 1 and 2 What is GIS? A Geographic Information System (GIS) is a computer system for capturing, storing, querying, analyzing and
Introduction to GIS. Phil Guertin School of Natural Resources and the Environment GeoSpatial Technologies
 Introduction to GIS Phil Guertin School of Natural Resources and the Environment dguertin@cals.arizona.edu Mapping GeoSpatial Technologies Traditional Survey Global Positioning Systems (GPS) Remote Sensing
Delineation of high landslide risk areas as a result of land cover, slope, and geology in San Mateo County, California
 Delineation of high landslide risk areas as a result of land cover, slope, and geology in San Mateo County, California Introduction Problem Overview This project attempts to delineate the high-risk areas
Quiz 1. Quiz Instruc ons. Question 1. Question 2. 2 pts. 3 pts. This is a preview of the published version of the quiz. Started: Jul 3 at 4:29pm
 Quiz 1 This is a preview of the published version of the quiz Started: Jul 3 at 4:29pm Quiz Instruc ons Quiz 1 Question 1 Which of the following is not a basic element of map design that should be considered
Overlay Analysis II: Using Zonal and Extract Tools to Transfer Raster Values in ArcMap
 Overlay Analysis II: Using Zonal and Extract Tools to Transfer Raster Values in ArcMap Created by Patrick Florance and Jonathan Gale, Edited by Catherine Ressijac on March 26, 2018 If you have raster data
GIS in Water Resources Midterm Exam Fall 2008 There are 4 questions on this exam. Please do all 4.
 Page 1 of 8 Name: GIS in Water Resources Midterm Exam Fall 2008 There are 4 questions on this exam. Please do all 4. 1. Basic Concepts [20 points] Find the letter with the best answer for each term: 1.
Lecture 7: GIS Data Capture and Metadata
 Lecture 7: GIS Data Capture and Metadata Section I: Overview of GIS Data Capture As you read this lecture think about the type of data capture and how metadata can help with your final project. Introduction
Unit 1 The Basics of Geography. Chapter 1 The Five Themes of Geography Page 5
 Unit 1 The Basics of Geography Chapter 1 The Five Themes of Geography Page 5 Geography comes from the Greek word geographia, which means to describe the earth. Geography is the study of the distribution
Wed. Apr. 25, 2018 GIS DEMO. Reading: Ch Comparing Image Types (Death Valley) Treat as review of techniques already studied
 Treat as review of techniques already studied") Wed. Apr. 25, 2018 GIS DEMO Reading: Ch. 14 -- Comparing Image Types (Death Valley) Treat as review of techniques already studied 1 GIS: Geographic Information Systems Way to organize data obtained by
Wed. Apr. 25, 2018 GIS DEMO Reading: Ch. 14 -- Comparing Image Types (Death Valley) Treat as review of techniques already studied 1 GIS: Geographic Information Systems Way to organize data obtained by
Understanding Projections
 GEOGRAPHY SKILLS 1 Understanding Projections The earth is a sphere and is best shown as a globe. For books and posters, though, the earth has to be represented as a flat object. To do this, mapmakers create