CHAPTER 9 DATA DISPLAY AND CARTOGRAPHY
|
|
|
- Loreen Tucker
- 6 years ago
- Views:
Transcription
1 CHAPTER 9 DATA DISPLAY AND CARTOGRAPHY 9.1 Cartographic Representation Spatial Features and Map Symbols Use of Color Data Classification Generalization Box 9.1 Representations 9.2 Types of Quantitative Maps Box 9.2 Locating Dots on a Dot Map Box 9.3 Mapping Derived and Absolute Values 9.3 Typography Type Variations Selection of Type Variations Placement of Text in the Map Body Box 9.4 Options for Dynamic Labeling 9.4 Map Design Layout Box 9.5 Wizards for Adding Map Elements Visual Hierarchy 9.5 Map Production Box 9.6 Working with Soft-Copy Maps Box 9.7 A Web Tool for Making Color Maps Key Concepts and Terms Review Questions Copyright The McGraw-Hill Companies, Inc. Permission required for reproduction or display. Applications: Data Display and Cartography Task 1: Make a Choropleth Map Task 2: Use Graduated Symbols, Line Symbols, Highway Shield Symbols, and Text Symbols Task 3: Label Streams Challenge Task References 1


2 Common Map Elements Common map elements are the title, body, legend, north arrow, scale, acknowledgment, and neatline/map border. Other elements include the graticule or grid, name of map projection, inset or location map, and data quality information. Figure 9.1 Common map elements. 2
3 Cartographic Representation Cartography is the making and study of maps in all their aspects. Cartographers classify maps into general reference or thematic, and qualitative or quantitative. Spatial Features and Map Symbols To display a spatial feature on a map, we use a map symbol to indicate the feature s location and a visual variable, or visual variables, with the symbol to show the feature s attribute data. The general rule for vector data is to use point symbols for point features, line symbols for line features, and area symbols for area features. Visual variables for data display include hue, value, chroma, size, texture, shape, and pattern. 3

4 Figure 9.2 This map uses area symbols to show watersheds, a line symbol for streams, and a point symbol for gage stations. Figure 9.3 Visual variables in cartographic symbolization. 4
5 Use of Color Color has the visual dimensions of hue, value, and chroma. Hue is the quality that distinguishes one color from another. Value is the lightness or darkness of a color. Chroma refers to the richness, or brilliance, of a color. Hue is a visual variable better suited for qualitative (nominal) data, whereas value and chroma are better suited for quantitative (ordinal, interval, and ratio) data. Quantitative color schemes include the single hue, hue and value, diverging or double-ended, part spectral, and full spectral. Data Classification Six commonly used classification methods are: equal interval, geometric interval, equal frequency, mean and standard deviation, natural breaks, and user defined. 5

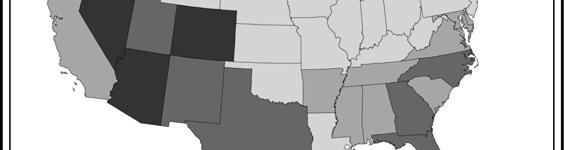
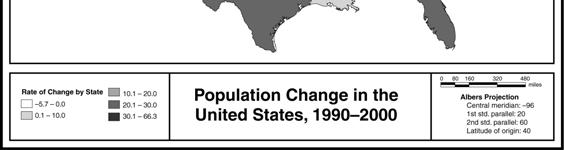
6 Generalization Generalization is considered a necessary part of cartographic representation. Change of scale is often the reason that calls for generalization. When mapped at a smaller scale than that of the source map, the amount of map space is greatly reduced and, as a result, map symbols become congested and may even overlap one another. Cartographers may group or merge spatial features into one single feature and may shift spatial features to create space between them. Figure 9.4 Six common types of quantitative maps. 6
 but not the dasymetric map (right).")
7 Figure 9.5 Map symbols follow the boundaries in the choropleth map (left) but not the dasymetric map (right). Raster Map Raster maps are cell-based. They can be qualitative (categorical) or quantitative (numeric). 7

8 Figure 9.6 Map showing raster-based elevation data. Cells with higher elevations have darker shades. Typography Text is needed for almost every map element. Mapmakers treat text as a map symbol because, like point, line, or area symbols, text can have many type variations. 8
9 Figure 9.7 Times New Roman is a serif typeface, and Tahoma is a sans serif typeface. Figure 9.8 Type variations in weight and roman versus italic. 9

10 Selection of Type Variations Cartographers recommend legibility, harmony, and conventions for selection of type variations. Mapmakers can generally achieve harmony by adopting only one or two typefaces on a map. Figure 9.9 The look of the map is not harmonious because of too many typefaces. 10
11 Placement of Text As a general rule, a label should be placed to show the location or the area extent of the named spatial feature. ArcGIS offers interactive and dynamic labeling for placement of text in the map body. Figure 9.10 Dynamic labeling of major cities in the United States. The initial result is good but not totally satisfactory. Philadelphia is missing. Labels of San Antonio, Indianapolis, and Baltimore overlap slightly with point symbols. San Francisco is too close to San Jose. 11
12 Figure 9.11 A revised version of Figure Philadelphia is added to the map, and several city names are moved individually to be closer to their point symbols. Figure 9.12 A leader line connects a point symbol to its label. 12
13 Figure 9.13 Dynamic labeling of streams may not work for every label. Brown Cr. overlaps with Fagan Cr., and Pamas Cr. and Short Cr. do not follow the course of the creek. Figure 9.14 Problem labels in Figure 9.13 are redrawn with the spline text tool. 13

14 Map Design Map design is a visual plan to achieve a goal. A welldesigned map is balanced, coherent, ordered, and interesting to look at, whereas a poorly designed map is confusing and disoriented. Map design is both an art and science. Cartographers usually study map design from the perspectives of layout and visual hierarchy. Layout deals with the arrangement and composition of various map elements on a map. Major concerns with layout are focus, order, and balance. Visual hierarchy is the process of developing a visual plan to introduce the 3-D effect or depth to maps. Figure 9.15 Use a box around the legend to draw the map reader s attention to it. 14


15 Figure 9.16 A poorly balanced map. Figure 9.17 The basic structure of the conterminous USA layout template in ArcMap. 15


16 Figure 9.18 A visual hierarchy example. The two black circles are on top (closest to the map reader), followed by the gray polygon and the grid. Figure 9.19 The interposition effect in map design. 16

, whereas the line contrast")
17 Figure 9.20 A map looks confusing if it uses too many boxes to highlight individual elements. Figure 9.21 Contrast is missing in (a), whereas the line contrast makes the state outline look more important than the county boundaries in (b). 17
18 Map Production GIS users design and make maps on the computer screen. These soft-copy maps can be printed, exported for use on the Internet, used in overhead computer projection systems, exported to other software packages, or further processed for publishing. Map production is a complex topic. As an example, color symbols from the color printers do not exactly match those on the computer screen. This discrepancy results from the use of different media and color models. Figure 9.22 The RGB (red, green, and blue) color model. 18
19 U.S. Census Bureau: Census 2000 demographic data mapping International Color Consortium ColorBrewer 19
Chapter 7: Making Maps with GIS. 7.1 The Parts of a Map 7.2 Choosing a Map Type 7.3 Designing the Map
 Chapter 7: Making Maps with GIS 7.1 The Parts of a Map 7.2 Choosing a Map Type 7.3 Designing the Map What is a map? A graphic depiction of all or part of a geographic realm in which the real-world features
Making Maps With GIS. Making Maps With GIS
 Making Maps With GIS Getting Started with GIS Chapter 7 Making Maps With GIS 7.1 The Parts of a Map 7.2 Choosing a Map Type 7.3 Designing the Map 1 What is a map? Map is the communication tool for the
The Choropleth Map Slide #2: Choropleth mapping enumeration units
 The Choropleth Map Slide #2: Choropleth mapping is a common technique for representing enumeration data These are maps where enumeration units, such as states or countries, are shaded a particular color
Lecture 5. Symbolization and Classification MAP DESIGN: PART I. A picture is worth a thousand words
 Lecture 5 MAP DESIGN: PART I Symbolization and Classification A picture is worth a thousand words Outline Symbolization Types of Maps Classifying Features Visualization Considerations Symbolization Symbolization
An Information Model for Maps: Towards Cartographic Production from GIS Databases
 An Information Model for s: Towards Cartographic Production from GIS Databases Aileen Buckley, Ph.D. and Charlie Frye Senior Cartographic Researchers, ESRI Barbara Buttenfield, Ph.D. Professor, University
GEOREFERENCING, PROJECTIONS Part I. PRESENTING DATA Part II
 Week 7 GEOREFERENCING, PROJECTIONS Part I PRESENTING DATA Part II topics of the week Georeferencing Coordinate systems Map Projections ArcMap and Projections Geo-referencing Geo-referencing is the process
Theory, Concepts and Terminology
 GIS Workshop: Theory, Concepts and Terminology 1 Theory, Concepts and Terminology Suggestion: Have Maptitude with a map open on computer so that we can refer to it for specific menu and interface items.
ENV208/ENV508 Applied GIS. Week 2: Making maps, data visualisation, and GIS output
 ENV208/ENV508 Applied GIS Week 2: Making maps, data visualisation, and GIS output Overview GIS Output Map Making Types of Maps Key Elements GIS Output Formats Table Graph Statistics Maps Map Making Maps
Basic principles of cartographic design. Makram Murad-al-shaikh M.S. Cartography Esri education delivery team
 Basic principles of cartographic design Makram Murad-al-shaikh M.S. Cartography Esri education delivery team Cartographic concepts Cartography defined The communication channel - Why maps fail Objectives
Overview. GIS Data Output Methods
 Overview GIS Output Formats ENV208/ENV508 Applied GIS Week 2: Making maps, data visualisation, and GIS output GIS Output Map Making Types of Maps Key Elements Table Graph Statistics Maps Map Making Maps
Map image from the Atlas of Oregon (2nd. Ed.), Copyright 2001 University of Oregon Press
, Copyright 2001 University of Oregon Press") Map Layout and Cartographic Design with ArcGIS Desktop Matthew Baker ESRI Educational Services Redlands, CA Education UC 2008 1 Seminar overview General map design principles Working with map elements
Map Layout and Cartographic Design with ArcGIS Desktop Matthew Baker ESRI Educational Services Redlands, CA Education UC 2008 1 Seminar overview General map design principles Working with map elements
Quiz 1. Quiz Instruc ons. Question 1. Question 2. 2 pts. 3 pts. This is a preview of the published version of the quiz. Started: Jul 3 at 4:29pm
 Quiz 1 This is a preview of the published version of the quiz Started: Jul 3 at 4:29pm Quiz Instruc ons Quiz 1 Question 1 Which of the following is not a basic element of map design that should be considered
Geography 281 Map Making with GIS Project Four: Comparing Classification Methods
 Geography 281 Map Making with GIS Project Four: Comparing Classification Methods Thematic maps commonly deal with either of two kinds of data: Qualitative Data showing differences in kind or type (e.g.,
Version 1.1 GIS Syllabus
 GEOGRAPHIC INFORMATION SYSTEMS CERTIFICATION Version 1.1 GIS Syllabus Endorsed 1 Version 1 January 2007 GIS Certification Programme 1. Target The GIS certification is aimed at: Those who wish to demonstrate
Task 1: Open ArcMap and activate the Spatial Analyst extension.
 Exercise 10 Spatial Analyst The following steps describe the general process that you will follow to complete the exercise. Specific steps will be provided later in the step-by-step instructions component
Designing Better Maps
 Designing Better Maps presented by: Tim Haithcoat University of Missouri Columbia with materials of: Dennis Fizsimons, SW Texas State University George McCleary, Jr., University of Kansas Design is a Choice
What is a map? A simple representation of the real world Two types of maps
 Mapping with GIS What is a map? A simple representation of the real world Two types of maps Reference maps showing reference features such as roads, locations, political boundaries, cities etc. Thematic
A Review: Geographic Information Systems & ArcGIS Basics
 A Review: Geographic Information Systems & ArcGIS Basics Geographic Information Systems Geographic Information Science Why is GIS important and what drives it? Applications of GIS ESRI s ArcGIS: A Review
APC Part I Workshop. Mapping and Cartography. 14 November 2014
 APC Part I Workshop Mapping and Cartography 14 November 2014 Cartography Cartography is the discipline dealing with the conception, production, dissemination and study of maps in all forms (ICA) A holistic
Overview key concepts and terms (based on the textbook Chang 2006 and the practical manual)
") Introduction Geo-information Science (GRS-10306) Overview key concepts and terms (based on the textbook 2006 and the practical manual) Introduction Chapter 1 Geographic information system (GIS) Geographically
Introduction Geo-information Science (GRS-10306) Overview key concepts and terms (based on the textbook 2006 and the practical manual) Introduction Chapter 1 Geographic information system (GIS) Geographically
Geographic Systems and Analysis
 Geographic Systems and Analysis New York University Robert F. Wagner Graduate School of Public Service Instructor Stephanie Rosoff Contact: stephanie.rosoff@nyu.edu Office hours: Mondays by appointment
Lecture 10 Mapping Quantities: Dot Density Maps
 Lecture 10 Mapping Quantities: Dot Density Maps Introduction Creating maps of features based on quantity are some of the most common and important types of maps. In order to create maps that show quantity
Performing Advanced Cartography with Esri Production Mapping
 Esri International User Conference San Diego, California Technical Workshops July 25, 2012 Performing Advanced Cartography with Esri Production Mapping Tania Pal & Madhura Phaterpekar Agenda Outline generic
GED 554 IT & GIS. Lecture 6 Exercise 5. May 10, 2013
 GED 554 IT & GIS Lecture 6 Exercise 5 May 10, 2013 Free GIS data sources ******************* Mapping numerical data & Symbolization ******************* Exercise: Making maps for presentation GIS DATA SOFTWARE
Intro to GIS Summer 2012 Data Visualization
 Intro to GIS Summer 2012 Data Visualization UNDERSTANDING YOUR MAP DATA Qualitative vs. Quantitative Data Qualitative Data classified by category e.g. Soil types, Animal Species Quantitative Data grouped
STUDYING THE EFFECT OF DISTORTION IN BASIC MAP ELEMENTS FOR THE DEGREE OF SPATIAL ACCURACY OF GAZA STRIP MAPS
 STUDYING THE EFFECT OF DISTORTION IN BASIC MAP ELEMENTS FOR THE DEGREE OF SPATIAL ACCURACY OF GAZA STRIP MAPS Maher A. El-Hallaq Assistant professor, Civil Engineering Department, IUG,, mhallaq@iugaza.edu.ps
Acknowledgments xiii Preface xv. GIS Tutorial 1 Introducing GIS and health applications 1. What is GIS? 2
 Acknowledgments xiii Preface xv GIS Tutorial 1 Introducing GIS and health applications 1 What is GIS? 2 Spatial data 2 Digital map infrastructure 4 Unique capabilities of GIS 5 Installing ArcView and the
Geo-Visualization. GRS09/10 Ron van Lammeren
 Geo-Visualization GRS09/10 Ron van Lammeren 2/30 Theory Semiologie Graphique http://www.flickr.com/photos/kbean/491051226/ 3/30 How to present my geo data? Visualization definitions Map making Cartographic
Classification Exercise UCSB July 2006
 Classification Exercise UCSB July 2006 Purpose This exercise will examine how spatial data is catergorized and the advantages and disadvantages of different classification methods. Terms to know Population,
Geo-Visualization. GRS1011 Ron van Lammeren
 Geo-Visualization GRS1011 Ron van Lammeren Theory Semiologie Graphique http://www.flickr.com/photos/kbean/491051226/ 2/30 How to present my geo data? Visualization definitions Map making Cartographic process
Maps and Data Types in GIS
 Lecture 3 Maps and Data Types in GIS Tomislav Sapic GIS Technologist Faculty of Natural Resources Management Lakehead University Data Types In GIS, data types and data models are forms of attribute representation
Lecture 2. A Review: Geographic Information Systems & ArcGIS Basics
 Lecture 2 A Review: Geographic Information Systems & ArcGIS Basics GIS Overview Types of Maps Symbolization & Classification Map Elements GIS Data Models Coordinate Systems and Projections Scale Geodatabases
0 Maps are the principle means of displaying spatial data
 Why cartography? 0 Maps are the principle means of displaying spatial data 0 Exploration: visualization, leading to conceptualization of patterns and processes. (Chap 13) 0 Communication: convey information
Performing Map Cartography. using Esri Production Mapping
 AGENDA Performing Map Cartography Presentation Title using Esri Production Mapping Name of Speaker Company Name Kannan Jayaraman Agenda Introduction What s New in ArcGIS 10.1 ESRI Production Mapping Mapping
GTECH 380/722 Analytical and Computer Cartography Hunter College, CUNY Department of Geography
 GTECH 380/722 Analytical and Computer Cartography Hunter College, CUNY Department of Geography Fall 2014 Mondays 5:35PM to 9:15PM Instructor: Doug Williamson, PhD Email: Douglas.Williamson@hunter.cuny.edu
APC PART I WORKSHOP MAPPING AND CARTOGRAPHY
 APC PART I WORKSHOP MAPPING AND CARTOGRAPHY 5 June 2015 MAPPING The act or process of making a map. A matching process where the points of one set are matched against the points of another set. Graphical
Local Government Basemaps using ArcGIS
 Local Government Basemaps using ArcGIS Steve Grisé Scott Oppmann Tuesday, July 14, 10:15-11:30am SDCC 30B Topics Basemaps for Local Government Essential Application-Driven New Ideas Design Strategies Discussion
Cartography and Geovisualization. Chapters 12 and 13 of your textbook
 Cartography and Geovisualization Chapters 12 and 13 of your textbook Why cartography? Maps are the principle means of displaying spatial data Exploration: visualization, leading to conceptualization of
Fundamentals of ArcGIS Desktop Pathway
 Fundamentals of ArcGIS Desktop Pathway Table of Contents ArcGIS Desktop I: Getting Started with GIS 3 ArcGIS Desktop II: Tools and Functionality 5 Understanding Geographic Data 8 Understanding Map Projections
The Geodatabase Working with Spatial Analyst. Calculating Elevation and Slope Values for Forested Roads, Streams, and Stands.
 GIS LAB 7 The Geodatabase Working with Spatial Analyst. Calculating Elevation and Slope Values for Forested Roads, Streams, and Stands. This lab will ask you to work with the Spatial Analyst extension.
GIS Workshop UCLS_Fall Forum 2014 Sowmya Selvarajan, PhD TABLE OF CONTENTS
 TABLE OF CONTENTS TITLE PAGE NO. 1. ArcGIS Basics I 2 a. Open and Save a Map Document 2 b. Work with Map Layers 2 c. Navigate in a Map Document 4 d. Measure Distances 4 2. ArcGIS Basics II 5 a. Work with
MAP SYMBOL BREWER A NEW APPROACH FOR A CARTOGRAPHIC MAP SYMBOL GENERATOR
 MAP SYMBOL BREWER A NEW APPROACH FOR A CARTOGRAPHIC MAP SYMBOL GENERATOR Olaf Schnabel Institute of Cartography, Swiss Federal Institute of Technology (ETH) CH-8093 Zurich, Switzerland schnabel@karto.baug.ethz.ch
GIS in Water Resources Midterm Exam Fall 2016 There are four questions on this exam. Please do all four. They are not all of equal weight.
 Page 1 of 7 Name: GIS in Water Resources Midterm Exam Fall 2016 There are four questions on this exam. Please do all four. They are not all of equal weight. Question 1. (20%) (a) Three key functions of
ArcGIS Pro: Essential Workflows STUDENT EDITION
 ArcGIS Pro: Essential Workflows STUDENT EDITION Copyright 2018 Esri All rights reserved. Course version 6.0. Version release date August 2018. Printed in the United States of America. The information contained
Geog183: Cartographic Design and Geovisualization Winter Quarter 2017 Lecture 6: Map types and Data types
 Geog183: Cartographic Design and Geovisualization Winter Quarter 2017 Lecture 6: Map types and Data types Data types Data dimension: Point, Line, Area, Volume (Text) Data continuity: Discrete, Point, Polygon:
Intro to GIS In Review
 Intro to GIS In Review GIS Analysis Winter 2016 GIS A quarter in review Geographic data types Acquiring GIS data Projections / Coordinate systems Working with attribute tables Data classification Map design
MODULE 12: MAPPING. Key Concepts: Maps for Master Plans
 MODULE 12: MAPPING 237 237 237 217 217 217 200 200 200 80 119 27 Key Concepts: 255 0 163 131 239 110 Maps for Master Plans 255 0 163 132 65 135 255 0 163 122 53 120 Cost Effective Data and Software Map
Mapping Data 1: Constructing a Choropleth Map
 Mapping Data 1: Constructing a Choropleth Map OVERVIEW & OBJECTIVES Students will become acquainted with mapping data and understanding the importance of recognizing patterns by constructing a choropleth
ArcGIS for Desktop. ArcGIS for Desktop is the primary authoring tool for the ArcGIS platform.
 ArcGIS for Desktop ArcGIS for Desktop ArcGIS for Desktop is the primary authoring tool for the ArcGIS platform. Beyond showing your data as points on a map, ArcGIS for Desktop gives you the power to manage
NR402 GIS Applications in Natural Resources
 NR402 GIS Applications in Natural Resources Lesson 1 Introduction to GIS Eva Strand, University of Idaho Map of the Pacific Northwest from http://www.or.blm.gov/gis/ Welcome to NR402 GIS Applications in
ArcGIS Tools for Professional Cartography
 ArcGIS Tools for Professional Cartography By Makram Murad-al-shaikh M.S. Cartography Senior instructor ESRI Educational Services ICC - A Coruña - Spain, 9-16 July, 2005 Overview Overview of the ArcGIS
Introduction to GIS I
 Introduction to GIS Introduction How to answer geographical questions such as follows: What is the population of a particular city? What are the characteristics of the soils in a particular land parcel?
Spatial Representation
 Spatial Representation Visual Culture LCC6311 Tony F. Lockhart 12/9/2009 Page 2 of 5 Table of Contents Introduction... 3 Grid Layout... 3 Public School Funding Visualization... 3 Inspiration... 4 Works
Copyright The McGraw-Hill Companies, Inc. Permission required for reproduction or display.
 CHAPTER 5 GIS DATA Acquisition 5.1 Existing GIS Data 5.1.1 Federal Geographic Data Committee 5.1.2 Geospatial One-Stop Box 5.1 Clearinghouse and Portal 5.1.3 U.S. Geological Survey 5.1.4 U.S. Census Bureau
Visualizing Census Data in GIS. Andrew Rowan, Ph.D. Director, NJ Office of GIS
 Visualizing Census Data in GIS Andrew Rowan, Ph.D. Director, NJ Office of GIS Outline VERY accelerated cartography primer Software choices Demos/how-to ArcGIS Desktop (formerly ArcView) ArcGIS Online Notes
Week 8 Cookbook: Review and Reflection
 : Review and Reflection Week 8 Overview 8.1) Review and Reflection 8.2) Making Intelligent Maps: The map sheet as a blank canvas 8.3) Making Intelligent Maps: Base layers and analysis layers 8.4) ArcGIS
Geography 360 Principles of Cartography. April 17, 2006
 Geography 360 Principles of Cartography April 17, 2006 Outlines Cartographic design principles Enhancing visual hierarchies on maps Kinds of numerical data and color scheme What is proportional symbol
Copyright The McGraw-Hill Companies, Inc. Permission required for reproduction or display.
 Chapter 15. SPATIAL INTERPOLATION 15.1 Elements of Spatial Interpolation 15.1.1 Control Points 15.1.2 Type of Spatial Interpolation 15.2 Global Methods 15.2.1 Trend Surface Models Box 15.1 A Worked Example
Write a report (6-7 pages, double space) on some examples of Internet Applications. You can choose only ONE of the following application areas:
 on some examples of Internet Applications. You can choose only ONE of the following application areas:") UPR 6905 Internet GIS Homework 1 Yong Hong Guo September 9, 2008 Write a report (6-7 pages, double space) on some examples of Internet Applications. You can choose only ONE of the following application
UPR 6905 Internet GIS Homework 1 Yong Hong Guo September 9, 2008 Write a report (6-7 pages, double space) on some examples of Internet Applications. You can choose only ONE of the following application
Snowden Cartography 1 GEOG 315:001 Cartography Thursdays 4:00 6:30PM F375 Fall 2010 Dr. Snowden Course Description
 Snowden Cartography 1 www.drksnowden.com GEOG 315:001 Cartography Thursdays 4:00 6:30PM F375 Fall 2010 Dr. Snowden Course Description Principles and theory of basic map design, layout, and communication.
Problems and Challenges
 2018 Esri Petroleum GIS Conference Problems and Challenges May 9 10, 2018 Houston, Texas George R. Brown Convention Center Disunity of drawing standards and format Large amount of work in Cartography,
Geovisualization of Attribute Uncertainty
 Geovisualization of Attribute Uncertainty Hyeongmo Koo 1, Yongwan Chun 2, Daniel A. Griffith 3 University of Texas at Dallas, 800 W. Campbell Road, Richardson, Texas 75080, 1 Email: hxk134230@utdallas.edu
Designing GIS Databases to Support Mapping and Map Production Charlie Frye, ESRI Redlands Aileen Buckley, ESRI Redlands
 Designing GIS Databases to Support Mapping and Map Production Charlie Frye, ESRI Redlands Aileen Buckley, ESRI Redlands 1 Designing GIS Databases to Support Mapping and Map Production Charlie Frye, ESRI
Physical Geography Lab Activity #15
 Physical Geography Lab Activity #15 Due date Name Choropleth Maps COR Objective 1 & 7, SLOs 1 & 3 15.1. Introduction Up until this point we have used maps to find locations on the Earth. While they are
Introduction to GIS Sarah Watson University of Kentucky Libraries March 6, 2017
 Introduction to GIS Sarah Watson sarahwatson@uky.edu University of Kentucky Libraries March 6, 2017 Outline Overview of various terms Quick overview of ArcGIS and QGIS Geocoding Activity Considering Map
Esri Defense Mapping: Cartographic Production. Bo King
 Esri Defense Mapping: Cartographic Production Bo King Agenda Esri Defense Mapping: Cartographic Production Solution Overview Desktop Cartographic Production Workflow - Create Rapid Graphic Product On Demand
Introduction to Cartography Part I
 Introduction to Cartography Part I Introduction to Cartography Maps vs. Globes General Types of Maps Standard Map Features Maps versus Globes Map: a representation of the world, or part of it, in two dimensions
UNIT 4: USING ArcGIS. Instructor: Emmanuel K. Appiah-Adjei (PhD) Department of Geological Engineering KNUST, Kumasi
 Department of Geological Engineering KNUST, Kumasi") UNIT 4: USING ArcGIS Instructor: Emmanuel K. Appiah-Adjei (PhD) Department of Geological Engineering KNUST, Kumasi Getting to Know ArcGIS ArcGIS is an integrated collection of GIS software products ArcGIS
UNIT 4: USING ArcGIS Instructor: Emmanuel K. Appiah-Adjei (PhD) Department of Geological Engineering KNUST, Kumasi Getting to Know ArcGIS ArcGIS is an integrated collection of GIS software products ArcGIS
What should you consider concerning colors in maps in order to illustrate qualitative data, and quantitative data, respectively? Exemplify.
 1, Cartography, 10 p (HA) _ When doing a map based on quantitative data you have for example to decide upon the classification. Three common classifications are Equal interval, Quantiles (percentiles)
KEYWORDS: census maps, map scale, inset maps, feature density analysis, batch mapping. Introduction
 Automated Detection and Delineation of Inset Maps William G. Thompson ABSTRACT: In order to create a useful map, the cartographer must select a scale at which the map reader can distinguish all features
Delineation of high landslide risk areas as a result of land cover, slope, and geology in San Mateo County, California
 Delineation of high landslide risk areas as a result of land cover, slope, and geology in San Mateo County, California Introduction Problem Overview This project attempts to delineate the high-risk areas
Agenda. Introduction Exercise 1 Map Types. Part 1 ArcGIS Information and Organization Part 2 Purpose, Audience & Constraints.
 Agenda Introduction Exercise 1 Map Types Part 1 ArcGIS Information and Organization Part 2 Purpose, Audience & Constraints Exercise 2 Map Critique Break Part 3 Basic Cartographic Design Principles Part
Grid to LandGrid Volumetrics Workflow
 Grid to LandGrid Volumetrics Workflow Petra User Group Session Series Armin Schafer Technical Advisor Petra/Kingdom/GeoSyn/LogArc Encana Amphitheatre Nov 22, 2011 noon 1 pm PURPOSE: to demonstrate the
RNR 516A. Computer Cartography. Spring GIS Portfolio
 RNR 516A Computer Cartography Spring 2016 GIS Portfolio 1 Contents 1 Political and Locator Maps 3 2 Base Maps and Digitizing 4 3 Data Entry Report 5 4 Projections and Symbolization 6 5 Choropleth Mapping
9/7/ Studying Geography: Introduction to Mapping. Cartographic Terms. Cartographic Terms. Geographers Tools. Geographers Needs.
 Geographers Tools Studying Geography: Introduction to Mapping Prof. Anthony Grande Hunter College Geography Lecture design, content and presentation AFG0918. Individual images and illustrations may be
Appropriate Selection of Cartographic Symbols in a GIS Environment
 Appropriate Selection of Cartographic Symbols in a GIS Environment Steve Ramroop Department of Information Science, University of Otago, Dunedin, New Zealand. Tel: +64 3 479 5608 Fax: +64 3 479 8311, sramroop@infoscience.otago.ac.nz
GIS PORTFOLIO MOHAMED MAGDY MOHAMED HUSSAIN GIS ENGINEER. UWF GIS ONLINE CERTIFICATE GIS Internship (GIS4944)
") 2012 GIS PORTFOLIO MOHAMED MAGDY MOHAMED HUSSAIN GIS ENGINEER UWF GIS ONLINE CERTIFICATE GIS Internship (GIS4944) Portfolio Table of Contents Subject... Page Personal statement/mission/philosophy... 1
2012 GIS PORTFOLIO MOHAMED MAGDY MOHAMED HUSSAIN GIS ENGINEER UWF GIS ONLINE CERTIFICATE GIS Internship (GIS4944) Portfolio Table of Contents Subject... Page Personal statement/mission/philosophy... 1
Laboratory Exercise X Most Dangerous Places to Live in the United States Based on Natural Disasters
 Brigham Young University BYU ScholarsArchive Engineering Applications of GIS - Laboratory Exercises Civil and Environmental Engineering 2016 Laboratory Exercise X Most Dangerous Places to Live in the United
GIS CONCEPTS ARCGIS METHODS AND. 3 rd Edition, July David M. Theobald, Ph.D. Warner College of Natural Resources Colorado State University
 GIS CONCEPTS AND ARCGIS METHODS 3 rd Edition, July 2007 David M. Theobald, Ph.D. Warner College of Natural Resources Colorado State University Copyright Copyright 2007 by David M. Theobald. All rights
Esri Production Mapping: Map Automation & Advanced Cartography MADHURA PHATERPEKAR JOE SHEFFIELD
 Esri Production Mapping: Map Automation & Advanced Cartography MADHURA PHATERPEKAR JOE SHEFFIELD Traditional Cartography What you really want Cartographic Workflow Output Cartographic Data Symbology Layout
STATION 1 Sediment Sorting (Texture Physical Property)
") Name: Period: Date: PHYSICAL AND CHEMICAL PROPERTIES OF SOIL INVESTIGATION ROTATION OVERVIEW: Physical and Chemical Properties http://www.nrcs.usda.gov/wps/portal/nrcs/detail/nj/home/?cid=nrcs141p2_018993
Name: Period: Date: PHYSICAL AND CHEMICAL PROPERTIES OF SOIL INVESTIGATION ROTATION OVERVIEW: Physical and Chemical Properties http://www.nrcs.usda.gov/wps/portal/nrcs/detail/nj/home/?cid=nrcs141p2_018993
Different Displays of Thematic Maps:
 Different Displays of Thematic Maps: There are a number of different ways to display or classify thematic maps, including: Natural Breaks Equal Interval Quantile Standard Deviation What s important to
GIS = Geographic Information Systems;
 What is GIS GIS = Geographic Information Systems; What Information are we talking about? Information about anything that has a place (e.g. locations of features, address of people) on Earth s surface,
MAKING MAPS Cartographic Design & Principles Winter 2018
 MAKING MAPS Cartographic Design & Principles Winter 2018 Cartography the art, science, and technology of making maps, together with their study as scientific documents and works of art - The International
Space Informatics Lab - University of Cincinnati
 Space Informatics Lab - University of Cincinnati USER GUIDE SocScape V 1.0 September 2014 1. Introduction SocScape (Social Landscape) is a GeoWeb-based tool for exploration of patterns in high resolution
Welcome to NR502 GIS Applications in Natural Resources. You can take this course for 1 or 2 credits. There is also an option for 3 credits.
 Welcome to NR502 GIS Applications in Natural Resources. You can take this course for 1 or 2 credits. There is also an option for 3 credits. The 1st credit consists of a series of readings, demonstration,
4 Studying Geography:
 4 Studying Geography: Introduction to Mapping Prof. Anthony Grande Hunter College Geography Lecture design, content and presentation AFG0119 Individual images and illustrations may be subject to prior
Esri UC2013. Technical Workshop.
 Esri International User Conference San Diego, California Technical Workshops July 9, 2013 CAD: Introduction to using CAD Data in ArcGIS Jeff Reinhart & Phil Sanchez Agenda Overview of ArcGIS CAD Support
ArcGIS ArcMap: Making Professional Quality Thematic Maps Charlie Frye, ESRI Redlands Aileen Buckley, ESRI Redlands
 ArcGIS ArcMap: Making Professional Quality Thematic Maps Charlie Frye, ESRI Redlands Aileen Buckley, ESRI Redlands 1 ArcGIS ArcMap: Making Professional Quality Thematic Maps Charlie Frye, ESRI Redlands
 estrandh@uoregon.edu Introduction The general topic of this paper describes a unique cartographic project depicting a mountain landscape for the Friends of Opal Creek (F.O.C.), a non-profit organization.
The econ Planning Suite: CPD Maps and the Con Plan in IDIS for Consortia Grantees Session 1
 The econ Planning Suite: CPD Maps and the Con Plan in IDIS for Consortia Grantees Session 1 1 Training Objectives Use CPD Maps to analyze, assess, and compare levels of need in your community Use IDIS
Task 1: Start ArcMap and add the county boundary data from your downloaded dataset to the data frame.
 Exercise 6 Coordinate Systems and Map Projections The following steps describe the general process that you will follow to complete the exercise. Specific steps will be provided later in the step-by-step
Working with ArcGIS: Classification
 Working with ArcGIS: Classification 2 Abbreviations D-click R-click TOC Double Click Right Click Table of Content Introduction The benefit from the use of geographic information system (GIS) software is
GTECH 380/722 Analytical and Computer Cartography Hunter College, CUNY Department of Geography
 GTECH 380/722 Analytical and Computer Cartography Hunter College, CUNY Department of Geography Fall 2011 Mondays 5:35PM to 9:15PM Instructor: Doug Williamson, PhD Email: Douglas.Williamson@hunter.cuny.edu
Geodatabase Management Pathway
 Geodatabase Management Pathway Table of Contents ArcGIS Desktop II: Tools and Functionality 3 ArcGIS Desktop III: GIS Workflows and Analysis 6 Building Geodatabases 8 Data Management in the Multiuser Geodatabase
Introducing GIS analysis
 1 Introducing GIS analysis GIS analysis lets you see patterns and relationships in your geographic data. The results of your analysis will give you insight into a place, help you focus your actions, or
Thomas J. Botzman, Ph.D. President. President s Message 2. Official Color Palette 3. The Logo 4. The Icon 7. The Wordmark 10
 Graphic Standards Manual Misericordia University PRESIDENT S MESSAGE This graphic standards manual introduces and explains Misericordia s visual identity and institutional brand. The consistent use of
GIS CONCEPTS ARCGIS METHODS AND. 2 nd Edition, July David M. Theobald, Ph.D. Natural Resource Ecology Laboratory Colorado State University
 GIS CONCEPTS AND ARCGIS METHODS 2 nd Edition, July 2005 David M. Theobald, Ph.D. Natural Resource Ecology Laboratory Colorado State University Copyright Copyright 2005 by David M. Theobald. All rights
Exercise 4 Estimating the effects of sea level rise on coastlines by reclassification
 Exercise 4 Estimating the effects of sea level rise on coastlines by reclassification Due: Thursday February 1; at the start of class Goal: Get familiar with symbolizing and making time-series maps of
Quality and Coverage of Data Sources
 Quality and Coverage of Data Sources Objectives Selecting an appropriate source for each item of information to be stored in the GIS database is very important for GIS Data Capture. Selection of quality