What is a map? A simple representation of the real world Two types of maps
|
|
|
- Blaze Stephens
- 5 years ago
- Views:
Transcription
1 Mapping with GIS
2 What is a map? A simple representation of the real world Two types of maps Reference maps showing reference features such as roads, locations, political boundaries, cities etc. Thematic maps maps on special themes maps on a particular theme or a special topic.
3 Types of Maps Reference maps general information about the location of features Ex; Road maps Thematic or statistical maps show the distribution of a specific topic Ex; Population distribution maps Food Accessibility Natura Miles N Kilometers N Food Affordability and Accessibility Classification Type - Natural Break Roads Critically Vulnerable Area Vulnerable Area Moderately Vulnerable Area Less Vulnerable Area Least Vulnerable Area North and Eastern provinces Sri lanka

4 Type of Thematic Maps Choropleth maps Map showing quantitative data as a colour Can show the quantity, average value, density, percentage of an event within a geographical area Sequential colour increasing or decreasing vales

5 Type of Thematic Maps Proportional or graduated symbols represent data associated with point locations such as cities Data is displayed on these maps with proportionally sized symbols to show differences in occurrences
 or is collected by area (e.g. - tons of corn per acre by county).")
6 Types of thematic maps Isarithmic (Isopleth) or contour maps uses isolines to depict continuous values like precipitation levels Isarithmic maps also follow the basic rule that there is a high and low side in relation to the isoline data for isarithmic maps is gathered via measureable points (e.g. - weather stations) or is collected by area (e.g. - tons of corn per acre by county).

7 Types of thematic maps Dot density maps Uses dots to show the presence of a theme and display a spatial pattern On these maps, a dot can represent one unit or several, depending on what is being depicted with the map

8 Types of thematic maps Dasymetric maps is a complex variation of the choropleth map works by using statistics and extra information to combine areas with similar values


9 General Mapping Concepts All maps are representations. Model of the earth at a reduced scale 3D objects 2D display. map projection are use to transfer from 3D to 2D Symbols represent Actual objects Symbols should be easily understood by the map reader
10 Composition of a map Map Title Legend Scale Other information that required for complete presentation data 30 Food Accessibility Natural Br Food Accessibility 0 30 Miles N Food Affordability and Accessibility Classification Type - Natural Breaks Critically Vulnerable Area Vulnerable Area Moderately Vulnerable Area Less Vulnerable Area Least Vulnerable Area North and Eastern provinces
11 Map Scale Maps - models of the earth indicates the relationship between a certain distance on the map and the distance on the ground A ratio or representative fraction (RF) indicates how many units on the earth's surface is equal to one unit on the map It can be expressed as 1/100,000 or 1:100,000 word statement gives a written description of map distance; Eg. "One centimeter equals one kilometer graphic scale Suitable when the maps are modified using photocopying etc. Large and small scales scsle should be sufficient enough to display required information
12 Symbolization Assigning symbols to represent features Map symbolization is the characters, letters, or similar graphic representations used on a map to indicate an object or characteristic in the real world Factors considered selecting symbols for a map Map Scale Nature of the phenomenon being mapped Available data
13 Mapping Understanding the data Geographic Dimension Type of geographic features Points features Ex; Airports, oil wells Line Features Ex; Railways, highways Areal features Ex; Districts, forest areas In some cases feature type decides by the map scale
14 Mapping Measurement Level of data Qualitative data Quantitative data Data can be Nominal - basically refers to categorically discrete data such as name of your school, type of car you drive or name of a book. Ordinal - refers to quantities that have a natural ordering, With ordinal data you cannot state with certainty whether the intervals between each value are equal. Interval - data is like ordinal except we can say the intervals between each value are equally split, Eg. temperature in degrees Fahrenheit. The difference between 29 and 30 degrees is the same magnitude as the difference between 78 and 79. Ratio - interval data with a natural zero point, time is ratio since 0 time is meaningful. Degrees Kelvin has a 0 point (absolute 0) and the steps in both these scales have the same degree of magnitude.


15 Mapping Choosing symbols Visual Variables Size Shape Orientation Pattern Hue value


16 Mapping combinations of data and symbols Location data Points low values small symbols high values large symbols Dotted values Density high High value For Quantitative data shaded area map low values - light high values - dark When colour use different shades of a single hue light red medium red dark red

17 Quantitative and Qualitative data
18 Classification Necessary to classify the data before mapping maximize the between-class differences minimize the within-class differences Several approaches to classify data Understanding basic statistics is important Mean Standard deviation Data distribution
19 Classification Equal range Equal distance between class breaks Useful enumeration areas are of equal size

20 Classification Quantiles Equal number of observations in each class Class intervals can be dramatically different in size
21 Classification Standard deviation Class breaks based on distance of standard deviation from the mean Useful - Data that is normally distributed

22 Classification Natural breaks Class breaks conform to gaps in data distribution mathematically minimizes variation within classes and maximizes variation between classes.


23

24
25
26 What is Map Projection? Apply a Model. Sphere,Ellipsoid or Geoid Scale the model. (Usually Reduction) Apply Transformation
27 Map Projections Set of rules for transforming features from the threedimensional earth onto a two-dimensional display. All map projections distort the surface in some way Map projections differ in the way they handle four properties: Area Angles Distance Direction
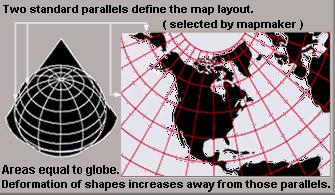
28 Map Projections Equal Area projections preserve areas Conformal projections Equidistant projections -preserve distance from some standard point or line Azimuthal projections - directions from a central point are preserved Compromise projections - seeking a balance between distortions or make things "look right

29
30 Projections by surface Three developable surfaces (plane, cylinder, cone) provide useful models for understanding, describing, and developing map projections
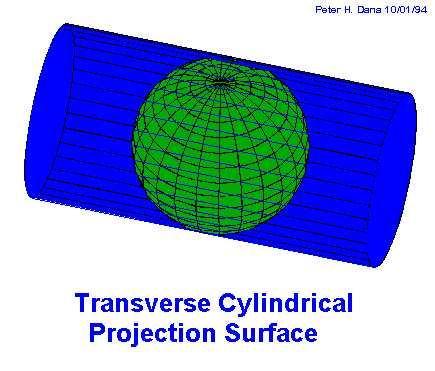

31 Transverse Mercator Projection

32 Transverse Mercator Projection

33

34 Conical Projection


35 Azimuthal Projection

36 Universal Transverse Mercator Projection (UTM) Cylindrical projection system Presented by Gerardus Mercator in 1569 preserving the angles and the shapes of small objects conformal The system instead divides the Earth into sixty zones, each a six-degree band of longitude.
37 Datum Transformation Kandawala WGS84 Everest WGS84 Reference Ellipsoid Used by GPS
38 Coordinate Sri Lanka National Grid Piduruthalagala #
39 T. M. Parameters Latitude N Longitude E Scale False Northing m False Easting m
Overview key concepts and terms (based on the textbook Chang 2006 and the practical manual)
") Introduction Geo-information Science (GRS-10306) Overview key concepts and terms (based on the textbook 2006 and the practical manual) Introduction Chapter 1 Geographic information system (GIS) Geographically
Introduction Geo-information Science (GRS-10306) Overview key concepts and terms (based on the textbook 2006 and the practical manual) Introduction Chapter 1 Geographic information system (GIS) Geographically
ch02.pdf chap2.pdf chap02.pdf
 Introduction to Geographic Information Systems 8th Edition Karl Solutions Manual Full Download: http://testbanklive.com/download/introduction-to-geographic-information-systems-8th-edition-karl-solutions-manu
Version 1.1 GIS Syllabus
 GEOGRAPHIC INFORMATION SYSTEMS CERTIFICATION Version 1.1 GIS Syllabus Endorsed 1 Version 1 January 2007 GIS Certification Programme 1. Target The GIS certification is aimed at: Those who wish to demonstrate
The Elements of GIS. Organizing Data and Information. The GIS Database. MAP and ATRIBUTE INFORMATION
 GIS s Roots in Cartography Getting Started With GIS Chapter 2 Dursun Z. Seker MAP and ATRIBUTE INFORMATION Data (numbers and text) store as files refer to them collectively as a database gather inform.
Modern Navigation. Thomas Herring
 12.215 Modern Navigation Thomas Herring Today s class Map Projections: Why projections are needed Types of map projections Classification by type of projection Classification by characteristics of projection
Chapter 02 Maps. Multiple Choice Questions
 Chapter 02 Maps Multiple Choice Questions 1. Every projection has some degree of distortion because A. a curved surface cannot be represented on a flat surface without distortion. B. parallels and meridians
Map Projections. Displaying the earth on 2 dimensional maps
 Map Projections Displaying the earth on 2 dimensional maps Map projections Define the spatial relationship between locations on earth and their relative locations on a flat map Are mathematical expressions
Maps: Geography s Basic Tools
 Maps: Geography s Basic Tools What is a map? - A map is a representation of the earth s features drawn on a flat surface. - Maps use points, lines, colours, and symbols to represent the features of an
Introduction to Cartography Part I
 Introduction to Cartography Part I Introduction to Cartography Maps vs. Globes General Types of Maps Standard Map Features Maps versus Globes Map: a representation of the world, or part of it, in two dimensions
Outline. Shape of the Earth. Geographic Coordinates (φ, λ, z) Ellipsoid or Spheroid Rotate an ellipse around an axis. Ellipse.
 Ellipsoid or Spheroid Rotate an ellipse around an axis. Ellipse.") Map Projections Outline Geodesy and map projections Prof. D. Nagesh Kumar Department of Civil Engineering Indian Institute of Science Bangalore 560 012, India http://www.civil.iisc.ernet.in/~nagesh Shape
Map Projections Outline Geodesy and map projections Prof. D. Nagesh Kumar Department of Civil Engineering Indian Institute of Science Bangalore 560 012, India http://www.civil.iisc.ernet.in/~nagesh Shape
Geographers Perspectives on the World
 What is Geography? Geography is not just about city and country names Geography is not just about population and growth Geography is not just about rivers and mountains Geography is a broad field that
Lecture 4. Coordinate Systems & Projections
 Lecture 4 Coordinate Systems & Projections Outline Geodesy Geoids Ellipsoids Geographic Coordinate Systems Magnetic North vs. True North Datums Projections Applying Coordinate Systems and Projections Why
This week s topics. Week 6. FE 257. GIS and Forest Engineering Applications. Week 6
 FE 257. GIS and Forest Engineering Applications Week 6 Week 6 Last week Chapter 8 Combining and splitting landscape features and merging GIS databases Chapter 11 Overlay processes Questions? Next week
Lecture 5. Symbolization and Classification MAP DESIGN: PART I. A picture is worth a thousand words
 Lecture 5 MAP DESIGN: PART I Symbolization and Classification A picture is worth a thousand words Outline Symbolization Types of Maps Classifying Features Visualization Considerations Symbolization Symbolization
Georeferencing, Map Projections, Cartographic Concepts. -Coordinate Systems -Datum
 Georeferencing, Map Projections, Cartographic Concepts -Map Projections -Coordinate Systems -Datum Map projection is "the process of systematically transforming positions on the Earth's spherical surface
Map Projections. What does the world look like? AITOFF AZIMUTHAL EQUIDISTANT BEHRMANN EQUAL AREA CYLINDRICAL
 Map Projections What does the world look like? AITOFF AZIMUTHAL EQUIDISTANT BEHRMANN EQUAL AREA CYLINDRICAL 1 CYLINDRICAL EQUAL AREA BONNE CRASTER PARABOLIC 2 ECKERT I ECKERT III ECKERT V There are many
A map is a small-scale flat-surface representation of some portion of the earth s surface.
 MAPS AND CHARTS A map is a small-scale flat-surface representation of some portion of the earth s surface. A representation that is designed for plotting navigational information is called a chart. Often
Applied Cartography and Introduction to GIS GEOG 2017 EL. Lecture-1 Chapters 1 and 2
 Applied Cartography and Introduction to GIS GEOG 2017 EL Lecture-1 Chapters 1 and 2 What is GIS? A Geographic Information System (GIS) is a computer system for capturing, storing, querying, analyzing and
What should you consider concerning colors in maps in order to illustrate qualitative data, and quantitative data, respectively? Exemplify.
 1, Cartography, 10 p (HA) _ When doing a map based on quantitative data you have for example to decide upon the classification. Three common classifications are Equal interval, Quantiles (percentiles)
Geog183: Cartographic Design and Geovisualization Winter Quarter 2017 Lecture 6: Map types and Data types
 Geog183: Cartographic Design and Geovisualization Winter Quarter 2017 Lecture 6: Map types and Data types Data types Data dimension: Point, Line, Area, Volume (Text) Data continuity: Discrete, Point, Polygon:
2. GETTING STARTED WITH GIS
 2. GETTING STARTED WITH GIS What are geographic information systems and what are they used for? ArcGIS: ArcMap, ArcCatalog and ArcToolbox Vector data vs. raster data vs. attribute tables Polygons, polylines,
Different types of maps and how to read them.
 Different types of maps and how to read them. A map is a picture or representation of the Earth's surface, showing how things are related to each other by distance, direction, and size. Maps have been
Introduction to Geoinformatics I
 Introduction to Geoinformatics I MAP CONCEPT Definition: 1) A map is a visual representation of an area a symbolic depiction highlighting relationships between elements of that space such as objects, regions,
The Choropleth Map Slide #2: Choropleth mapping enumeration units
 The Choropleth Map Slide #2: Choropleth mapping is a common technique for representing enumeration data These are maps where enumeration units, such as states or countries, are shaded a particular color
APC Part I Workshop. Mapping and Cartography. 14 November 2014
 APC Part I Workshop Mapping and Cartography 14 November 2014 Cartography Cartography is the discipline dealing with the conception, production, dissemination and study of maps in all forms (ICA) A holistic
Importance of Understanding Coordinate Systems and Map Projections.
 Importance of Understanding Coordinate Systems and Map Projections. 1 It is extremely important that you gain an understanding of coordinate systems and map projections. GIS works with spatial data, and,
Referencing map features: Coordinate systems and map projections
 Referencing map features: Coordinate systems and map projections Coordinate systems and map projections if we want to integrate geographic data from many different sources, we need to use a consistent
Intro to GIS Summer 2012 Data Visualization
 Intro to GIS Summer 2012 Data Visualization UNDERSTANDING YOUR MAP DATA Qualitative vs. Quantitative Data Qualitative Data classified by category e.g. Soil types, Animal Species Quantitative Data grouped
Introduction to Geographic Information Science. Updates/News. Last Lecture. Geography 4103 / Map Projections and Coordinate Systems
 Geography 4103 / 5103 Introduction to Geographic Information Science Map Projections and Coordinate Systems Updates/News Thursday s lecture Reading discussion 1 find the readings online open questions,
Georeferencing. Place names Postal addresses Postal codes Coordinate systems (lat/long, UTM, etc.)
") Georeferencing Georeferencing Used to describe the act of assigning locations to data or information Certain requirements include that they are: unique, have shared meaning, and are persistent through
Georeferencing Georeferencing Used to describe the act of assigning locations to data or information Certain requirements include that they are: unique, have shared meaning, and are persistent through
Coordinate Systems. Location on earth is defined by coordinates
 Coordinate Systems We think of the earth as a sphere It is actually a spheroid (ellipsoid), slightly larger in radius at the equator than at the poles Shape of the Earth Location on earth is defined by
Lesson 5: Map Scale and Projections
 Organizing Data and Information Lesson 5: Map Scale and Projections Map Scales Projections Information can be organized as lists, numbers, tables, text, pictures, maps, or indexes. Clusters of information
Map projections. Rüdiger Gens
 Rüdiger Gens Coordinate systems Geographic coordinates f a: semi-major axis b: semi-minor axis Geographic latitude b Geodetic latitude a f: flattening = (a-b)/a Expresses as a fraction 1/f = about 300
Chapter 7: Making Maps with GIS. 7.1 The Parts of a Map 7.2 Choosing a Map Type 7.3 Designing the Map
 Chapter 7: Making Maps with GIS 7.1 The Parts of a Map 7.2 Choosing a Map Type 7.3 Designing the Map What is a map? A graphic depiction of all or part of a geographic realm in which the real-world features
Working with georeferenced data. What is georeferencing? Coordinate Systems. Geographic and Projected Coordinate System
 GIS501 Fundamentals of Geographical Information Systems (GIS) Coordinate Systems Working with georeferenced data What is georeferencing? Geographically referenced data which is, in some way, referenced
WHERE ARE YOU? Maps & Geospatial Concepts Fall 2012
 WHERE ARE YOU? Maps & Geospatial Concepts Fall 2012 Where are you? Relative location I m at school Absolute Location 45 26 18.07 122 43 50.78 Datums Datums A reference surface of the Earth Used as the
1. Origins of Geography
 II. ORIGINS AND BRANCHES OF GEOGRAPHY My Notes A. Origins of Geography Unit One 6 Before carefully examining the tools of the geographer, it would be useful to examine the origins and roots of this ancient
Designing Better Maps
 Designing Better Maps presented by: Tim Haithcoat University of Missouri Columbia with materials of: Dennis Fizsimons, SW Texas State University George McCleary, Jr., University of Kansas Design is a Choice
How does an ellipsoid differ from a sphere in approximating the shape and size of the Earth?
 Chapter 02 Test Bank Worksheet Questions 1. What is a map projection? Topic: Map Projection 2. How does an ellipsoid differ from a sphere in approximating the shape and size of the Earth? Topic: Ellipsoid
Georeferencing. datum. projection. scale. The next few lectures will introduce you to these elements. on the Earth, you ll need to understand how
 Georeferencing GOAL: To assign a location to all the features represented in our geographic information data In order to do so, we need to make use of the following elements: ellipsoid/geoid To determine
NR402 GIS Applications in Natural Resources Lesson 4 Map Projections
 NR402 GIS Applications in Natural Resources Lesson 4 Map Projections From http://www.or.blm.gov/gis/ 1 Geographic coordinates Coordinates are expressed as Latitude and Longitude in Degrees, Minutes, Seconds
1/28/16. EGM101 Skills Toolbox. Oblate spheroid. The shape of the earth Co-ordinate systems Map projections. Geoid
 EGM101 Skills Toolbox Oblate spheroid The shape of the earth Co-ordinate systems Map projections The geoid is the shape that the surface of the oceans would take under the influence of Earth's gravitation
Shape e o f f the e Earth
 1 Coordinate Systems & Projections Coordinate Systems Two map layers are not going to register spatially unless they are based on the same coordinate system. 2 Contents Shape of the earth Datum Projections
ENV208/ENV508 Applied GIS. Week 2: Making maps, data visualisation, and GIS output
 ENV208/ENV508 Applied GIS Week 2: Making maps, data visualisation, and GIS output Overview GIS Output Map Making Types of Maps Key Elements GIS Output Formats Table Graph Statistics Maps Map Making Maps
1. Geospatial technology rarely links geospatial data to nonspatial data. a. True *b. False
 Chapter 2 Where in the Geospatial World Are You? 1. Geospatial technology rarely links geospatial data to nonspatial data. 2. For geospatial technology to work, every location on Earth must be: a. inhabited
Overview. GIS Data Output Methods
 Overview GIS Output Formats ENV208/ENV508 Applied GIS Week 2: Making maps, data visualisation, and GIS output GIS Output Map Making Types of Maps Key Elements Table Graph Statistics Maps Map Making Maps
Projections Part I - Categories and Properties James R. Clynch February 2006
 I. Introduction and References Projections Part I - Categories and Properties James R. Clynch February 2006 The world is, approximately, a sphere. Maps are flat. Making maps requires some method of putting
WHERE ARE YOU? Maps & Geospatial Concepts Fall 2015
 WHERE ARE YOU? Maps & Geospatial Concepts Fall 2015 Where are you? Relative location I m at school Absolute Location 45 26 18.07 122 43 50.78 Where is Boston? Introducing Geodesy, Ellipsoids & Geoids Geodesy
CHAPTER 9 DATA DISPLAY AND CARTOGRAPHY
 CHAPTER 9 DATA DISPLAY AND CARTOGRAPHY 9.1 Cartographic Representation 9.1.1 Spatial Features and Map Symbols 9.1.2 Use of Color 9.1.3 Data Classification 9.1.4 Generalization Box 9.1 Representations 9.2
The World of Geography Pre-Test/Study Guide Chapter 1 Test
 Read each statement or question. On the lines below write the letter of the best answer. 1. Geographers look at the Earth 5. What are the two specific A. by studying cities first. measurements of Earth
Name Class Date. For each pair of terms, explain how the meanings of the terms differ.
 Skills Worksheet Chapter Review USING KEY TERMS For each pair of terms, explain how the meanings of the terms differ. 1. true north and magnetic north 2. latitude and longitude 3. equator and prime meridian
Projections and Coordinate Systems
 Projections and Coordinate Systems Overview Projections Examples of different projections Coordinate systems Datums Projections Overview Projections and Coordinate Systems GIS must accurately represent
Introduction to Cartography GEOG 2016 E. Lecture-2 Geodesy and Projections
 Introduction to Cartography GEOG 2016 E Lecture-2 Geodesy and Projections What is Geodesy? The science of geodesy determines: Earth s shape and Interrelation of different points on earth s surface The
Terms GIS GPS Vector Data Model Raster Data Model Feature Attribute Table Point Line Polygon Pixel RGB Overlay Function
 FINAL REVIEW FOR GIS (2016) PRACTICAL COMPONENT The first 40 mins of the exam will be open book and will require you to make a map using all the techniques learned over the semester. This map will be e-mailed
Test Bank Chapter 2: Representations of Earth
 Multiple Choice Test Bank Chapter 2: Representations of Earth 1. A rhumb line on a Mercator projection is a line of. a. true size b. true shape c. true compass bearing d. true location 2. Maximum longitude
What Is a Globe? Hemispheres. Main Idea Globes and maps provide different ways of showing features of the earth. Terms to Know
 r Main Idea Globes and maps provide different ways of showing features of the earth. Terms to Know hemisphere latitude longitude scale bar scale relief elevation contour line What Is a Globe? A globe is
Map projections. Rüdiger Gens
 Rüdiger Gens 2 Outline! Relevant terms! Why map projections?! Map projection categories " Projection surfaces " Features preserved from distortions! Map projection examples! Right choice Relevant terms!
AP Human Geography Chapter 1: Thinking Geographically Key Issue 1: How do Geographers describe where things are?
 AP Human Geography Chapter 1: Thinking Geographically Key Issue 1: How do Geographers describe where things are? Studying Human Geography Physical Geography Physical geography deals with Earth s natural
What is Geography? Lecture 1 The Earth As A Rotating Planet. What is Geography? What is geography? Subfields of Geography?
 Lecture 1 The Earth As A Rotating Planet Geog210 Physical Geography What is Geography? Much more than place names and locations The study of spatial variation How and why things differ from place to place
Dr. ABOLGHASEM AKBARI Faculty of Civil Engineering & Earth Resources, University Malaysia Pahang (UMP)
") Workshop on : Dr. ABOLGHASEM AKBARI Faculty of Civil Engineering & Earth Resources, University Malaysia Pahang (UMP) 14-15 April 2016 Venue: Tehran, Iran GIS definitions GIS: A simplified view of the real
Workshop on : Dr. ABOLGHASEM AKBARI Faculty of Civil Engineering & Earth Resources, University Malaysia Pahang (UMP) 14-15 April 2016 Venue: Tehran, Iran GIS definitions GIS: A simplified view of the real
Map Projections & Coordinate Systems
 Map Projections & Coordinate Systems 9/7/2017 1 Why? Laying the Earth Flat Need convenient means of measuring and comparing distances, directions, areas, shapes. Traditional surveying instruments measure
GEOREFERENCING, PROJECTIONS Part I. PRESENTING DATA Part II
 Week 7 GEOREFERENCING, PROJECTIONS Part I PRESENTING DATA Part II topics of the week Georeferencing Coordinate systems Map Projections ArcMap and Projections Geo-referencing Geo-referencing is the process
Chapter 3 Models of the Earth. 3.1 Finding Locations on the Earth. 3.1 Objectives
 Chapter 3 Models of the Earth 3.1 Finding Locations on the Earth 3.1 Objectives Explain latitude and longitude. How can latitude and longitude be used to find locations on Earth? How can a magnetic compass
Lab #3 Map Projections.
 Lab #3 Map Projections http://visual.merriam-webster.com/images/earth/geography/cartography/map-projections.jpg Map Projections Projection: a systematic arrangement of parallels and meridians on a plane
MAP STUDY: INTERPRETATION OF SURVEY MAPS
 MAP STUDY: INTERPRETATION OF SURVEY MAPS Types and Elements of Maps Maps are drawn to represent the Earth on a piece of paper. Maps are used widely to represent the Earth. Maps use signs and symbols in
Using Maps. Using Maps. Using Maps. Using Maps
 A is a visual representation, or model, of part or all of the earth. lines are imaginary lines that run east to west around the globe; they are also known as parallels. They show distances in degrees north
Wayne E. Sirmon GEO 301 World Regional Geography
 Wayne E. Sirmon GEO 301 Geography 301 Geography 301 MAP: A graphic representation of a portion of the earth s surface dawn to scale, as seen from above. Types of Maps Climate maps give general information
EXTRA CREDIT Extra Credit Atlas Exercise for Exam I is available on the course home page
 EXTRA CREDIT Extra Credit Atlas Exercise for Exam I is available on the course home page. Submit answers to me using the blue Scantron sheet by Feb. 19, 2019. Once you have completed the exercise, transfer
Welcome to Lesson 4. It is important for a GIS analyst to have a thorough understanding of map projections and coordinate systems.
 Welcome to Lesson 4. It is important for a GIS analyst to have a thorough understanding of map projections and coordinate systems. A GIS without coordinates would simply be a database like Microsoft Excel
Making Maps With GIS. Making Maps With GIS
 Making Maps With GIS Getting Started with GIS Chapter 7 Making Maps With GIS 7.1 The Parts of a Map 7.2 Choosing a Map Type 7.3 Designing the Map 1 What is a map? Map is the communication tool for the
Physical Geography Lab Activity #15
 Physical Geography Lab Activity #15 Due date Name Choropleth Maps COR Objective 1 & 7, SLOs 1 & 3 15.1. Introduction Up until this point we have used maps to find locations on the Earth. While they are
MAP PROJECTIONS but before let s review some basic concepts.
 MAP PROJECTIONS but before let s review some basic concepts. Types of Maps General Purpose Topographic Thematic/Choropleth Dot Graduated Circle Isometric/Isolines Isopleth Mental Maps Scale Small-scale
Overview. GIS Terminology
 Overview GIS Terminology MFworks Terminology Overview This is a glossary of geography and MFworks terminology and concepts that may not be familiar to novice MFworks users and non-geographers. The explanations
Cartography and Geovisualization. Chapters 12 and 13 of your textbook
 Cartography and Geovisualization Chapters 12 and 13 of your textbook Why cartography? Maps are the principle means of displaying spatial data Exploration: visualization, leading to conceptualization of
Coordinate Systems and Map James Frew ESM 263 Winter
 Coordinate Systems and Map Projec@ons 1 Outline Introduc@on La@tude and longitude Projec@ons and coordinate systems Placenames Postal addresses and postal codes Linear referencing systems Cadasters Conver@ng
Georeferencing. Geography is the key to linking attributes. Georeferencing is the key to geography.
 Georeferencing Geography is the key to linking attributes. Georeferencing is the key to geography. Why georeferencing? Many reasons for having georeferences Many different approaches to georeferencing
What is a Map Projection?
 What is a Map Projection? It is how we represent a three dimensional Earth on a flat piece of paper However The process of transferring information from the Earth to a map causes every projection to distort
Unit 1 All. Study online at quizlet.com/_3l51hr
 Unit 1 All Study online at quizlet.com/_3l51hr 1. geography: 4. 7 APHG Units+: The study of the distribution and interaction of physical and human features on the earth 2. physical geography: 1. Geography:
EUROPEAN COMPUTER DRIVING LICENCE. GIS Cartography. Syllabus
 EUROPEAN COMPUTER DRIVING LICENCE GIS Cartography Syllabus Purpose This document details the syllabus for ECDL GIS Module 1 Cartography. The syllabus describes, through learning outcomes, the knowledge
Plane coordinates ~~~~~~~~~~
 Coordinate Systems & Map Projections Geographic coordinates A Basic Introduction to Coordinate Systems & Map Projections Latitude & longitude Angles Parallels & meridians Lines Plane coordinates ~~~~~~~~~~
Queries of Agricultural Areas Falling into Cadastral Parcels and Organizing and Analyzing Them with Python Programming Language
 Queries of Agricultural Areas Falling into Cadastral Parcels and Organizing and Analyzing Them with Python Programming Language Ekrem SARALIOGLU, Deniz YILDIRIM and Oguz GUNGOR Keywords: Geographic Information
EnvSci360 Computer and Analytical Cartography
 EnvSci360 Computer and Analytical Cartography Lecture 3 Geodesy Map Projections, Datums, and Coordinate Systems 1 Geodesy The science of measuring and representing the shape and size of the earth, and
When the Earth Was Flat. Measurements were made using a plumb bob, a spirit level, and a stick. Also, the Stars.
 ABSTRACT Defining the shape of the Earth geoid. Mathematical models spheroid or ellipsoid Mathematical projection of geodetic systems GIS/GPS technology The need for a unified projection systems World
Mapping coordinate systems
 Mapping coordinate systems 1. The Earth's Graticule Latitude and Longitude The graticule is the imaginary grid of lines running east-west (lines of latitude = parallels) and north-south lines of longitude
GIS & Spatial Analysis in MCH
 GIS & Spatial Analysis in MCH Russell S. Kirby, University of Alabama at Birmingham rkirby@uab.edu, office 205-934-2985 Dianne Enright, North Carolina State Center for Health Statistics dianne.enright@ncmail.net
FIND PLACES ON GLOBES USING LATITUDE
 GLOBES, MAPS & GRAPHS FIND PLACES ON GLOBES USING LATITUDE AND LONGITUDE LINES FIND PLACES ON MAPS USING A GRID SYSTEM NAME SEVERAL TYPES OF MAP PROJECTIONS AND EXPLAIN THEIR BENEFITS AND SHORTCOMINGS
Planet Classification Schemes Temperature Rings Presence of life Size Composition Moons Distance from Sun Length of day
 Solar noon on Winter Solstice in Fairbanks, Alaska (64º 50 N). Solar angle is 2 ; day length, 3.7 hours (sunrise 11:00, set 2:42). Planet Classification Schemes Temperature Rings Presence of life Size
EXTRA CREDIT. 6 Geographers Tools. Maps and their Parts MAP MAKING QUANDRY MAP MAKING
 EXTRA CREDIT Extra Credit Atlas Exercise for Exam I is available on the course home page. Submit answers to me using the blue Scantron sheet by Feb. 19, 2019. Once you have completed the exercise, transfer
EXTRA CREDIT. 6 Geographers Tools. Maps and their Parts MAP MAKING QUANDRY MAP MAKING 2/15/19 MAP PROJECTIONS MAP PROJECTIONS
 EXTRA CREDIT Extra Credit Atlas Exercise for Exam I is available on the course home page. Submit answers to me using the blue Scantron sheet by Feb. 19, 2019. Once you have completed the exercise, transfer
GED 554 IT & GIS. Lecture 6 Exercise 5. May 10, 2013
 GED 554 IT & GIS Lecture 6 Exercise 5 May 10, 2013 Free GIS data sources ******************* Mapping numerical data & Symbolization ******************* Exercise: Making maps for presentation GIS DATA SOFTWARE
First Exam: New Date. 6 Geographers Tools. Maps and their Parts 2/16/2018 MAP MAKING MAP PROJECTIONS MAP PROJECTIONS MAP MAKING QUANDRY
 First Exam: ew ate Friday, March 2, 2018. ombination of multiple choice questions and map interpretation. ring a #2 pencil with eraser. ased on class lectures supplementing chapter 1. Review lecture slides.
Pool Canvas. Add. Creation Settings. Chapter 1--Objectives and Tools of World Regional Geography. Description Instructions.
 1 of 6 TEST BANK > CONTROL PANEL > POOL MANAGER > POOL CANVAS Pool Canvas Add, modify, and remove questions. Select a question type from the Add Question drop-down list and click Go to add questions. Use
Susan Cutter et al. Aug, 2002, The Professional Geographer, 54(3): David Tenenbaum GEOG 070 UNC-CH Spring 2005
: David Tenenbaum GEOG 070 UNC-CH Spring 2005") What is Geography? Geography is not just about city and country names Geography is not just about population and growth Geography is not just about rivers and mountains Geography is a broad field that
What is Geography? Geography is not just about city and country names Geography is not just about population and growth Geography is not just about rivers and mountains Geography is a broad field that
Map Reading: Grades 4 & 5
 Map Reading: Grades 4 & 5 Grades: 4,5 Team Size: 1-2 competitors Duration: 25 minutes Supervisors: Sriram Garapati, Rebecca Neill-Totsuka Summary Description Students will solve a mystery using different
Workbook Exercises for Statistical Problem Solving in Geography
 Workbook Exercises for Statistical Problem Solving in Geography Arthur J. Lembo, Jr. This workbook is for use with the popular textbook Introduction to Statistical Problem Solving in Geography, and includes
APC PART I WORKSHOP MAPPING AND CARTOGRAPHY
 APC PART I WORKSHOP MAPPING AND CARTOGRAPHY 5 June 2015 MAPPING The act or process of making a map. A matching process where the points of one set are matched against the points of another set. Graphical
GPS Remote Sensing. GIS Photogrammetry. GEODESY Equipment (total station) CARTOGRAPHY Survey Software. Map Projection Coordinate Systems
 CARTOGRAPHY Survey Software. Map Projection Coordinate Systems") GPS Remote Sensing GIS Photogrammetry GEODESY Equipment (total station) CARTOGRAPHY Survey Software Map Projection Coordinate Systems 1 Coordinate Systems, Datum and Map Projection Dr. Maher A. El-Hallaq
GPS Remote Sensing GIS Photogrammetry GEODESY Equipment (total station) CARTOGRAPHY Survey Software Map Projection Coordinate Systems 1 Coordinate Systems, Datum and Map Projection Dr. Maher A. El-Hallaq
Spatial Reference Systems. Introduction
 Spatial Reference Systems Wolfgang Kainz Professor of Cartography and Geoinformation Department of Geography and Regional Research University of Vienna wolfgang.kainz@univie.ac.at Introduction Historic
Summary thematic point techniques
 Summary thematic point techniques Dot maps Graduated symbols Bar linear (1D) proportional symbol Circle 2D proportional symbol (and other shapes) Range graded symbols classed by size Segmented symbols
Lecture 10-14: Map Projections and Coordinate System
 URP 1281 Surveying and Cartography Lecture 10-14: Map Projections and Coordinate System December 27, 2015 Course Teacher: Md. Esraz-Ul-Zannat Assistant Professor Department of Urban and Regional Planning