3301 Rickenbacker Causeway, Miami, FL 33149
|
|
|
- Joan Griffith
- 5 years ago
- Views:
Transcription


1 Virginia Key and Miami Beach 2016 King Tide Report and Projections (to 2045) using: 3301 Rickenbacker Causeway, Miami, FL *THIS REPORT IS PROVIDED SUBJECT TO THE COASTAL RISK CONSULTING, LLC, PRINTED DISCLAIMERS AND TERMS WHICH ARE ATTACHED TO THIS STUDY AND WHICH ARE POSTED AT THIS ANALYSIS IS FURNISHED AS IS FOR THE PERSONAL USE OF THE CONSUMER AS OF THE DATE PROVIDED, IS APPLICABLE ONLY FOR THE ADDRESS OR ADDRESSES PROVIDED BY THE CONSUMER AND IS NOT TRANSFERABLE OR ASSIGNABLE TO ANY OTHER PERSON OR ENTITY.
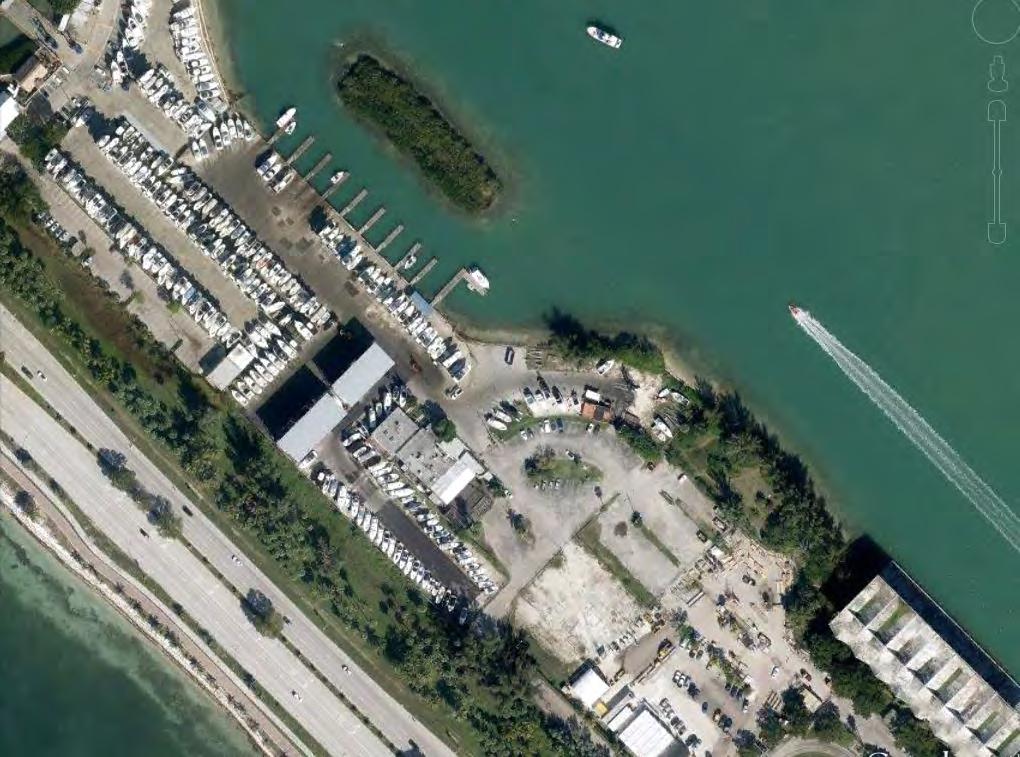
2 Sea Level Solutions Day, which occurred on Sunday, October 16, 2016, was hosted by the Florida International University (FIU) Sea Level Solutions Center (SLSC) in Miami, FL. This event was designed to allow members of the community to participate in flood reporting and broaden their knowledge on climate change and sea level rise. FIU partnered with Vizcaya Museum and Gardens and the Climate Leadership Engagement Opportunities (CLEO) Institute for this event. The team provided citizen science kits to record maximum flood height during peak King Tide. Two representatives from Coastal Risk Consulting, LLC attended this event and participated in the group activities. One member, Renato Stella, was assigned to Miami Beach, while the other member, Alannah Irwin, was assigned to Virginia Key. Citizen scientists were checked in and appointed to different groups. The mission of this project was to increase public awareness of sea level rise and allowed citizens to see first hand the extent of King Tide at their designated location. Each group was given a kit consisting of a yard stick, a tape measurer, and a refractometer used to measure salinity. The groups were taught how to use the tools and then dispersed into their designated areas. Renato led a group of citizen scientists assigned to Michigan Ave and 11 th Street in Miami Beach. Between 9:30 AM EDT and 11:00 AM EDT, the group collected and analyzed multiple water samples, looking at water height and salinity content every 15 minutes. Major impacts of King Tide were not experienced at Michigan Ave and 11 th Street during the observation period. Based on historical records of flooding in this particular area, the observations did not seem correct. How was this possible? Looking for a reason behind this occurrence, Renato s group wandered a block north from their starting point at Michigan Ave and 11 th Street. They found 2.5 inches (0.21 ft) of standing water with salinity measures at 1 parts per thousand (ppt). A few blocks away at the next reference point, the water level was about the same, but the salinity was much higher at 20.5 ppt. These results are still surprising, but there is an explanation. Before answering these questions, it is important to analyze the other part of Sea Level Solutions Day., Alannah, the other CRC representative, was assigned to the Virginia Key group. Her group was given a few reference points, but given the limited time frame, they were only able to take measurements at the Marine Stadium and surrounding areas, with post-peak measurements at Hobie Island. The highest point of the King Tide occurred at 9:47 AM EDT and these data were captured at the marina between the Marine Stadium and the Atlantica Seafood Restaurant and Market on the Rickenbacker Causeway. Before the peak of King Tide (9:20 AM EDT), water measurements were found to be 19 inches (1.58 ft). This was demonstrated as flooding along the marina. The image on the next page, taken by Alannah, shows the flooding along the northern side of the marina adjacent to Atlantica Seafood Restaurant and Market. A marina patron approached her group and discussed the severity of the flooding. He explained that normally, the white poles (located at the bottom of the picture) are never submerged. He further explained that patrons will usually walk beyond the poles to remove or place their boats in the water. This narrative illustrated the degree of the flooding and the seriousness of adaptation. At the peak of King Tide, at 9:47 AM EDT, the flooding at the poles was measured to be 20 inches (1.67 ft). The distance from the poles to the edge of the boat ramp measured to be 36.5 feet. albertslap@coastalriskconsulting.com 7951 Southwest 6th Street, Suite 112, Plantation, FL Coastal Risk Consulting LLC 2


3 Salinity of 20.5 ppt at the pump station Observed flooding along the white poles at the norther section of the Rickenbacker Marina on Virginia Key, adjacent to the Marine Stadium. Picture was taken by the CRC Representative, Alannah Irwin, standing at the shoreline 36.5 feet away from the pole. 3
 at the Alden Hotel, between 29th Street and 30th Street. Peak King Tide heights were forecast to be 1-2 inches higher than normal.")

4 Separately, CRC had another employee, Mark Rochelo, recording independent observations of peak King Tide along Miami Beach. Mark was located on Highway A1A (Indian Creek Drive) at the Alden Hotel, between 29th Street and 30th Street. Peak King Tide heights were forecast to be 1-2 inches higher than normal. On average, a peak high tide on Miami Beach will be between 2.8 feet and 3.5 feet. The picture on the left shows the forecast effects of King Tide flooding in 2016, 2030, and The risk of tidal flooding with increased sea level rise is important to note, especially in a high risk area such as Miami Beach. This portion of Miami Beach near the Alden Hotel is located in the AE flood zone, meaning that it is a higher risk area within the 100-year floodplain. The picture on the right, taken by Mark, shows the actual flooding from King Tide There was no tidal flooding during this event. The property, which is located along Indian Creek, would normally experience tidal flooding, especially with the 1-2 foot anticipated increase during peak King Tide at 9:30 AM EDT on Sunday, October 16, Some water on the steps was present due to the rain event that had occurred prior to peak King Tide. albertslap@coastalriskconsulting.com 7951 Southwest 6th Street, Suite 112, Plantation, FL Coastal Risk Consulting LLC 4

.")
5 The results found by Renato and Mark are almost identical. This is because, prior to the King Tide, Miami Beach implemented a series of portable water pumps to prepare for the flooding event. Renato discovered one of these pumps at Meridian Ave and 11 th Street and in this location, there was no significant flooding present. Mark found the exact same thing on A1A along the leading edge of Indian Creek (see page 13 for locations). These adaptive measures are what prevented a potentially costly disaster from manifesting in Miami Beach. These pumps not only kept water out of the streets, but it saved hundreds of thousands of dollars in property damage that could have resulted from the onset of peak King Tide flooding. Measures like this are what can help coastal communities become resilient and sustainable in a future with higher sea levels. albertslap@coastalriskconsulting.com 7951 Southwest 6th Street, Suite 112, Plantation, FL Coastal Risk Consulting LLC 5

6 To demonstrate the severity of the flooding that could have been at Miami Beach, the results at the Rickenbacker Marina will be used as a proxy. The flooding at this location is representative of the flooding that can occur at Miami Beach if proper adaptive measures are not taken. The marina is located on the southwest side of the island and was the closest of the two Virginia Key reference points to Miami Beach. The environment of the marina is similar to the interior coastline of Miami Beach, which allows for favorable representation. At King Tide 2016, the maximum height was measured to be 1.67 feet above normal. In a future climate with higher sea levels, this extent can go above and beyond the elevation of the terrain in this area. Using the U.S. Army Corps of Engineers (USACE) sea level projections, future King Tides will be modeled in this report to express the impact of future event flooding. In 2020, when taking into consideration the USACE projected sea level rise, the highest extent of the King Tide will be 1.93 feet. In 2035, this number will be 2.29 feet. In 2045, this will be 2.73 feet. This further expresses the need to take the proper adaptive measures to prepare for future flooding events. A sample FIRST Score has been attached to this document to display the risk of non-storm flooding in the Rickenbacker Marina. This will be used to support the risk of future sea level rise in Miami Beach. albertslap@coastalriskconsulting.com 7951 Southwest 6th Street, Suite 112, Plantation, FL Coastal Risk Consulting LLC 6
7 3301 Rickenbacker Causeway, Miami, FL

 floodplain management regulations must be enforced This property is located in evacuation zone A and is at risk of significant hurricane storm surge")
8 3301 Rickenbacker Causeway, Miami, FL Government Risk Categories Assessment THIS PROPERTY IS WITHIN THE FOLLOWING GOVERNMENT- DESIGNATED RISK ZONES: Flood Zone: AE Evacuation Zone: A ZONE X500 ZONE AE ZONE D ZONE C ZONE B ZONE X ZONE VE ZONE E ZONE A This property is located inside of the 100-year FEMA floodplain Predicted flood water elevations have been established Special Flood Hazard Area (SFHA): YES The entire property is located in a SFHA. National Flood Insurance Program s (NFIP s) floodplain management regulations must be enforced This property is located in evacuation zone A and is at risk of significant hurricane storm surge flooding in the event of a Category 1 hurricane or higher. Max Hurricane Storm Surge Heights 2016 and 2030 Hurricane Wind Speed (mph) 2016 (ft.) 2030 (ft.) Category Category Category The Property s Base Flood Elevation (BFE) 9 Feet above NAVD88 *These property-specific risk categories are further explained on pages
 high sea level rise projection (footnote) and other local factors.")
9 Flood Inundation Risk Score and Table (FIRST SCORE ) The FIRST Score is the TOTAL number of tidal flood days over a 30-year period as projected using modeling based on the US Army Corps of Engineers (USACE) high sea level rise projection (footnote) and other local factors. This property has a maximum total of 2289 tidal flood days over 30 years 3301 Rickenbacker Causeway, Key Biscayne, FL FIRST Score 2289 Date Range # Tidal Flood Days Risk Meter CUMULATIVE FIRST SCORE = 2289 The FIRST Score is broken down into six 5-year increments. Each increment indicates the number of tidal flood days the property will experience during that time period. For example, over the years 2036 to 2040 there will be 566 days of tidal flooding. The risk meter begins at orange, indicating a moderate to high risk of non-storm flooding from present to With the effects of rising sea levels, the flood risk gradually rises to a severe risk of flooding between 2026 and By 2045, the property will experience up to 246 days of tidal flooding. This will also increase the impacts of the King Tide flooding events yearly, with the maximum extent of the flooding height measuring at 2.7 feet in The USACE high projection for sea level rise is lower than high projections from National Oceanic and Atmospheric Administration (NOAA), the US Third National Climate Assessment, Intergovernmental Panel on Climate Change (IPCC), and other projections in the peer reviewed literature. See references on p. 10 for local sea level rise rates out to
10 Risk Meter Key # Tidal Flood Days Recommendation 151 and up Major adaptation* adjustments are recommended Take adaptation* actions Plan preventative measures to minimize flooding impact 0-15 little or no adaptation* *Adaptation Planning and preparation for future time horizons to prevent or reduce the impacts of flooding due to higher sea levels. Adaptation actions may include: Accommodation - Strategies which prevent flood damage through measures such as vertical elevation (raising) of structures or stormwater system improvements. Protection - Strategies including hard and soft structurally defensive measures such as beach nourishment, planting mangroves, and building seawalls. # OF TIDAL FLOODING DAYS PER YEAR Number of Tidal Flooding Days per Year: *Non-storm flooding* The number of days of tidal flooding remains the same each year, as shown in the graph. 10

11 11
12 3301 Rickenbacker Causeway, Miami, FL Conclusions This region will experience increases in King Tide flooding with future sea level rise. The 2016 King Tide height extended to 1.67 feet above normal. The visual representation can be found on page 3 in the bottom center image. The picture was taken during the flood event at ground level by CRC representative Alannah Irwin. Using the 2016 value of the King Tide height at Rickenbacker Marina, future heights were modeled using sea level rise projections. In 2025, the King Tide height is expected to reach 1.93 feet, while it is expected to reach 2.29 feet and 2.73 feet in 2035 and 2045, respectively. By 2045, King Tide is expected to inundate the majority of the marina and adjacent low-lying areas, negatively impacting all regions of Biscayne Bay. The average elevation of the property at the marina is 2.9 feet above the North American Vertical Datum of 1988 (NAVD88, The range of land elevation within the property boundary varies from 0 to 6.4 feet NAVD88. The elevation data was based off of Florida Department of Emergency Management LiDAR data from Miami Beach has begun taking the proper adaptation measures to prepare for King Tide flooding. For this event, the city implemented portable pumps to keep water levels from reaching the heights found at Virginia Key. King Tide water heights from Meridian Ave and 11 th Street were measured to be 0.21 feet (page 3) due to the use of pumps in the area. The map on page 13 shows the location of the pumps along Indian Creek where the most significant flooding could have occurred. After this, Miami Beach is working to implement a permanent pump system which will greatly improve their ability to adapt and prepare for future sea level rise. The FIRST Score is a snapshot of flood risk. For a more detailed study, see the Coastal Risk Rapid Assessment. This comprehensive report provides an assessment of tidal/sea level rise, hurricane storm surge and heavy rainfall flooding with high-resolution maps indicating where, how deep, and when the flooding will occur. For further information, please contact us at (844) SEA-RISE ( ) or by at customerservice@coastalriskconsulting.com. 12

13 Location of Indian Creek Pumps during King Tide
14 REFERENCES The figure below illustrates a range of future local projections for sea-level rise (SLR), going to 2100 based on U.S. Army Corps of Engineers (USACE) estimates. These local rates apply the nearest tide gauge to the property which is considered for USACE relative SLR projections, located at Miami Beach, FL. The table on the right reflects the correlating SLR ranges in feet, from intermediate to high out to ( Year Sea-level Rise in ft ft ft ft ft ft The future rates of sea level rise may be higher than the USACE model predicts, and, therefore, the number of days of tidal flooding could be greater. CRC reserves the right to make adjustments to the flood likelihood estimates from time to time as it deems scientifically appropriate. 14
15 DEFINITIONS Evacuation Zone: Hurricane evacuation zones are areas of the city that may be inundated by storm surge or isolated by storm surge waters. Special Flood Hazard Area (SFHA): The land area covered by the floodwaters of the base flood is the Special Flood Hazard Area (SFHA) on NFIP maps. The SFHA is the area where the National Flood Insurance Program's (NFIP's) floodplain management regulations must be enforced and the area where the mandatory purchase of flood insurance applies. Storm Surge Zones: Hurricane storm surge zones are determined by the National Hurricane Center using ground elevation and the area s vulnerability to storm surge from a hurricane. Evacuation zones are based on hurricane storm surge zones. Flood Zone: AE PROPERTY SPECIFIC DEFINITIONS Zone AE is subject to flooding due to nearby bodies of water (lakes, rivers, canals etc.). Properties in this zone have a 1% chance of annual flooding therefore are part of the 100-year floodplain. Properties in zone AE are considered to be at high risk of flooding under the National Flood Insurance Program, therefore, flood insurance is required for all properties in this zone that have federally-backed mortgages. Areas in Zone AE have predicted water elevations above land for a 100-year storm event, known as the Base Flood Elevation (BFE). Construction in these areas must meet local floodplain zoning ordinance requirements, including evidence that the structures are above the BFE. Flood insurance rates in high-risk areas (Zone AE) are calculated based on a variety of factors, including elevation and building construction. Policies can be purchased for contents only, building only, or both contents and building coverage. Talk to a licensed insurance agent to determine the premium for your specific property. For more information on flood insurance policies visit this page. Evacuation Zone: A Please visit this page for further reference on evacuation zones. Special Flood Hazard Area (SFHA): YES, this property is in a SFHA What is a Special Flood Hazard Area (SFHA)? Land areas that are at high risk for flooding are called Special Flood Hazard Areas (SFHAs), or floodplains. These areas are indicated on Flood Insurance Rate Maps (FIRMs). In high-risk areas, there is at least a 1 in 4 chance of flooding during a 30-year mortgage. Please visit this page for more detailed information on SFHAs. 15
Draft for Discussion 11/11/2016
 Coastal Risk Consulting (CRC) Climate Vulnerability Assessment for Village of Key Biscayne Deliverable 1.1 in Statement of Work. Preliminary Vulnerability Assessment Identifying Flood Hotspots Introduction...
Sea level rise Web GIS Applications
 Florida International University FIU Digital Commons GIS Center GIS Center 2018 Sea level rise Web GIS Applications Zhaohui Fu GIS-RS Center, Florida International University, Fujen@fiu.edu Sheyla Santana
Florida Flood Risks. Heavy Rainfall. Groundwater. Tidal Flooding. Storm Surge. King Tides. Runoff/Riverine
 Florida Flood Risks Heavy Rainfall Storm Surge Groundwater Tidal Flooding Runoff/Riverine King Tides Sawgrass Mills Mall Sunrise, Florida 15 of rain in 3 days, with most in 24 hours. Mall closed for 3
Sea-Level Rise Impacts on South Florida
 Sea-Level Rise Impacts on South Florida Keren Prize Bolter, PhD Science Director, Coastal Risk Consulting. LLC 5/3/16 FAQ list What is happening? What impacts are we already seeing? Just how vulnerable
Randall W. Parkinson, Ph.D., P.G. Institute of Water and Environment Florida International University
 An Update on Adaptation Action Activities Undertaken Since Completion of the City of Satellite Beach (FL) Vulnerability Assessment to Rising Seas (2010) Randall W. Parkinson, Ph.D., P.G. Institute of Water
Application #: TEXT
 TOWN OF FORT MYERS BEACH 2008 PROPOSED COMPREHENSIVE PLAN AMENDMENTS Application #: 2008-13-TEXT Description: Modify the Coastal Management and Future Land Use Elements to reflect the state s new definition
Miami-Dade County Technical Update Meeting South Florida Coastal Study. May 11, 2016
 Miami-Dade County Technical Update Meeting South Florida Coastal Study May 11, 2016 Welcome and Introductions FEMA Region IV Christina Lindemer Technical Lead Production and Technical Services (PTS) Contractor
Background and Purpose of Meeting. River Towers Meeting. Flood Risk Management Study Alternatives Overview
 1 and Purpose of Meeting River Towers Meeting Flood Risk Management Study Alternatives Overview September 23, 2014 There is no "proposed" flood risk management solution for this area at this time Fairfax
Turn and Face the Strange: Economic Impacts of Climate Change Sea Level Rise and Coastal Flooding E2Tech Forum June 21, 2018
 Turn and Face the Strange: Economic Impacts of Climate Change Sea Level Rise and Coastal Flooding E2Tech Forum June 21, 2018 Peter A. Slovinsky, Marine Geologist Maine Geological Survey Image from Chebeague.org
Sea Level Rise in Miami-Dade County Florida Implications for Management of Coastal Wetlands and the Everglades
 Sea Level Rise in Miami-Dade County Florida Implications for Management of Coastal Wetlands and the Everglades Peter W. Harlem Dr. John F. Meeder Florida International University Southeast Environmental
Ed Curtis, PE, CFM, FEMA Region IX and Darryl Hatheway, CFM, AECOM ASFPM 2016, Grand Rapids, MI
 Methodology to Determine Process-Based Total Water Level Profiles in Areas Dominated by Wave Runup Ed Curtis, PE, CFM, FEMA Region IX and Darryl Hatheway, CFM, AECOM ASFPM 2016, Grand Rapids, MI Thurs.
Hurricane Matthew. Life Threatening Flash Flooding Likely. National Weather Service Wilmington NC. Josh Weiss, Meteorologist
 Hurricane Matthew Life Threatening Flash Flooding Likely Threat Assessment for northeast South Carolina & southeast North Carolina National Weather Service Wilmington NC 630 PM EDT Friday October 7, 2016
Preliminary Vulnerability Assessment of Coastal Flooding Threats - Taylor County, Florida
 Preliminary Vulnerability Assessment of Coastal Flooding Threats - Taylor County, Florida North Central Florida Regional Planning Council Northeast Florida Regional Council April 28, 2016 BACKGROUND This
Coastal Flood Risk Study Project for East Coast Central Florida Study Area
 Coastal Flood Risk Study Project for East Coast Central Florida Study Area St Lucie County, Florida Flood Risk Review Meeting March 28, 2017 Introductions Risk MAP Project Team FEMA Region IV BakerAECOM,
Sea Level Rise Study Summary Town of South Bethany
 Sea Level Rise Study Summary Town of South Bethany This presentation was prepared by Anchor QEA for the Town of South Bethany using Federal Funds under award NA14 NOS 419 0123 from the Delaware Coastal
5.2. IDENTIFICATION OF NATURAL HAZARDS OF CONCERN
 5.2. IDENTIFICATION OF NATURAL HAZARDS OF CONCERN To provide a strong foundation for mitigation strategies considered in Sections 6 and 9, County considered a full range of natural hazards that could impact
Rising Sea Levels: Time for Proactive Action in Florida and the Caribbean?
 Rising Sea Levels: Time for Proactive Action in Florida and the Caribbean? Dr. Alan Fyall and Dr. Thomas Wahl National Center for Integrated Coastal Research, University of Central Florida Dr. Roberta
HURRICANE SANDY LIMITED REEVALUATION REPORT UNION BEACH, NEW JERSEY DRAFT ENGINEERING APPENDIX SUB APPENDIX C SEA LEVEL RISE ANALYSIS
 HURRICANE SANDY LIMITED REEVALUATION REPORT UNION BEACH, NEW JERSEY DRAFT ENGINEERING APPENDIX SUB APPENDIX C SEA LEVEL RISE ANALYSIS Rev. 18 Feb 2015 1.0 Introduction 1.1 Guidance The Department of the
Hurricane Matthew Threats and Impacts Briefing for Eastern NC
 Hurricane Matthew Threats and Impacts Briefing for Eastern NC October 6 th, 2016 Date/Time Created: 10/6/2016, Noon EDT National Weather Service Newport/Morehead City, NC Hurricane Matthew Key Points Changes
Location: Jacksonville, FL December 11, 2012
 Technical Update Meeting Northeast Florida Surge Study Location: Jacksonville, FL December 11, 2012 Agenda 2:00 2:15 Welcome/Introductions Tucker Mahoney, FEMA Region IV Michael DelCharco, BakerAECOM 2:15
Adaptation to Sea Level Rise A Regional Approach
 Adaptation to Sea Level Rise A Regional Approach Project Partners: in Saco Bay, ME Peter Slovinsky, Marine Geologist Maine Geological Survey, Department of Conservation Project Funding from: Saco Bay Hazards
Mapping of Future Coastal Hazards. for Southern California. January 7th, David Revell, Ph.D. E.
 Mapping of Future Coastal Hazards for Southern California January 7th, 2014 David Revell, Ph.D. drevell@esassoc.com E. Vandebroek, 2012 Outline Coastal erosion hazard zones Flood hazard zones: Coastal
Sea Level Rise and Hurricane Florence storm surge research methodology
 Sea Level Rise and Hurricane Florence storm surge research methodology Hurricane Florence storm surge analysis was conducted using a variety of input sources. In order to determine the maximum storm surge
Miami-Dade County Overview
 Miami-Dade County Overview 2,000 square miles World s busiest cruise port 2.6 million residents Second busiest US airport for international travelers Gateway to the Caribbean and Latin America Natural
Hurricane Matthew Life Threatening Flash Flooding Likely
 Hurricane Matthew Life Threatening Flash Flooding Likely Threat Assessment for northeast South Carolina & southeast North Carolina National Weather Service Wilmington NC 12 AM EDT Saturday October 8, 2016
sea levels 100 year/ payments. FIGURE 1
 MIAMI DADE COUNTY CLIMATE INDICATORS RAINFALL SUMMARY Much of Miami Dade County is susceptible to localized flooding, particularly during the rainy season of June through October. The County s flat terrain
Very Dangerous Coastal Storm Sandy October 28 th 31 st 2012
 Very Dangerous Coastal Storm Sandy October 28 th 31 st 2012 Prepared 600 PM EDT Monday October 29, 2012 Gary Szatkowski NOAA s NJ Forecast Office Weather.gov/phi Purpose of Briefing Briefing #11 for event
COMMUNITY EMERGENCY RESPONSE TEAM FLOODS INTRODUCTION
 INTRODUCTION Floods are one of the most common hazards in the United States. A flood occurs any time a body of water rises to cover what is usually dry land. Flood effects can be local, impacting a neighborhood
SECTION 13: SEA LEVEL RISE ADAPTATION
 Appropriate quote here. SECTION 13: SEA LEVEL RISE ADAPTATION 1. Statement of State and Local Goals. A. State Goals: There are currently no State goals related to sea level rise. B. Local Goals: 1. TBD
Coastal Flood Risk Study Project for Northeast Florida Study Area
 Coastal Flood Risk Study Project for Northeast Florida Study Area Duval County, Florida Flood Risk Review Meeting September 22, 2015 Introductions Risk MAP Project Team FEMA Region IV BakerAECOM, FEMA
Climate Adaptation Challenges for Boston s Water and Sewer Systems
 National Association of Flood & Stormwater Management Agencies Climate Adaptation Challenges for Boston s Water and Sewer Systems John P Sullivan P.E. October 15,2014 Boston 1630 Boston 1630-2012 Boston
Appendix C Fluvial Flood Hazards
 Appendix C Fluvial Flood Hazards Sea Level Rise Vulnerability Assessment and Adaptation Project March 2019 Contents Contents... i Figures... i Tables... i Definitions, Acronyms, & Abbreviations... ii
Coastal Emergency Risks Assessment - CERA Real-Time Storm Surge and Wave Visualization Tool
 Coastal Emergency Risks Assessment - CERA Real-Time Storm Surge and Wave Visualization Tool Introduction This document provides guidance for using the Coastal Emergency Risks Assessment (CERA) visualization
Hurricane Irma Page 1 HURRTRAK RM/Pro 2017 Summary Report for Tampa, FL 09/10/ EDT, Adv. # 46
 Hurricane Irma Page 1 Description of impact to Tampa, FL, Tampa, FL, is expected to receive a major impact from Hurricane Irma. The forecast maximum wind for this location has increased since the last
Hurricane Irma Page 1 HURRTRAK RM/Pro 2017 Summary Report for Tampa, FL 09/09/ EDT, Adv. # 43
 Hurricane Irma Page 1 Description of impact to Tampa, FL, Tampa, FL, is expected to receive a major impact from Hurricane Irma. The forecast maximum wind for this location has decreased since the last
Active Weather Threat Halloween Week Nor easter October 28 th 31 st 2012
 Active Weather Threat Halloween Week Nor easter October 28 th 31 st 2012 Prepared 1130 AM EDT Wednesday, October 24, 2012 Gary Szatkowski NOAA s NJ Forecast Office Weather.gov/phi Purpose of Briefing Briefing
Planning for Annapolis Sea Level Rise and Future Extreme Water Levels
 Planning for Annapolis Sea Level Rise and Future Extreme Water Levels U.S. Naval Academy Sea Level Rise Advisory Council 31 October 2017 CAPT Emil Petruncio, USN (Ret.), PhD Associate Professor Gina Henderson
Crystal Goodison & Alexis Thomas University of Florida GeoPlan Center
 Crystal Goodison & Alexis Thomas University of Florida GeoPlan Center A1A Fort Lauderdale, Hurricane Sandy, October 2012 Photo Credits: Susan Stocker, Sun Sentinel FAU s Research Report (completed Jan
NOAA s National Weather Service Philadelphia/Mt. Holly NJ
 Next Briefing Package: Friday, October 2, 2015 no later than 300 PM Hazards and Impacts: Overview: A dangerous weather pattern still threatens our region. Threats include very heavy rainfall, inland river
CLIMATE READY BOSTON. Climate Projections Consensus ADAPTED FROM THE BOSTON RESEARCH ADVISORY GROUP REPORT MAY 2016
 CLIMATE READY BOSTON Sasaki Steering Committee Meeting, March 28 nd, 2016 Climate Projections Consensus ADAPTED FROM THE BOSTON RESEARCH ADVISORY GROUP REPORT MAY 2016 WHAT S IN STORE FOR BOSTON S CLIMATE?
LOMR SUBMITTAL LOWER NESTUCCA RIVER TILLAMOOK COUNTY, OREGON
 LOMR SUBMITTAL LOWER NESTUCCA RIVER TILLAMOOK COUNTY, OREGON Prepared for: TILLAMOOK COUNTY DEPARTMENT OF COMMUNITY DEVELOPMENT 1510-B THIRD STREET TILLAMOOK, OR 97141 Prepared by: 10300 SW GREENBURG ROAD,
Storm Surge Analysis Update Meeting Cross City, Florida June 17, 2014
 Big Bend Coastal Storm Surge Study Storm Surge Analysis Update Meeting Cross City, Florida June 17, 2014 Introductions Risk MAP Project Team FEMA Region IV Florida Division of Emergency Management (FDEM)
TRB First International Conference on Surface Transportation Resilience
 TRB First International Conference on Surface Transportation Resilience Applying the Sea-Level Scenario Sketch Planning Tool to Enhance the Resilience of Long-Range Transportation Plans: Lessons Learned
Town of Old Orchard Beach: A summary of sea level rise science, storm surge, and some highlighted results from SLAWG work efforts
 Town of Old Orchard Beach: A summary of sea level rise science, storm surge, and some highlighted results from SLAWG work efforts October 15, 2013 Peter A. Slovinsky, Marine Geologist Maine Geological
Monitoring Hurricane Rita Inland Storm Surge
 Monitoring Hurricane Rita Inland Storm Surge By Benton D. McGee, Roland W. Tollett, and Burl B. Goree Pressure transducers (sensors) are accurate, reliable, and cost-effective tools to measure and record
A More Comprehensive Vulnerability Assessment: Flood Damage in Virginia Beach
 A More Comprehensive Vulnerability Assessment: Flood Damage in Virginia Beach By Raj Shah GIS in Water Resources Fall 2017 Introduction One of the most obvious effects of flooding events is death. Humans
US Army Corps of Engineers BUILDING STRONG
 Greater New Orleans Hurricane and Storm Damage Risk Reduction System Robert Rowlette Senior Senior Program Manager Task Force Hope U.S. Army Corps of Engineers April 19, 2012 US Army Corps of Engineers
Tropical Update. 12 PM EDT Friday, October 7, 2016 Hurricane Matthew & Tropical Storm Nicole
 Tropical Update 12 PM EDT Friday, October 7, 2016 Hurricane Matthew & Tropical Storm Nicole This update is intended for government and emergency response officials, and is provided for informational and
COASTAL DATA APPLICATION
 2015 Coastal GeoTools Proactive By Design. Our Company Commitment COASTAL DATA APPLICATION Projecting Future Coastal Flood Risk for Massachusetts Bay Bin Wang, Tianyi Liu, Daniel Stapleton & Michael Mobile
NOAA s National Weather Service Philadelphia/Mt. Holly NJ
 Next Briefing Package: Thursday, October 1, 2015 no later than 300 PM Hazards and Impacts: Overview: A dangerous weather pattern is developing for our region. Threats include very heavy rainfall, inland
Geospatial application in Kiribati
 Geospatial application in Kiribati ICC-21 ST RESAP (9 TH TO 13 TH OCTOBER, 2017) BANGKOK, THAILAND Outline Kiribati Profile Natural disasters in Kiribati Achievements Challenges/Issues Ways forward 1 Kiribati
Tropical Storm Harvey: SE Texas Impacts
 Tropical Storm Harvey: SE Texas Impacts 10 AM CDT UPDATE Thursday, August 24, 2017 Prepared by: Dan Reilly, Brian Kyle PLEASE MUTE YOUR LINES AND DON T PUT ON HOLD! Situation Overview Tropical Storm Harvey
South Florida Storm Surge
 South Florida Storm Surge Highest storm tide Everglades City/Chokoloskee in area closest to landfall Nevertheless, storm tide as high as 6 feet along Biscayne Bay about 90 miles from eye of Irma! Closer
2016 NC Coastal Local Governments Annual Meeting
 6 NC Coastal Local Governments Annual Meeting NCFMP Coastal Map Maintenance Flood Study Updates and Changes April, 6 Tom Langan, PE, CFM Engineering Supervisor NCEM-Risk Management - Floodplain Mapping
Storm Induced Coastal Erosion for Flood Insurance Studies and Forecasting Coastal Flood Damage Impacts: Erosion, Runup & Overtopping
 Storm Induced Coastal Erosion for Flood Insurance Studies and Forecasting Coastal Flood Damage Impacts: Erosion, Runup & Overtopping Jeff Gangai- Dewberry Tucker Mahoney FEMA HQ Introduction Background
North Atlantic Coast Comprehensive Study (NACCS) APPENDIX A: ENGINEERING
 APPENDIX A: ENGINEERING") North Atlantic Coast Comprehensive Study (NACCS) APPENDIX A: ENGINEERING NORTH ATLANTIC COAST COMPREHENSIVE STUDY: RESILIENT ADAPTATION TO INCREASING RISK Appendix A - Engineering Table of Contents North
North Atlantic Coast Comprehensive Study (NACCS) APPENDIX A: ENGINEERING NORTH ATLANTIC COAST COMPREHENSIVE STUDY: RESILIENT ADAPTATION TO INCREASING RISK Appendix A - Engineering Table of Contents North
The Coastal Change Analysis Program and the Land Cover Atlas. Rebecca Love NOAA Office for Coastal Management
 The Coastal Change Analysis Program and the Land Cover Atlas Rebecca Love NOAA Office for Coastal Management Natural Infrastructure = Greater Resilience NOAA C-CAP Regional Land Cover and Change coast.noaa.gov/digitalcoast/data/ccapregional
From Vulnerability to Resilience And the Tools to Get There. Out of Harm s Way Partnership for the Delaware Estuary August 1, 2012
 From Vulnerability to Resilience And the Tools to Get There Out of Harm s Way Partnership for the Delaware Estuary August 1, 2012 Today s Presentation Tour of New Jersey Challenges Definitions so we re
Flood and Sea Level Rise Mapping Methodologies: The Way Forward
 Flood and Sea Level Rise Mapping Methodologies: The Way Forward Malcolm L. Spaulding Professor Emeritus, Ocean Engineering University of Rhode Island spaulding@egr.uri.edu Interagency Coordination Meeting
Major Hurricane Matthew Briefing Situation Overview
 Major Hurricane Matthew Briefing Situation Overview At 5 p.m. Tuesday, Category 4 Hurricane Matthew was about 860 miles South-Southeast of Mayport, Florida, moving north around 10 mph. Maximum sustained
Major Hurricane Matthew Briefing Situation Overview
 Major Hurricane Matthew Briefing Situation Overview THIS IS NOW A WORST CASE STORM SURGE SCENARIO Catastrophic Damage is Anticipated for Coastal Areas. Major Hurricane Matthew is still expected to move
Peter A. Slovinsky, Marine Geologist Maine Geological Survey Department of Agriculture, Conserva=on and Forestry. Funding from:
 Peter A. Slovinsky, Marine Geologist Maine Geological Survey Department of Agriculture, Conserva=on and Forestry Funding from: 50% 40% Figure modified from Griggs, 2001 10% Global Sea Level Rise Driving
Tropical Update. 5 AM EDT Tuesday, September 12, 2017 Post-Tropical Cyclone Irma, Hurricane Jose, & Tropical Wave (10%)
") Tropical Update 5 AM EDT Tuesday, September 12, 2017 Post-Tropical Cyclone Irma, Hurricane Jose, & Tropical Wave (10%) This update is intended for government and emergency response officials, and is provided
Tropical Update 5 AM EDT Tuesday, September 12, 2017 Post-Tropical Cyclone Irma, Hurricane Jose, & Tropical Wave (10%) This update is intended for government and emergency response officials, and is provided
UPPER COSUMNES RIVER FLOOD MAPPING
 UPPER COSUMNES RIVER FLOOD MAPPING DRAFT BASIC DATA NARRATIVE FLOOD INSURANCE STUDY SACRAMENTO COUTY, CALIFORNIA Community No. 060262 November 2008 Prepared By: CIVIL ENGINEERING SOLUTIONS, INC. 1325 Howe
Risk Assessment and Mitigation. Hurricane Checklist
 Risk Assessment and Mitigation Hurricane Checklist Hurricane Checklist Hurricanes are severe tropical storms with sustained winds of at least 74 miles per hour. Hurricane winds can reach 160 miles per
IDENTIFICATION OF HAZARDS OF CONCERN
 IDENTIFICATION OF HAZARDS OF CONCERN To provide a strong foundation for mitigation strategies considered in Section 6, the Village considered a full range of hazards that could impact the area and then
Hurricane Sandy October 28 th 31 st 2012
 Hurricane Sandy October 28 th 31 st 2012 Prepared 530 PM EDT Saturday October 27, 2012 Gary Szatkowski NOAA s NJ Forecast Office Weather.gov/phi Purpose of Briefing Briefing #7 for event Promote situational
2017 Hurricane Season and Beyond
 2017 Hurricane Season and Beyond Ken Graham National Hurricane Center Building a Weather-Ready Nation Much of U.S. Coast Saw Tropical Wind Watches or Warnings 2017 Hurricane Season Facts and Figures 7th
Ground Water Protection Council 2017 Annual Forum Boston, Massachusetts. Ben Binder (303)
") Ground Water Protection Council 2017 Annual Forum Boston, Massachusetts Protecting Groundwater Sources from Flood Borne Contamination Ben Binder (303) 860-0600 Digital Design Group, Inc. The Problem Houston
Ground Water Protection Council 2017 Annual Forum Boston, Massachusetts Protecting Groundwater Sources from Flood Borne Contamination Ben Binder (303) 860-0600 Digital Design Group, Inc. The Problem Houston
Storm Surge Analysis Update Meeting Charlotte and DeSoto Counties, Florida March 7, 2018
 Southwest Florida Coastal Storm Surge Study Storm Surge Analysis Update Meeting Charlotte and DeSoto Counties, Florida March 7, 2018 Agenda Introductions Goals for Today SWFL Coastal Surge Study Study
Comprehensive Plan Town of Bowdoinham Sea Level Rise and Climate Change Adaptation Goals and Strategies Draft 3 Prepared February 4, 2014
 INVENTORY AND ANALYSIS: SEA LEVEL RISE AND CLIMATE CHANGE Introduction Sea level is rising according to one hundred years of records from the Portland, ME tide gauge. Along with this change, storms are
Flooding Performance Indicator Summary. Performance indicator: Flooding impacts on riparian property for Lake Ontario and the Upper St.
 Flooding Performance Indicator Summary Performance indicator: Flooding impacts on riparian property for Lake Ontario and the Upper St. Lawrence River Technical Workgroup: Coastal TWG Research by: Baird
Greater New Orleans Hurricane and Storm Damage Risk Reduction System 101
 Greater New Orleans Hurricane and Storm Damage Risk Reduction System 101 René Poché New Orleans District U.S. Army Corps of Engineers US Army Corps of Engineers BUILDING STRONG 1878 Gentilly Ridge Metairie
Appendix E Guidance for Shallow Flooding Analyses and Mapping
 Appendix E Guidance for Shallow Flooding Analyses and Mapping E.1 Introduction Different types of shallow flooding commonly occur throughout the United States. Types of flows that result in shallow flooding
Tropical Update. 5 PM EDT Thursday, September 7, 2017 Hurricane Irma, Hurricane Jose, and Hurricane Katia
 Tropical Update 5 PM EDT Thursday, September 7, 2017 Hurricane Irma, Hurricane Jose, and Hurricane Katia This update is intended for government and emergency response officials, and is provided for informational
Floods. Floods COMMUNITY EMERGENCY RESPONSE TEAM FLOODS CONTENT INSTRUCTOR GUIDANCE
 Floods Floods Introduce this topic by explaining that floods are one of the most common hazards in the United States. A flood occurs any time a body of water rises to cover what is usually dry land. Display
LOMR SUBMITTAL LOWER NEHALEM RIVER TILLAMOOK COUNTY, OREGON
 LOMR SUBMITTAL LOWER NEHALEM RIVER TILLAMOOK COUNTY, OREGON Prepared for: TILLAMOOK COUNTY DEPARTMENT OF COMMUNITY DEVELOPMENT 1510-B THIRD STREET TILLAMOOK, OR 97141 Prepared by: 10300 SW GREENBURG ROAD,
The Costs of Doing Nothing: Economic Consequences of Not Adapting to Sea Level Rise in the Hampton Roads Region. Photo courtesy of VIMS
 The Costs of Doing Nothing: Economic Consequences of Not Adapting to Sea Level Rise in the Hampton Roads Region Photo courtesy of VIMS Costs of Doing Nothing: Economic Consequences of Not Adapting to Sea
What is a King Tide? How frequently do King Tides happen?
 2 Contents What is a King Tide?... 3 What Can You Do?... 3 King Tide Kit... 6 King Tide Dates & Times 2017... 6 Tidal Flooding Locations... 8 How to Report Data... 8 Steps to Document Flooding:... 11 Using
2008 Hurricane Caravan. Daniel Noah Meteorologist National Weather Service x1 May 22, 2008
 2008 Hurricane Caravan Daniel Noah Meteorologist National Weather Service daniel.noah@noaa.gov, 813-645-2323 x1 May 22, 2008 National Weather Service We never close! Open 24 hours a day 365 days per year
Building Marina Resilience to Storms Wisconsin Marine Association Conference November 2-3, 2016
 Julia Noordyk NOAA Great Lakes Coastal Storms Program Outreach Coordinator UW Sea Grant @NoordCoast Building Marina Resilience to Storms Wisconsin Marine Association Conference November 2-3, 2016 July
RSMC-Miami Update Daniel Brown Warning Coordination Meteorologist
 RSMC-Miami Update 2016 Daniel Brown Warning Coordination Meteorologist L-0324 Emergency Management Hurricane Preparedness Training Course Funding provided by FEMA s National Hurricane Program - partnership
Estimation of Wave Heights during Extreme Events in Lake St. Clair
 Abstract Estimation of Wave Heights during Extreme Events in Lake St. Clair T. J. Hesser and R. E. Jensen Lake St. Clair is the smallest lake in the Great Lakes system, with a maximum depth of about 6
Hurricanes, Sea Level Rise, and South Florida s Challenging Future
 Hurricanes, Sea Level Rise, and South Florida s Challenging Future Brian McNoldy Senior Research Associate University of Miami Tropical Weather Expert Washington Post Scientific Advisor Coastal Risk Consulting
October 17, 2018 Sea level rise observed since 1970 responsible for 43% of homes impacted by Hurricane Irma s storm surge
 October 17, 2018 Sea level rise observed since responsible for 43% of homes impacted by s storm surge (NEW YORK, N.Y.) Data scientists from the non-profit First Street Foundation in collaboration with
Hurricane Matthew. National Weather Service Wilmington NC. Steven Pfaff, WCM.
 Hurricane Matthew Threat Assessment for northeast South Carolina & southeast North Carolina National Weather Service Wilmington NC 730 AM EDT Tuesday October 4, 2016 Steven Pfaff, WCM Steven.Pfaff@noaa.gov
SLOSH New Orleans Basin 2012 Update
 SLOSH New Orleans Basin 2012 Update Michael Koziara Science and Operations Officer National Weather Service Slidell, LA The Basics What is storm surge? What is SLOSH? Details Assumptions Inundation = Storm
Community Discovery Data Questionnaire
 Region III Community Discovery Data Questionnaire Thank you for taking the time to complete this questionnaire. It will provide important information to help FEMA understand flood risk issues in the Conococheague-Opequon
Local Flood Hazards. Click here for Real-time River Information
 Local Flood Hazards Floods of the White River and Killbuck Creek are caused by runoff from general, and/or intense rainfall. Other areas of flooding concern are from the Boland Ditch and Pittsford Ditch.
1 foot of Sea Level Rise
 1 foot of Sea Level Rise Schools Fire Stations $+ Law Enforcement u Hospitals 1ft SLR 0 0.25 0.55 1.1 Miles $+ Year 20 Population: the 2013 study A Geological Perspective U.S. Mid-Atlantic Coast a probable
Between 6 am to 4 pm the next day approximately 7.5 inches fell. Chesapeake Bay Bridge Tunnel NOAA Tide Gage
 Ocean Park Alternative Drainage Route Analysis February, 2012 November 11 14, 2009 Between 6 am to 4 pm the next day approximately 7.5 inches fell Chesapeake Bay Bridge Tunnel NOAA Tide Gage Hurricane
RE: Inadequacy of December 2017 Draft Supplemental Environmental Assessment Review of Recent Storm Events and Flooding
 December 29, 2017 U.S. Corps of Engineers Jacksonville District ATTN: Paul Stodola 701 San Marco Boulevard Jacksonville, Florida 32207-8175 TO: FROM: Paul Stodola U.S. Corps of Engineers Jacksonville District
How to Read These Flood Hazard Maps
 How to Read These Flood Hazard Maps The United States Geological Survey (USGS) has developed the Coastal Storms Modeling System (CoSMoS), which projects coastal flooding and erosion from coastal storms,
Weather briefing Strong Coastal Nor easter November 7 th -8 th, 2012
 Weather briefing Strong Coastal Nor easter November 7 th -8 th, 2012 Prepared 1215 PM EDT Wednesday November 7, 2012 Gary Szatkowski NOAA s NJ Forecast Office http://www.erh.noaa.gov/phi/ Purpose of Briefing
Improving global coastal inundation forecasting WMO Panel, UR2014, London, 2 July 2014
 Improving global coastal inundation forecasting WMO Panel, UR2014, London, 2 July 2014 Cyclone Sidr, November 2007 Hurricane Katrina, 2005 Prof. Kevin Horsburgh Head of marine physics, UK National Oceanography
Hurricane Harvey: SE Texas Impacts. 10 PM CDT UPDATE Friday, August 25, 2017 Prepared by: Lance Wood
 Hurricane Harvey: SE Texas Impacts 10 PM CDT UPDATE Friday, August 25, 2017 Prepared by: Lance Wood Latest Observations Hurricane Harvey making landfall this evening near Rockport as a category 4 hurricane.
5/25/2017. What is projected for Coastal texas? PROTECTING CRITICAL WATER INFRASTRUCTURE FROM SEA LEVEL RISE
 PROTECTING CRITICAL WATER INFRASTRUCTURE FROM SEA LEVEL RISE What is projected for Coastal texas? Mean Sea Level has risen 3 18 to 37 above Mean Sea Level 1800-1992 1992-2015 2030 2060 2100 Mean Sea Level
Doug Kluck NOAA Kansas City, MO National Center for Environmental Information (NCEI) National Integrated Drought Information System (NIDIS)
 National Integrated Drought Information System (NIDIS)") National Integrated Drought Information System (NIDIS) for the Missouri River Basin Drought Early Warning Information System (DEWS) & Runoff Trends in the Missouri Basin & Latest Flood Outlook Doug Kluck
National Integrated Drought Information System (NIDIS) for the Missouri River Basin Drought Early Warning Information System (DEWS) & Runoff Trends in the Missouri Basin & Latest Flood Outlook Doug Kluck
Table 1. August average temperatures and departures from normal ( F) for selected cities.
 for selected cities.") Climate Summary for Florida August 2016 Prepared by Lydia Stefanova and David Zierden Florida Climate Center, The Florida State University, Tallahassee, Florida Online at: http://climatecenter.fsu.edu/products-services/summaries
Climate Summary for Florida August 2016 Prepared by Lydia Stefanova and David Zierden Florida Climate Center, The Florida State University, Tallahassee, Florida Online at: http://climatecenter.fsu.edu/products-services/summaries
Vulnerability Assessment of Coastal Flooding Threats St. Joseph Bay to Apalachee Bay Coastline - Draft
 Vulnerability Assessment of Coastal Flooding Threats St. Joseph Bay to Apalachee Bay Coastline - Draft INTRODUCTION Located on the Gulf coast of Florida, the Apalachee Bay Region includes four coastal