Unusual cloud. An Investigation.
|
|
|
- Ann Green
- 5 years ago
- Views:
Transcription
1 Unusual cloud. An Investigation. 19 th October Bernard Burton. Wokingham. Index. List of Figures. Page 2 and 3. Figures 1 to 14 Pages 4 to 17 Introduction Page 18 The Height of the Startiform Cloud Page 18 The Field of Convective Elements Page 19 The 0600 GMT Larkhill Ascent Page 20 Conclusion Page 21
2 2) Unusual Cloud an Investigation List of Figures. Figure October ~0840 GMT. Wokingham, looking east. Eastern edge of the stratiform cloud band. Figure October 2018 ~0840 GMT. Wokingham, looking south-southeast. Eastern edge of the stratiform cloud band. Figure October ~0842 GMT. Wokingham, looking nearly vertically. View of stratiform cloud band showing an area of virga beneath a poorly formed fall-streak hole. Figure October ~0845 GMT Wokingham, loking west. Western edge of the stratiform cloud band with high level convection beyond. Figure October ~0853 GMT. Wokingham, looking north-northwest showing the convective region with a mixture of virga and convection embedded in stratiform cloud patches. Also 2 isolated cenvective elements. Figure October ~0854 GMT. Wokingham, looking west. Mixture of convection embedded in stratiform cloud patches and virga. Figure October ~0855 GMT. Wokingham, looking southeast. Showing the departing eastern edge of the stratiform cloud band. A fringe of virga highlighted by the sun can be seen below the cloud edge. Figure October GMT. MSG4 satellite image received at Wokingham. This false colour image is a combination of visible and IR channels. The bluer the colour, the colder the cloud top. Figure October SkewT diagrams of Larkhill ascents for 0600 and 0900 GMT. Courtesy the University of Wyoming. Figure October Plot of RH against geopotential for the 0600 and 0900 GMT Larkhill ascents. Figure October Plot of Theta and ThetaE for the Larkhill ascents at 0600 GMT (upper) and 0900 GMT (lower) Figure October Copy of Chilbolton Observatory lidar returns (upper) and 35 GHz radar returns (lower).
3 3) Figure October Larkhill 0900 GMT ascent. Plot of ThetaW (left hand axis), Lapse rate and RH (right hand axis) Lapse rate has been normalized so that the dry rate is Zero, the isothermal rate is -0.98, and the saturated lapse rate is the curve between at 4000m, and at 8000 m. Figure October Changes in the levels of isentropic surfaces over Larkhill between 0600 and 0900 GMT.
4
5
6
7
8
9
10


11
12
13
14

15
16
17
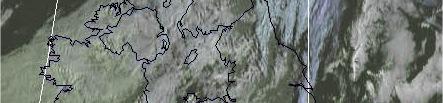
18 18) Unusual Cloud an Investigation B. J. Burton. Wokingham. Introduction. As I was making my 0900 GMT observation from my home in Wokingham, Berkshire, on the 19 th October 2018, an area of cloud was present overhead, with a distinct edge to the east. The whole cloud sheet was moving eastwards. My initial impression was that it may have been high stratocumulus or low altocumulus. The cloud sheet seemed to be stratiform with distinct elements, some quite large. Figures 1 to 7 show a series of photographs of the cloud and surrounding sky taken between 0840 and 0855 GMT from my rooftop in Wokingham. On more careful perusal of the cloud, I noticed that it was producing virga in places, evident in Fig 7 as a fringe below the retreating edge of the sheet, also in Fig 3, taken looking nearly vertical, which seems to be a partially filled fall-streak hole with virga appearing as a grey patch obscuring the stratiform cloud elements. To the west of the cloud sheet there were a number of convective elements producing virga, in the form of cirrus castellanus and floccus, seen in Figures 4 to 6. To assist in this investigation, sources of data in addition to the visual evidence, were sought. Lidar data from the instrument at Reading University, located 7km west of my house, was available, as was that from the lidar and 35 GHz instruments at Chilbolton, 60km to the west-southwest of Wokingham. Fortuitously, there was also a radiosonde ascent for Larkhill, 73 km west-southwest of Wokingham, nominal time 0900 GMT. Finally, using my weather satellite receiver, I have access to a continuous stream of image data from the Meteosat MSG4 geostationary satellite. A MSG4 image for 0900 GMT combining the visible and IR channels and showing the south of England is shown in Fig 8. The ascent for Larkhill at 0900 GMT is shown plotted on a skew-t diagram, together with another ascent made at 0600 GMT, these are shown in Fig 9. Figure 10 shows the detailed structure of relative humidity recorded on the 0600 and 0900 GMT Larkhill ascents, plotted against geopotential. Plots of Theta and ThetaE and ThetaW from the Larkhill ascents are shown in Fig11 and 13. The data from Chilbolton lidar and 35 GHz radar are shown in Fig 12. The 3 hour change in isentropic levels between the 0600 and 0900 GMT Larkhill ascent is shown in Fig 14. The Height of the Stratiform Cloud As stated in the introduction, initial impressions could have put the stratiform cloud sheet in the high Sc/low Ac level. However, noting that the 0 C level was near ft, and that virga was associated with the cloud, the probable height for the cloud base would have been well above this. Turning to the data for the Reading University lidar, at the time of the photographs, returns were being detected for heights between 5.7 km and 7.4 km altitude (above station level, ~60 m ASL). So the stratiform cloud could not have been below 5.7 km, ft, but could have been as high as 7.4 km or higher (the Reading lidar upper limit is near 7.5 km), that is ft or higher. Looking at the satellite image, Fig 8, the stratiform sheet is part of a band, with a curved leading (easterly) edge, as can also be seen in Fig 7. The portion of the cloud field over Wokingham is 29 km wide, with convective elements extending 93 km to the west of the band. At the time of the image, 0900 GMT, both Larkhill and Chilbolton were under the field of convective elements seen also in Figs 4 to 6. This should be borne in mind when viewing the ascent data for Larkhill.
19 19) A careful look at the Chilbolton lidar, Fig 12, clearly shows the sequence of stratiform band then convective elements. The first echo appears at 0735 GMT, and the last at 1021 GMT. Noting the sequence of events at Wokingham and the satellite image, the stratiform sheet, which was moving from a generally WNW direction, is clearly preceding the convective elements, and would have been the earliest returns from the Chilbolton lidar, between 0735 and ~0830 GMT, and the base of these span the height interval 7.0 to 7.5 km, to ft, with a temperature between -25 and -30 C. Bearing in mind that some of the lowest returns could be from virga at both Reading and Chilbolton, the stratiform cloud seen in Figs 1 to 3 would fit the evidence best at a height of ~24000 ft. The time of arrival of the cloud band over Chilbolton and over Wokingham differed by 1.2 hours. This equates to a rate of advection of 13.8 m/sec appx., and the winds measured by the 0600 and 0900 GMT ascents for Larkhill near the 7.5 km level were and 12 m/sec respectively, supportive evidence for the altitude of the cloud being at this level. The Field of Convective Elements. Figs 4 and 6, looking to the west, and 5 looking to the NW, clearly show the convective nature of the regime immediately to the west of the stratiform band. It was this region that the Larkhill 0900z ascent would have sampled. The height of the cloud on the Chilbolton lidar data lies entirely between 6.1 and 8.0 km, to ft. It is fair to assume that most if not all the returns from the lower levels were from virga, much of which can be, from Figs 5 and 6, seen to be dense and copious. Very rough measurements on the cloud photographs, assuming the cloud tops are near 8.0 km, gives the base of the virga near 5.5 km., in approximate agreement with the lowest returns from the Reading University lidar of 5.7 km. The isolated convective element near the centre of Fig 5 is particularly interesting as it could be observed to be actively developing out of a clear sky. There is another similar element nearer the right-hand edge of the line of castellanus in the same figure, that was also growing visibly. It is possible from the 0900 Larkhill ascent, Fig 13, that these isolated elements could have developed below the main convective region, as a thin convective layer existed between 5100 and 5600 m. The base of this layer is characterised by a dry lapse rate overlain by a decrease in thetaw, indicating potential instability. Although the RH at the top of the dry lapse rate is below 75%, it is possible that spatial and temporal changes in the RH regime at this level could have produced saturation and the dry but potentially unstable layer near 5500 m could have led to the isolated convective elements seen in Fig 5. Vertical wind shear was examined to look for low RI stable regions capable of supporting billow clouds, but wind speeds are modest, and there are not any layers with strong shear. However, of interest, though it is above the probable level of the cloud, the shear vector rotates from 264 deg at 7000 m to 187 deg at 7500 m to 315 deg at 7800m. The returns from the 35 GHz radar span the height interval 6.0 to 7.9 km, and the time interval 0815 to 0909 GMT, whereas the lidar echoes span the time interval 0735 to 1021 GMT. Assuming the cloud motion was constant and that the width of the stratiform band was 29km when it passed over Chilbolton, the band would have passed over in appx 40 minutes, between 0735 and 0815 GMT. As the first 35 GHz return is near 0815, it seems that it was only picking up the densest elements in the convective regime. It may be that the radar performance was sub-optimal on this occasion, as under normal circumstances I would have expected it to have shown much more of the cloud seen by the lidar. It is evident from the ascent diagrams, Fig 9 and 10, that there is a moist layer >80 % RH wrt water from 5620 m to 6800 m altitude on the 0900 GMT Larkhill ascent. The corresponding temperature range is -17 to -24 C, and it is within this layer that the convection was being initiated.
20 20) What is interesting about the 0900 ascent is that the layer where the stratiform cloud existed, as seen on the Chilbolton lidar near 7.5 km, has become, by 0900 GMT over Larkhill, very dry, ~10% RH. Fig 13 shows a plot of Lapse Rate, Theta W and RH against geopotential. The layer of interest lies between 6180 and 7400 m. At the base of this layer, thetaw, which had been increasing with height, now begins to fall. This marks the base of a potentially unstable layer wherein, should condensation occur will lead to convective ascent until a level is reached where the value of thetaw equates to that at the base, namely 7400 m. Convective cells on reaching this level will experience stable surroundings and will decelerate. However, when cells reach ~6800, the RH starts to fall from its high values, dropping below 60% at 7000m, and by 7400 m is only around 10%. Thus any convective cloud would soon mix with the dry surroundings, with evaporation of the existing cloud particles reducing its buoyancy. Looking now at the Lapse Rate profile, Fig 13, we see that from 6400 to near 6900m, it is close to the dry rate, and this layer can be considered as being conditionally unstable. It almost certainly is within this layer that convection would be initiated. Cloud would form easily in the moist but stable environment from 5800 to 6400 m, 95% RH wrt water at 5900m, especially if orographic waves were present. The humidity profile below 6200m, Fig 10 (lower) is moist to around 5600m, and evaporating virga would have contributed to this moisture. Once the layer near 6200 m became saturated, convection would ensue, potentially reaching 7400 m. The images, Figs 4 and 5, might suggest that orographic forcing could have produced the elongated castellanus features containing these features. The 0600 GMT Larkhill ascent. The profiles of the 0600 GMT Larkhill ascent, Figs 10 (upper) and 11 (upper) are, perhaps surprisingly, very different from the 0900 GMT ones, Figs 10 (lower) and 11 (lower). The changes in the moisture profile is especially marked, with the moist layers between 5000 m and 7000 m on the 0900 ascent replacing an extremely dry regime, containing a minimum RH of 3% at 5500m and a maximum of 16 % at 6900 m, on the 0600 GMT ascent. Also, the moist layer above 8400 m on the 0600 GMT ascent has been replaced by very dry air, RH <10 % by 0900 GMT. The satellite image, Fig 8, shows that the band of stratiform upper level cloud extends over the Humber to the North Sea, but terminates in the south close to the Isle of Wight. The history of this cloud band, from the overnight IR satellite images, shows it to be the remnants of a a broader band of upper cloud over the Irish Sea at 19/0000 GMT, this band being part of a frontal system extending northwards over Faeroe and eastern Greenland in the circulation of a low west of Iceland. South of 60N this frontal system showed 'split front' characteristics, the lower cloud band extending southwards past the west of Ireland, and crossing 50N near 18W, linking to a frontal wave near 51N 35W. 3 hourly Water Vapour imagery reveals a complex pattern over southern UK. An upper trough at midnight on the 19 th lay over the area but contained two well developed mesoscale vortices., 'A' and 'B'. 'A' lay over the coast of Norfolk and 'B' over the central Welsh Border. By 0900 GMT 'A' had moved across the North Sea to be near the Dutch coast and 'B' lay over the coast of Norfolk. So the air sampled by the 0600 GMT Larkhill ascent was on the western flank of vortex 'B' and just west of the axis of the upper trough. The band of moisture associated with the upper part of the split front can be seen at 0600 GMT lying from North Yorkshire to Devon.
21 21) The upper pattern, then, was very complex, which goes some way to explaining why such large changes occurred over central southern England in the 3 hours between 0600 and 0900 GMT. To attempt to analyse the detail of the upper wind/height contours on the mesoscale is a fruitless task due to the paucity of upper air data, none apart from Larkhill at 0600 GMT, and spacing between routine soundings at 0000 GMT large enough to preclude an analysis on the mesoscale. Some insight into the dynamics associated with this complex set up can be gleaned from the 3 hour changes over Larkhill on the 19 th. From the theta data for the 0600 and 0900 GMT ascents, the change in the height of selected isentropes can be calculated. This has been plotted in Fig 14. Here we see that the layers of interest containing our clouds, from 5000 to 7200 m, underwent very strong positive change, the height of all isentropes increasing between 500 and 700 m. Below these levels, there was a modest decrease in height of isentropes of around 200m between 3000 and 4500 m. Although it is not possible to infer that these changes equate to vertical motions, the presence of the cloud that is the subject of this article, and the humidity structure at 0900 GMT, does indicate that dynamic vertical motion was involved Conclusion. The foregoing examination of the available data on the morning of the 19 th October 2018 over southern England leads to the conclusion that the stratiform cloud seen in Figs 1 to 3 and 7 is indeed much higher than it appears both from the images and from my own visual observation. The most probable height for this cloud was between 7.0 and 7.5 km, and likely to have been near the top of this range, near ft, with a temperature not far above -30 C. The satellite image, Fig 8, shows that the stratiform cloud was part of a band stretching roughly north-south over eastern UK, though the band orientation changed to NE to SW over southern England, and the band ended over the English Channel south of Portland. Satellite image sequence (not shown) shows that this band was associated with the upper part of a split cold front moving east, the lower part being located well to the west. To the west of the band of stratiform cloud there was a field of high level convection, as seen in Figs 4 to 6. The sequence of lidar echoes from the Chilbolton Observatory, located 60 km west-southwest of Wokingham, indicated that the stratiform cloud sheet was at a similar but slightly higher height than the convective elements, approximate mean heights for the echoes being 7.5 km and 6.6 km respectively. The time difference between the first lidar echoes at Chilbolton, and the arrival of the stratiform cloud over Wokingham gives an approximate speed of movement of 13.8 m/s, which agrees with the wind at 7.5 km of 13 m/s (mean of 0900 and 0600 GMT Larkhill ascents). Analysis of the 0900 GMT Larkhill ascent, Fig 13, shows that the layer between 5300 and 5600 m can support convection, but is dry between 5350 and The isolated convective elements seen in Fig 5 could be forming in this layer. The region between 5800 and 6400 m is moist and stable, but the thetaw profile shows that it is potentially unstable between 6200 and 7400 m. The lapse rate is dry or near to it from ~6400 to 6800 m, but the atmosphere dries out markedly above 6800 m. Some layered cloud could be expected between 5800 and 6400 m, which would be expected to convect energetically above 6400m, with isolated tops reaching above 7000 m. This is most probably the cloud seen in Figs 4 to 6 which seems to consist of a mixture of layered and convective cloud and also virga. It should be noted that the RH, shown in Figs 10 and 13, is with respect to water, and that between 5700 and 6200 m, is supersaturated with respect to ice.
22 22) The upper air pattern to the east of the clouds discussed in this article was somewhat unusual and complex. Two marked vortices were detectable on the water vapour imagery, moving east in step with the upper trough associated with the stratiform cloud band, the westernmost vortex being over Norfolk at 0900 GMT. The proximity of this vortex may go some way to explain the very large changes that took place over Larkhill in the 3 hours up to 0900 GMT. Isentropic changes over that period, shown in Fig 14, suggest modest descent between 3000 and 5000 m, maximum 200 m, and ascent between 5000 and 7200 m, averaging ~500 m between 5800 and 7100m. It is no coincidence that this is also the layer where high relative humidity is found on the 0900 GMT Larkhill ascent. B J Burton 29 November 2018
Weather Related Factors of the Adelaide floods ; 7 th to 8 th November 2005
 Weather Related Factors of the Adelaide floods ; th to th November 2005 Extended Abstract Andrew Watson Regional Director Bureau of Meteorology, South Australian Region 1. Antecedent Weather 1.1 Rainfall
Figure 1: Tephigram for radiosonde launched from Bath at 1100 UTC on 15 June 2005 (IOP 1). The CAPE and CIN are shaded dark and light gray,
. The CAPE and CIN are shaded dark and light gray,") Figure 1: Tephigram for radiosonde launched from Bath at 1100 UTC on 1 June 200 (IOP 1). The CAPE and CIN are shaded dark and light gray, respectively; the thin solid line partially bounding these areas
Figure 1: Tephigram for radiosonde launched from Bath at 1100 UTC on 1 June 200 (IOP 1). The CAPE and CIN are shaded dark and light gray, respectively; the thin solid line partially bounding these areas
1. COLD FRONT - CLOUD STRUCTURE IN SATELLITE IMAGES
 1. COLD FRONT - CLOUD STRUCTURE IN SATELLITE IMAGES The satellite image shows a cyclonically curved synoptic scale cloud band usually a few hundred kilometres wide; in the VIS image the cloud band mostly
For the operational forecaster one important precondition for the diagnosis and prediction of
 Initiation of Deep Moist Convection at WV-Boundaries Vienna, Austria For the operational forecaster one important precondition for the diagnosis and prediction of convective activity is the availability
severe VOLUME 5, NUMBER 1, FEBRUARY 1980
 severe VOLUME 5, NUMBER 1, FEBRUARY 1980 TORNADIC THUNDERSTORM DEVELOPMENT IN WEST TEXAS 27 MAY 1978 by Richard E. Peterson Atmospheric Science Group Texas University Lubbock, TX and Alan Johnson National
XC Meteorology. And other bullshit
 XC Meteorology And other bullshit (c) Jim White 2014 Why do Met? Choose whether to turn up Choose best task for day Choose glider configuration Choose pilot configuration! Avoid being in wrong place Achieve
Science Olympiad Meteorology Quiz #1 Page 1 of 7
 1) What is generally true about the stratosphere: a) Has turbulent updrafts and downdrafts. b) Has either a stable or increasing temperature profile with altitude. c) Where the auroras occur. d) Both a)
Mid-Latitude Cyclones and Fronts. Lecture 12 AOS 101
 Mid-Latitude Cyclones and Fronts Lecture 12 AOS 101 Homework 4 COLDEST TEMPS GEOSTROPHIC BALANCE Homework 4 FASTEST WINDS L Consider an air parcel rising through the atmosphere The parcel expands as it
ANSWER KEY. Part I: Synoptic Scale Composite Map. Lab 12 Answer Key. Explorations in Meteorology 54
 ANSWER KEY Part I: Synoptic Scale Composite Map 1. Using Figure 2, locate and highlight, with a black dashed line, the 500-mb trough axis. Also, locate and highlight, with a black zigzag line, the 500-mb
Answers to Clicker Questions
 Answers to Clicker Questions Chapter 1 What component of the atmosphere is most important to weather? A. Nitrogen B. Oxygen C. Carbon dioxide D. Ozone E. Water What location would have the lowest surface
Summary of High Wind Event of 7 March 2004
 Summary of High Wind Event of 7 March 2004 This event was characterized by a very strong jet streak that developed over North Carolina by 00 UTC 8 March, as seen in the Eta model analysis at 300 mb, with
Chapter 6 Clouds. Cloud Development
 Chapter 6 Clouds Chapter overview Processes causing saturation o Cooling, moisturizing, mixing Cloud identification and classification Cloud Observations Fog Why do we care about clouds in the atmosphere?
Isolated severe weather and cold air damming 9 November 2005 By Richard H. Grumm National Weather Service Office State College, PA 16801
 Isolated severe weather and cold air damming 9 November 2005 By Richard H. Grumm National Weather Service Office State College, PA 16801 1. INTRODUCTION Two lines of convection moved over the State of
A Cyclogenesis south of the Alps. Manfred Kurz Neustadt/Weinstraße
 A Cyclogenesis south of the Alps Manfred Kurz Neustadt/Weinstraße A cyclogenesis south of the Alps Surface maps 06-11-99, 00 UTC The occluded frontal system of a quasi-stationary low above the North Sea
Type of storm viewed by Spotter A Ordinary, multi-cell thunderstorm. Type of storm viewed by Spotter B Supecell thunderstorm
 ANSWER KEY Part I: Locating Geographical Features 1. The National Weather Service s Storm Prediction Center (www.spc.noaa.gov) has issued a tornado watch on a warm spring day. The watch covers a large
Clouds. What they tell us about the weather
 Clouds What they tell us about the weather Spring funnel cloud over Willard, Utah 2003 Cloud coverage 581-586 How to show Cloud Coverage On a weather map meteorologists use circles shaded differently to
Condensation: Dew, Fog and Clouds AT350
 Condensation: Dew, Fog and Clouds AT350 T=30 C Water vapor pressure=12mb What is Td? What is the sat. water vapor T=30 C Water vapor pressure=12mb What is Td? What is the sat. water vapor ~12/42~29% POLAR
9 Condensation. Learning Goals. After studying this chapter, students should be able to:
 9 Condensation Learning Goals After studying this chapter, students should be able to: 1. explain the microphysical processes that operate in clouds to influence the formation and growth of cloud droplets
Examination #3 Wednesday, 28 November 2001
 Name & Signature Dr. Droegemeier Student ID Meteorology 1004 Introduction to Meteorology Fall, 2001 Examination #3 Wednesday, 28 November 2001 BEFORE YOU BEGIN!! Please be sure to read each question CAREFULLY
INTERPRETATION GUIDE TO MSG WATER VAPOUR CHANNELS
 INTERPRETATION GUIDE TO MSG WATER VAPOUR CHANNELS C.G. Georgiev1 and P. Santurette2 1 National Institute of Meteorology and Hydrology, Tsarigradsko chaussee 66, 1784 Sofia, Bulgaria 2 Météo-France, 42,
MSG FOR NOWCASTING - EXPERIENCES OVER SOUTHERN AFRICA
 MSG FOR NOWCASTING - EXPERIENCES OVER SOUTHERN AFRICA Estelle de Coning and Marianne König South African Weather Service, Private Bag X097, Pretoria 0001, South Africa EUMETSAT, Am Kavalleriesand 31, D-64295
Weather report 28 November 2017 Campinas/SP
 Weather report 28 November 2017 Campinas/SP Summary: 1) Synoptic analysis and pre-convective environment 2) Verification 1) Synoptic analysis and pre-convective environment: At 1200 UTC 28 November 2017
Observation Homework Due 11/24. Previous Lecture. Midlatitude Cyclones
 Lecture 21 Midlatitude Cyclones Observation Homework Due 11/24 1 2 Midlatitude Cyclones Midlatitude Cyclone or Winter Storm Cyclogenesis Energy Source Life Cycle Air Streams Vertical Structure Storm Hazards
ISSUED BY KENDRIYA VIDYALAYA - DOWNLOADED FROM
 CHAPTER -11 WATER IN THE ATMOSPHERE This chapter deals with Humidity, types of humidity, relative humidity, absolute humidity, specific humidity, dew point, condensation, saturated air, types of precipitation
Summary of November Central U.S. Winter Storm By Christopher Hedge
 Summary of November 12-13 2010 Central U.S. Winter Storm By Christopher Hedge Event Overview The first significant snowfall of the 2010-2011 season affected portions of the plains and upper Mississippi
Mechanical Turbulence Wind forms eddies as it blows around hanger, stands of trees or other obstructions
 Turbulence Low-level Turbulence below 15,000 feet consists of Mechanical Turbulence Convective Turbulence Frontal Turbulence Wake Turbulence Mechanical Turbulence Wind forms eddies as it blows around hanger,
and 24 mm, hPa lapse rates between 3 and 4 K km 1, lifted index values
 3.2 Composite analysis 3.2.1 Pure gradient composites The composite initial NE report in the pure gradient northwest composite (N = 32) occurs where the mean sea level pressure (MSLP) gradient is strongest
Condensation: Dew, Fog, & Clouds. Chapter 5
 Condensation: Dew, Fog, & Clouds Chapter 5 The Formation of Dew & Frost Dew forms on objects near the ground surface when they cool below the dew point temperature. More likely on clear nights due to increased
PRECONVECTIVE SOUNDING ANALYSIS USING IASI AND MSG- SEVIRI
 PRECONVECTIVE SOUNDING ANALYSIS USING IASI AND MSG- SEVIRI Marianne König, Dieter Klaes EUMETSAT, Eumetsat-Allee 1, 64295 Darmstadt, Germany Abstract EUMETSAT operationally generates the Global Instability
A SEVERE WEATHER EVENT IN ROMANIA DUE TO MEDITERRANEAN CYCLONIC ACTIVITY
 A SEVERE WEATHER EVENT IN ROMANIA DUE TO MEDITERRANEAN CYCLONIC ACTIVITY Florinela Georgescu, Gabriela Bancila, Viorica Dima National Meteorological Administration, Bucharest, Romania Abstract Mediterranean
Basic cloud Interpretation using Satellite Imagery
 Basic cloud Interpretation using Satellite Imagery Introduction Recall that images from weather satellites are actually measurements of energy from specified bands within the Electromagnetic (EM) spectrum.
Fronts in November 1998 Storm
 Fronts in November 1998 Storm Much of the significant weather observed in association with extratropical storms tends to be concentrated within narrow bands called frontal zones. Fronts in November 1998
Anthony A. Rockwood Robert A. Maddox
 Anthony A. Rockwood Robert A. Maddox An unusually intense MCS produced large hail and wind damage in northeast Kansas and northern Missouri during the predawn hours of June 7 th, 1982. Takes a look at
Science 1206 Chapter 1 - Inquiring about Weather
 Science 1206 Chapter 1 - Inquiring about Weather 1.1 - The Atmosphere: Energy Transfer and Properties (pp. 10-25) Weather and the Atmosphere weather the physical conditions of the atmosphere at a specific
EAS270, The Atmosphere Mid-term Exam 27 Oct, 2006
 EAS270, The Atmosphere Mid-term Exam 27 Oct, 2006 Professor: J.D. Wilson Time available: 50 mins Value: 20% Instructions: For all 32 multi-choice questions, choose what you consider to be the best (or
Tornadogenesis in Supercells: The Three Main Ingredients. Ted Funk
 Tornadogenesis in Supercells: The Three Main Ingredients Ted Funk NWS Louisville, KY Spring 2002 Environmental Parameters Supercells occur within environments exhibiting several wellknown characteristics
Science Olympiad Meteorology Quiz #2 Page 1 of 8
 1) The prevailing general direction of the jet stream is from west to east in the northern hemisphere: 2) Advection is the vertical movement of an air mass from one location to another: 3) Thunderstorms
Module 11: Meteorology Topic 5 Content: Weather Maps Notes
 Introduction A variety of weather maps are produced by the National Weather Service and National Oceanographic Atmospheric Administration. These maps are used to help meteorologists accurately predict
4/29/2011. Mid-latitude cyclones form along a
 Chapter 10: Cyclones: East of the Rocky Mountain Extratropical Cyclones Environment prior to the development of the Cyclone Initial Development of the Extratropical Cyclone Early Weather Along the Fronts
The Jarrell Tornado of May 27, 1997
 The Jarrell Tornado of May 27, 1997 ANDREW MANKOWSKI University of Wisconsin Madison Atmospheric and Oceanic Sciences ABSTRACT A tornado outbreak occurred over Central Texas on May 27, 1997. This outbreak
NATS 101 Section 13: Lecture 11. Clouds
 NATS 101 Section 13: Lecture 11 Clouds Cloud Classification Luke Howard (English naturalist) developed a system in 1803 that employed Latin words to describe clouds as they appear to a ground observer.
Observations of the depth of ice particle evaporation beneath frontal cloud to improve NWP modelling
 Q. J. R. Meteorol. Soc. (2006), 132, pp. 865 883 doi: 10.1256/qj.04.187 Observations of the depth of ice particle evaporation beneath frontal cloud to improve NWP modelling By RICHARD M. FORBES 1 and ROBIN
1 of 7 Thunderstorm Notes by Paul Sirvatka College of DuPage Meteorology. Thunderstorms
 1 of 7 Thunderstorm Notes by Paul Sirvatka College of DuPage Meteorology Thunderstorms There are three types of thunderstorms: single-cell (or air mass) multicell (cluster or squall line) supercell Although
Tri-Agency Forecast Discussion for August 24, 2010
 Created 1600 UTC August 24, 2010 Tri-Agency Forecast Discussion for August 24, 2010 GRIP Forecast Team: Cerese Inglish, Matt Janiga, Andrew Martin, Dan Halperin, Jon Zawislak, Ellen Ramirez, Amber Reynolds,
Final Examination, MEA 443 Fall 2008, Lackmann
 Place an X here to count it double! Name: Final Examination, MEA 443 Fall 2008, Lackmann If you wish to have the final exam count double and replace your midterm score, place an X in the box above. As
Page 1. Name:
 Name: 1) As the difference between the dewpoint temperature and the air temperature decreases, the probability of precipitation increases remains the same decreases 2) Which statement best explains why
Aviation Hazards: Thunderstorms and Deep Convection
 Aviation Hazards: Thunderstorms and Deep Convection TREND Diagnosis of thunderstorm hazards using imagery Contents Satellite imagery Visible, infrared, water vapour Basic cloud identification Identifying
Comparison of cloud statistics from Meteosat with regional climate model data
 Comparison of cloud statistics from Meteosat with regional climate model data R. Huckle, F. Olesen, G. Schädler Institut für Meteorologie und Klimaforschung, Forschungszentrum Karlsruhe, Germany (roger.huckle@imk.fzk.de
Investigation of the Arizona Severe Weather Event of August 8 th, 1997
 Investigation of the Arizona Severe Weather Event of August 8 th, 1997 Tim Hollfelder May 10 th, 2006 Abstract Synoptic scale forcings were very weak for these thunderstorms on August 7-8, 1997 over the
SEVERE WEATHER AND FRONTS TAKE HOME QUIZ
 1. Most of the hurricanes that affect the east coast of the United States originally form over the A) warm waters of the Atlantic Ocean in summer B) warm land of the southeastern United States in summer
CLOUDS & THUNDERSTORMS
 Funding provided by NOAA Sectoral Applications Research Project CLOUDS & THUNDERSTORMS Basic Climatology Oklahoma Climatological Survey How are clouds made? Clouds form when air is cooled to its dewpoint
Detailed Cloud Motions from Satellite Imagery Taken at Thirty Second One and Three Minute Intervals
 Detailed Cloud Motions from Satellite Imagery Taken at Thirty Second One and Three Minute Intervals James F.W. Purdom NOAA/NESDIS/RAMM Branch CIRA Colorado State University W. Laporte Avenue Fort Collins,
THE SEPTEMBER 24,1987, YUMA PROVING GROUND TORNADO
 Volume 14 Number February, 1989 13 THE SEPTEMBER 24,1987, YUMA PROVNG GROUND TORNADO Paul R. Vukits (1) ASL Yuma Met Team ABSTRACT Numerous reports of a tornado on the Yuma Proving Grounds (YPG), Arizona
Moisture, Clouds, and Precipitation Earth Science, 13e Chapter 17
 Moisture, Clouds, and Precipitation Earth Science, 13e Chapter 17 Stanley C. Hatfield Southwestern Illinois College Changes of state of water, H 2 O Water is the only substance in atmosphere that exists
Talking points for Water Vapor Imagery Analysis for Severe Thunderstorm Forecasting.
 Talking points for Water Vapor Imagery Analysis for Severe Thunderstorm Forecasting. 1. Title. 2. Learning objectives. These are the topics we ll consider during this training session, the goal of the
Weather - is the state of the atmosphere at a specific time & place
 Weather Section 1 Weather - is the state of the atmosphere at a specific time & place Includes such conditions as air pressure, wind, temperature, and moisture in the air The Sun s heat evaporates water
The Planetary Circulation System
 12 The Planetary Circulation System Learning Goals After studying this chapter, students should be able to: 1. describe and account for the global patterns of pressure, wind patterns and ocean currents
The Severe Weather Event of 7 August 2013 By Richard H. Grumm and Bruce Budd National Weather Service State College, PA 1. INTRODUCTION and Overview
 The Severe Weather Event of 7 August 2013 By Richard H. Grumm and Bruce Budd National Weather Service State College, PA 1. INTRODUCTION and Overview A fast moving short-wave (Fig. 1) with -1σ 500 hpa height
MET 3502 Synoptic Meteorology. Lecture 8: September 16, AIRMASSES, FRONTS and FRONTAL ANALYSIS (2)
") MET 3502 Synoptic Meteorology Lecture 8: September 16, 2010 AIRMASSES, FRONTS and FRONTAL ANALYSIS (2) Identifying a cold front on a surface weather map: 1. Surface front is located at the leading edge
MET 3502 Synoptic Meteorology Lecture 8: September 16, 2010 AIRMASSES, FRONTS and FRONTAL ANALYSIS (2) Identifying a cold front on a surface weather map: 1. Surface front is located at the leading edge
1. Which weather map symbol is associated with extremely low air pressure? A) B) C) D) 2. The diagram below represents a weather instrument.
 B) C) D) 2. The diagram below represents a weather instrument.") 1. Which weather map symbol is associated with extremely low air pressure? 2. The diagram below represents a weather instrument. Which weather variable was this instrument designed to measure? A) air pressure
1. Which weather map symbol is associated with extremely low air pressure? 2. The diagram below represents a weather instrument. Which weather variable was this instrument designed to measure? A) air pressure
P4.9 THE SEVERE THUNDERSTORM OUTBREAK IN FINLAND ON 5 JULY 2002
 P4.9 THE SEVERE THUNDERSTORM OUTBREAK IN FINLAND ON 5 JULY 2002 Ari-Juhani Punkka* and Jenni Teittinen Finnish Meteorological Institute, Helsinki, Finland 1. INTRODUCTION On 5 July 2002 a fast propagating
Large-Eddy Simulations of Tropical Convective Systems, the Boundary Layer, and Upper Ocean Coupling
 DISTRIBUTION STATEMENT A. Approved for public release; distribution is unlimited. Large-Eddy Simulations of Tropical Convective Systems, the Boundary Layer, and Upper Ocean Coupling Eric D. Skyllingstad
Mesoscale analysis of a comma cloud observed during FASTEX
 Meteorol. Appl. 7, 129 134 (2000) Mesoscale analysis of a comma cloud observed during FASTEX K D Williams, Joint Centre for Mesoscale Meteorology, Department of Meteorology, University of Reading, PO Box
INTRODUCTION TO METEOROLOGY PART ONE SC 213 MAY 21, 2014 JOHN BUSH
 INTRODUCTION TO METEOROLOGY PART ONE SC 213 MAY 21, 2014 JOHN BUSH WEATHER PATTERNS Extratropical cyclones (low pressure core) and anticyclones (high pressure core) Cold fronts and warm fronts Jet stream
p = ρrt p = ρr d = T( q v ) dp dz = ρg
 dp dz = ρg") Chapter 1: Properties of the Atmosphere What are the major chemical components of the atmosphere? Atmospheric Layers and their major characteristics: Troposphere, Stratosphere Mesosphere, Thermosphere
Chapter 1: Properties of the Atmosphere What are the major chemical components of the atmosphere? Atmospheric Layers and their major characteristics: Troposphere, Stratosphere Mesosphere, Thermosphere
NATS 1750 Lecture. Wednesday 28 th November Pearson Education, Inc.
 NATS 1750 Lecture Wednesday 28 th November 2012 Processes that lift air Orographic lifting Elevated terrains act as barriers Result can be a rainshadow desert Frontal wedging Cool air acts as a barrier
Weather Studies Introduction to Atmospheric Science
 Weather Studies Introduction to Atmospheric Science American Meteorological Society Chapter 1 Monitoring The Weather Credit: This presentation was prepared for AMS by Michael Leach, Professor of Geography
Meteorology Today. 1 Aug st Lt Libby Haynes Capt Kim Mevers
 Meteorology 1950 - Today 1 Aug 2018 1 st Lt Libby Haynes Capt Kim Mevers What is meteorology? Is it important to you? Meteorology is the science of the atmosphere embracing both weather and climate. It
Multiscale Analyses of Inland Tropical Cyclone Midlatitude Jet Interactions: Camille (1969) and Danny (1997)
 and Danny (1997)") Multiscale Analyses of Inland Tropical Cyclone Midlatitude Jet Interactions: Camille (1969) and Danny (1997) Matthew Potter, Lance Bosart, and Daniel Keyser Department of Atmospheric and Environmental
Multiscale Analyses of Inland Tropical Cyclone Midlatitude Jet Interactions: Camille (1969) and Danny (1997) Matthew Potter, Lance Bosart, and Daniel Keyser Department of Atmospheric and Environmental
Solutions to Comprehensive Final Examination Given on Thursday, 13 December 2001
 Name & Signature Dr. Droegemeier Student ID Meteorology 1004 Introduction to Meteorology Fall, 2001 Solutions to Comprehensive Final Examination Given on Thursday, 13 December 2001 BEFORE YOU BEGIN!! Please
Oakfield, WI Tornado of July 18 th, 1996: "Everything in its Right Place"
 Oakfield, WI Tornado of July 18 th, 1996: "Everything in its Right Place" Arian Sarsalari Department of Atmospheric and Oceanic Sciences, University of Wisconsin Madison ABSTRACT This paper will serve
Department of Geosciences San Francisco State University Spring Metr 201 Monteverdi Quiz #5 Key 150 pts.
 Department of Geosciences Name San Francisco State University Spring 2013 Metr 201 Monteverdi Quiz #5 Key 150 pts. 1. Definitions. (5 points each for a total of 20 points in this section). (a) Coriolis
The Ihtiman Flood Event in Bulgaria, Ilian Gospodinov
 The Ihtiman Flood Event in Bulgaria, 04-07.08.2005 Ilian Gospodinov Introduction The Ihtiman flood event in Bulgaria in the beginning of August 2005 provoked an outrage of polemics concerning the weather
Refer to Figure 1 and what you have learned so far in this course when responding to the following:
 Refer to Figure 1 and what you have learned so far in this course when responding to the following: 1.Looking down on a Northern Hemisphere extratropical cyclone, surface winds blow [(clockwise and outward)(counterclockwise
Weather, Air Masses, Fronts and Global Wind Patterns. Meteorology
 Weather, Air Masses, Fronts and Global Wind Patterns Meteorology Weather is what conditions of the atmosphere are over a short period of time. Climate is how the atmosphere "behaves" over long periods
P3.17 THE DEVELOPMENT OF MULTIPLE LOW-LEVEL MESOCYCLONES WITHIN A SUPERCELL. Joshua M. Boustead *1 NOAA/NWS Weather Forecast Office, Topeka, KS
 P3.17 THE DEVELOPMENT OF MULTIPLE LOW-LEVEL MESOCYCLONES WITHIN A SUPERCELL Joshua M. Boustead *1 NOAA/NWS Weather Forecast Office, Topeka, KS Philip N. Schumacher NOAA/NWS Weather Forecaster Office, Sioux
WO2 ROZSA-HRABINSKI METEOROLOGY 1
 WO2 ROZSA-HRABINSKI METEOROLOGY 1 INTRODUCTION What are we covering today? The Atmosphere Clouds Atmospheric Stability Temperature and Humidity THE ATMOSPHERE THE ATMOSPHERE The atmosphere is composed
Charles A. Doswell III, Harold E. Brooks, and Robert A. Maddox
 Charles A. Doswell III, Harold E. Brooks, and Robert A. Maddox Flash floods account for the greatest number of fatalities among convective storm-related events but it still remains difficult to forecast
Weather Systems III: Thunderstorms and Twisters
 Weather Systems III: Thunderstorms and Twisters Review 1. Definition of airmasses? Bergeron classification of air masses 2. Surface weather analysis: Station model, wind speed code, present weather 3.
vis = 74 visibility = vis - 50, for 56 vis 80
 ATSC 201 Fall 2018 Assignment 11 Answer Key Total marks out of 69 Chapter 9: A1h, A7a, A8h, A10all Chapter 12: A1h, A7h, A8h, A11g, E21, E23 Chapter 9 A1h) Find the pressure "reduced to sea level" using
STATION If relative humidity is 60% and saturation vapor pressure is 35 mb, what is the actual vapor pressure?
 STATION 1 Vapor pressure is a measure of relative humidity and saturation vapor pressure. Using this information and the information given in the problem, answer the following question. 1. If relative
Introduction to Skew-T Diagrams
 Introduction to Skew-T Diagrams Have a think about a few things I m going to throw to you it will hopefully make you think a little outside the square! - LIs of -15 can give you clear skies - LIs of 0
a. Air is more dense b. Associated with cold air (more dense than warm air) c. Associated with sinking air
 c. Associated with sinking air") Meteorology 1. Air pressure the weight of air pressing down on Earth 2. Temperature and altitude determine air pressure 3. The more air particles are present, the more air density or pressure exists 4.
Meteorology 1. Air pressure the weight of air pressing down on Earth 2. Temperature and altitude determine air pressure 3. The more air particles are present, the more air density or pressure exists 4.
Meteorology Clouds and Fog. Cloud Classification MTPs: Height. Shape. and. Clouds are classified by:
 Meteorology 5.04 Clouds and Fog References: FTGU pages 124-126, 147 5.04 Clouds and Fog MTPs: Cloud Classification Associated Precipitation Clouds are classified by: Cloud Classification Height Shape and
DEPARTMENT OF GEOSCIENCES SAN FRANCISCO STATE UNIVERSITY. Metr Fall 2012 Test #1 200 pts. Part I. Surface Chart Interpretation.
 DEPARTMENT OF GEOSCIENCES SAN FRANCISCO STATE UNIVERSITY NAME Metr 356.01 Fall 2012 Test #1 200 pts Part I. Surface Chart Interpretation. Figure 1. Surface Chart for 1500Z 7 September 2007 1 1. Pressure
ESS55: EARTH S ATMOSPHERE / Homework #6 / (due 5/24/2018)
") ESS55: EARTH S ATMOSPHERE / Homework #6 / (due 5/24/2018) Name Student ID: 1) 21) 41) 2) 22) 42) 3) 23) 43) 4) 24) 44) 5) 25) 45) 6) 26) 46) 7) 27) 47) 8) 28) 48) 9) 29) 49) 10) 30) 50) 11) 31) 51) 12)
ESS55: EARTH S ATMOSPHERE / Homework #6 / (due 5/24/2018) Name Student ID: 1) 21) 41) 2) 22) 42) 3) 23) 43) 4) 24) 44) 5) 25) 45) 6) 26) 46) 7) 27) 47) 8) 28) 48) 9) 29) 49) 10) 30) 50) 11) 31) 51) 12)
Lec 10: Interpreting Weather Maps
 Lec 10: Interpreting Weather Maps Case Study: October 2011 Nor easter FIU MET 3502 Synoptic Hurricane Forecasts Genesis: on large scale weather maps or satellite images, look for tropical waves (Africa
Chapter 5. Atmospheric Moisture
 Chapter 5 Atmospheric Moisture hydrologic cycle--movement of water in all forms between earth & atmosphere Humidity: amount of water vapor in air vapor pressure saturation vapor pressure absolute humidity
Chapter 8 cont. Clouds and Storms. Spring 2018
 Chapter 8 cont. Clouds and Storms Spring 2018 Clouds and Storms Clouds cover ~ 50% of earth at any time. Clouds are linked to a number of condensation processes. Cloud morphology, cloud types, associated
Water in the Atmosphere Understanding Weather and Climate
 Water in the Atmosphere Understanding Weather and Climate Climate 2 1 Cloud Development and Forms Understanding Weather and Climate Climate 2 2 Learning Objectives 1. The various atmospheric lifting mechanisms
SEVERE AND UNUSUAL WEATHER
 SEVERE AND UNUSUAL WEATHER Basic Meteorological Terminology Adiabatic - Referring to a process without the addition or removal of heat. A temperature change may come about as a result of a change in the
Pilots watch the clouds, because clouds can indicate the kind of weather in store for a flight.
 Low stratus Cumulonimbus Pilots watch the clouds, because clouds can indicate the kind of weather in store for a flight. FILL IN THE BLANKS OR CIRCLE ONE: A. Stratus means flat or on one level. Low stratus
Vertical structure. To conclude, we will review the critical factors invloved in the development of extratropical storms.
 Vertical structure Now we will examine the vertical structure of the intense baroclinic wave using three visualization tools: Upper level charts at selected pressure levels Vertical soundings for selected
Back to basics: From Sputnik to Envisat, and beyond: The use of satellite measurements in weather forecasting and research: Part 1 A history
 Back to basics: From Sputnik to Envisat, and beyond: The use of satellite measurements in weather forecasting and research: Part 1 A history Roger Brugge 1 and Matthew Stuttard 2 1 NERC Data Assimilation
Using Satellite Data to Analyze the Initiation and Evolution of Deep Convective Clouds
 Atmospheric and Oceanic Science Letters ISSN: 674-2834 (Print) 2376-623 (Online) Journal homepage: https://www.tandfonline.com/loi/taos20 Using Satellite Data to Analyze the Initiation and Evolution of
Clouds and turbulent moist convection
 Clouds and turbulent moist convection Lecture 2: Cloud formation and Physics Caroline Muller Les Houches summer school Lectures Outline : Cloud fundamentals - global distribution, types, visualization
Michael F. Stringfellow
 Michael F. Stringfellow Thermals Columns or bubbles of warm air that rise from the ground when it is heated by the sun Soaring Sustained engineless flight using natural sources of lift Boundary or mixing
Clouds are one of the most picturesque aspects of the weather.
 1 Convective clouds over Sweden. Photo (c) 2012, Shonkimages. Clouds out of a Plane Window Clouds are one of the most picturesque aspects of the weather. 2 Clouds in Art and Literature Clouds have inspired
PRACTICAL INTERPRETATION OF RASP SOUNDINGS. Jean Oberson, February 2010.
 PRACTICAL INTERPRETATION OF RASP SOUNDINGS Jean Oberson, www.soaringmeteo.ch, February 2010. Emagram (better referred to SkewT thermodynamic diagram) is actually a simple xy graph. The x axis represents
CHAPTER 11 THUNDERSTORMS AND TORNADOES MULTIPLE CHOICE QUESTIONS
 CHAPTER 11 THUNDERSTORMS AND TORNADOES MULTIPLE CHOICE QUESTIONS 1. A thunderstorm is considered to be a weather system. a. synoptic-scale b. micro-scale c. meso-scale 2. By convention, the mature stage