Department of Geosciences San Francisco State University Spring Metr 201 Monteverdi Quiz #5 Key 150 pts.
|
|
|
- Georgia Hall
- 5 years ago
- Views:
Transcription
1 Department of Geosciences Name San Francisco State University Spring 2013 Metr 201 Monteverdi Quiz #5 Key 150 pts. 1. Definitions. (5 points each for a total of 20 points in this section). (a) Coriolis Acceleration an accleration experienced by frictionless objects moving relative to a rotating surface. On earth, Coriolis acceleration deflects all frictionless moving objects to the right of their path in the Northern Hemisphere, and its magnitude ranges from zero at the Equator to a maximum value at the North Pole. (b) Geostrophic Wind -- the theoretical wind that would result from an exact balance between the Coriolis acceleration and the pressure gradient acceleration so that, in the Northern Hemisphere, air would flow parallel to the isobars (height contours) clockwise around highs and counterclockwise around lows, and faster in regions in which the pressure (height) gradients are the largest. (c) CIN --In a conditionally unstable state, the air parcel must be force lifted through a layer in which the air parcel is relatively cold compared to its surroundings to its LFC. If the equation used to calculate CAPE yields a negative number, then the acceleration due to buoyancy is negative (directed downward). The resulting calculation yields negative CAPE or Convective Inhibition Energy (CIN) (d) EL -- In a conditionally or absolutely unstable state, the elevation at which buoyant air parcel s ascent curve crosses over the Environmental Lapse Rate. This is normally near the tropopause or higher. 2. Longer Answer Questions (105 points). Answer neatly in complete sentences in the spaces provided or on the back of the exam sheets. Show all steps for calculations. (a) Physicists often prefer the term Coriolis Effect to Coriolis Acceleration. Explain why. (30 pts) Newton s Second Law of Motion says that in the absence of other effects an object in motion will remain in motion, at a constant speed and direction unless acted upon by an outside force or acceleration. In reality, frictionless objects moving over the face of the earth, for example, are moving in a straight line and at a constant speed when viewed from space. 1
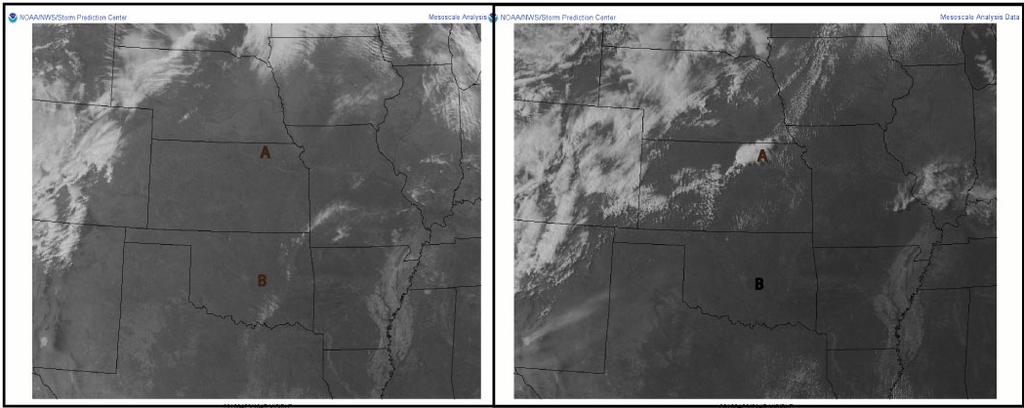
2 Even though this motion appears to describe a spiral relative to the earth, relative to space the object is in straight line motion (and with no change in speed). Hence, there are no outside real accelerations acting on the object. (b) You are provided with the paired (a) CAPE/CIN charts; and (b) Visible Satellite Images for 1700 UTC and 2200 UTC on 29 April Note the locations labeled A and B. (Note: no radar images given...so even though the question was misworded, you should recognize that you are looking at a satellite image and not a radar image). Explain the differences in the satellite presentation at locations A and B given the evolution of the CAPE/CIN field you see on the top chart. [Note: this is an essay question. It does not need to be long. However, it needs to be written in proper English, NEATLY, with sentences that have a subject, verb and object] (30 points) The morning CAPE and CIN field suggests that all of the soundings in the area are potentially unstable, but that large values of CIN need to disappear from these soundings before the soundings become nearly absolutely unstable. The values of CAPE at the two locations are roughly similar, but it is clear that by the afternoon while the CIN disappeared at location A, there was still significant values of it at B. Thus, the convective temperature was probably attained at A, and thunderstorm initiation should be observed at location A, but not at B. The radar reflectivity and visible satellite plots substantiate this, with both showing heavy precipitation associated with a cumulonimbus cloud at A, but clear skies and no precipitation at B. 2

3 3
4 (c) The chart on the next page is the 500 mb chart for the eastern Atlantic for 12 UTC 10 May Note the station reporting a 40 knot (20.7 m/s) wind highlighted in red. The orange lines show the natural coordinate system centered on the observation in question. Locations 2 and 1 are 500 km apart. i. Label the two axes for the coordinate system. (10 pts) This is a natural coordinate system. The s-axis is tangent to the wind with the positive end on the downstream side. The n-axis is at right angles to the wind, with the positive direction to the left. See diagram. ii. The geostrophic wind relation is V g = g f Δz Compute the value of Δz. Show all steps. (35 pts) Δz = z z 2 1 = 500 km = m The 500 mb heights at the two locations can be read right off of the chart. Z 2 = 576 dm = 5760 m Z 1 = 585 dm = 5850 m Substituting these values into the expression gives: Δz = ( )m m = -2.0 X 10-4 =
5 3. Sounding Interpretation. You are provided with the sounding for Brownsville TX (KBRO) for 12 UTC 9 May (25 points) 5
 to right (at the top) and are labeled at the bottom in g/kg. a. Find the Convective Condensation Level, and the Convective Temperature (indicate on the diagram) (10 pts) b.")
6 Your task is to transform the sounding to one that estimates conditions for afternoon heating. On this skew-t log p diagram, the saturation mixing ratio lines are dark grey and slope from left (at the bottom) to right (at the top) and are labeled at the bottom in g/kg. a. Find the Convective Condensation Level, and the Convective Temperature (indicate on the diagram) (10 pts) b. Draw the parcel ascent curve that would occur if the afternoon temperature achieves the Convective Temperature. (5 pts) c. Shade in the CAPE for the ascent curve that results. (5 pts) d. This sounding is an example of the type of sounding that has great potential for explosive convection in the afternoon, even though the morning sounding has a strong inversion. What is the popular name that severe weather forecasters give this type of sounding? Loaded Gun Sounding (5 pts) 6
Monteverdi Metr 201 Quiz #4 100 pts.
 DEPARTMENT OF GEOSCIENCES Name San Francisco State University April 27, 2012 Monteverdi Metr 201 Quiz #4 100 pts. A. Definitions. (5 points each for a total of 25 points in this section). (a) Convective
Department of Geosciences San Francisco State University Spring Metr 201 Monteverdi Quiz #5 Key (100 points)
") Department of Geosciences Name San Francisco State University Spring 2012 Metr 201 Monteverdi Quiz #5 Key (100 points) 1. Fill in the Blank or short definition. (3 points each for a total of 15 points)
Department of Geosciences Name San Francisco State University Spring 2012 Metr 201 Monteverdi Quiz #5 Key (100 points) 1. Fill in the Blank or short definition. (3 points each for a total of 15 points)
Department of Earth & Climate Sciences Spring 2016 Meteorology 260
 Department of Earth & Climate Sciences Spring 2016 Meteorology 260 Name Laboratory #9: Joplin Tornado Day Subsynoptic, Thermodynamic, and Wind Shear Setting Part A: 1600 UTC Surface Chart Subsynoptic Analyses
Department of Earth & Climate Sciences Spring 2016 Meteorology 260
 Department of Earth & Climate Sciences Spring 2016 Meteorology 260 Name Laboratory #9 Key: Joplin Tornado Day Subsynoptic, Thermodynamic, and Wind Shear Setting Part A: 1600 UTC Surface Chart Subsynoptic
Metr 201 Quiz #2 100 pts. A. Short Answer and Definitions. (4 points each for a total of 28 points in this section).
.") Department of Earth & Climate Sciences Name San Francisco State University February 23, 2015 Metr 201 Quiz #2 100 pts. A. Short Answer and Definitions. (4 points each for a total of 28 points in this section).
Department of Earth & Climate Sciences Name San Francisco State University February 23, 2015 Metr 201 Quiz #2 100 pts. A. Short Answer and Definitions. (4 points each for a total of 28 points in this section).
I. Convective Available Potential Energy (CAPE)
") Reading 4: Procedure Summary-- Calcluating CAPE, Lifted Index and Strength of Maximum Convective Updraft CAPE Calculation Lifted Index Calculation Maximum Updraft Strength Calculation I. Convective Available
Reading 4: Procedure Summary-- Calcluating CAPE, Lifted Index and Strength of Maximum Convective Updraft CAPE Calculation Lifted Index Calculation Maximum Updraft Strength Calculation I. Convective Available
I. Convective Available Potential Energy (CAPE)
") Calculating CAPE, Lifted Index and Strength of Maximum Convective Updraft CAPE Calculation Lifted Index Calculation Maximum Updraft Strength Calculation I. Convective Available Potential Energy (CAPE)
Calculating CAPE, Lifted Index and Strength of Maximum Convective Updraft CAPE Calculation Lifted Index Calculation Maximum Updraft Strength Calculation I. Convective Available Potential Energy (CAPE)
Name: Section/TA Name: Atmospheric Science 101, Spring 2003 Midterm 2 Thursday 22 May 2003 Version A
 Name: Section/TA Name: Atmospheric Science 101, Spring 2003 Midterm 2 Thursday 22 May 2003 Version A Multiple Choice (2 points each) Choose the best answer and mark it on a Scantron sheet. 1. Choose the
DEPARTMENT OF GEOSCIENCES SAN FRANCISCO STATE UNIVERSITY. Metr Fall 2012 Test #1 200 pts. Part I. Surface Chart Interpretation.
 DEPARTMENT OF GEOSCIENCES SAN FRANCISCO STATE UNIVERSITY NAME Metr 356.01 Fall 2012 Test #1 200 pts Part I. Surface Chart Interpretation. Figure 1. Surface Chart for 1500Z 7 September 2007 1 1. Pressure
dv dt = f (M M g ) (1)
 (1)") Inertial, Symmetric and Conditional Symmetric Instability (CSI) The following is not meant to be a self-contained tutorial. It is meant to accompany active discussion and demonstration in the classroom.
Inertial, Symmetric and Conditional Symmetric Instability (CSI) The following is not meant to be a self-contained tutorial. It is meant to accompany active discussion and demonstration in the classroom.
The atmosphere in motion: forces and wind. AT350 Ahrens Chapter 9
 The atmosphere in motion: forces and wind AT350 Ahrens Chapter 9 Recall that Pressure is force per unit area Air pressure is determined by the weight of air above A change in pressure over some distance
Answers to Clicker Questions
 Answers to Clicker Questions Chapter 1 What component of the atmosphere is most important to weather? A. Nitrogen B. Oxygen C. Carbon dioxide D. Ozone E. Water What location would have the lowest surface
Charles A. Doswell III, Harold E. Brooks, and Robert A. Maddox
 Charles A. Doswell III, Harold E. Brooks, and Robert A. Maddox Flash floods account for the greatest number of fatalities among convective storm-related events but it still remains difficult to forecast
Metr 201 Quiz #4 Key 100 pts. A. Short Answer and Definitions. (3 points each for a total of 18 points in this section).
.") Department of Earth & Climate Sciences Name San Francisco State University March 30, 2015 Metr 201 Quiz #4 Key 100 pts. A. Short Answer and Definitions. (3 points each for a total of 18 points in this
Department of Earth & Climate Sciences Name San Francisco State University March 30, 2015 Metr 201 Quiz #4 Key 100 pts. A. Short Answer and Definitions. (3 points each for a total of 18 points in this
True or false: The atmosphere is always in hydrostatic balance. A. True B. False
 Clicker Questions and Clicker Quizzes Clicker Questions Chapter 7 Of the four forces that affect the motion of air in our atmosphere, which is to thank for opposing the vertical pressure gradient force
b. The boundary between two different air masses is called a.
 NAME Earth Science Weather WebQuest Part 1. Air Masses 1. Find out what an air mass is. http://okfirst.mesonet.org/train/meteorology/airmasses.html a. What is an air mass? An air mass is b. The boundary
Practical Use of the Skew-T, log-p diagram for weather forecasting. Primer on organized convection
 Practical Use of the Skew-T, log-p diagram for weather forecasting Primer on organized convection Outline Rationale and format of the skew-t, log-p diagram Some basic derived diagnostic measures Characterizing
4. Atmospheric transport. Daniel J. Jacob, Atmospheric Chemistry, Harvard University, Spring 2017
 4. Atmospheric transport Daniel J. Jacob, Atmospheric Chemistry, Harvard University, Spring 2017 Forces in the atmosphere: Gravity g Pressure-gradient ap = ( 1/ ρ ) dp / dx for x-direction (also y, z directions)
p = ρrt p = ρr d = T( q v ) dp dz = ρg
 dp dz = ρg") Chapter 1: Properties of the Atmosphere What are the major chemical components of the atmosphere? Atmospheric Layers and their major characteristics: Troposphere, Stratosphere Mesosphere, Thermosphere
Chapter 1: Properties of the Atmosphere What are the major chemical components of the atmosphere? Atmospheric Layers and their major characteristics: Troposphere, Stratosphere Mesosphere, Thermosphere
ANSWER KEY. Part I: Synoptic Scale Composite Map. Lab 12 Answer Key. Explorations in Meteorology 54
 ANSWER KEY Part I: Synoptic Scale Composite Map 1. Using Figure 2, locate and highlight, with a black dashed line, the 500-mb trough axis. Also, locate and highlight, with a black zigzag line, the 500-mb
Department of Earth & Climate Sciences San Francisco State University
 Department of Earth & Climate Sciences San Francisco State University Name ERTH 260: Inclass Exercise #5 Working With Weather Maps and Soundings: Finding Pressure Features and Fronts Due Wednesday 28 February
NWP Equations (Adapted from UCAR/COMET Online Modules)
") NWP Equations (Adapted from UCAR/COMET Online Modules) Certain physical laws of motion and conservation of energy (for example, Newton's Second Law of Motion and the First Law of Thermodynamics) govern
NWP Equations (Adapted from UCAR/COMET Online Modules) Certain physical laws of motion and conservation of energy (for example, Newton's Second Law of Motion and the First Law of Thermodynamics) govern
Go With the Flow From High to Low Investigating Isobars
 Go With the Flow From High to Low Investigating Isobars Science 10 Mrs. Purba Air Masses The air over a warm surface can be heated, causing it to rise above more dense air. The result is the formation
Department of Earth & Climate Sciences San Francisco State University Fall 2018 ERTH 360. Homework #1 Answer Sheet (Graphics Online) 100 points
 100 points") Department of Earth & Climate Sciences Name San Francisco State University Fall 2018 ERTH 360 Homework #1 Answer Sheet (Graphics Online) 100 points (Due Beginning of Class, Thursday 20 September 2018)
Department of Earth & Climate Sciences Name San Francisco State University Fall 2018 ERTH 360 Homework #1 Answer Sheet (Graphics Online) 100 points (Due Beginning of Class, Thursday 20 September 2018)
ERTH 465 Fall Lab 3. Vertical Consistency and Analysis of Thickness. (300 points)
") Name Date ERTH 465 Fall 2015 Lab 3 Vertical Consistency and Analysis of Thickness (300 points) 1. All labs are to be kept in a three hole binder. Turn in the binder when you have finished the Lab. 2. Show
Name Date ERTH 465 Fall 2015 Lab 3 Vertical Consistency and Analysis of Thickness (300 points) 1. All labs are to be kept in a three hole binder. Turn in the binder when you have finished the Lab. 2. Show
Summary of High Wind Event of 7 March 2004
 Summary of High Wind Event of 7 March 2004 This event was characterized by a very strong jet streak that developed over North Carolina by 00 UTC 8 March, as seen in the Eta model analysis at 300 mb, with
Mid-Latitude Cyclones and Fronts. Lecture 12 AOS 101
 Mid-Latitude Cyclones and Fronts Lecture 12 AOS 101 Homework 4 COLDEST TEMPS GEOSTROPHIC BALANCE Homework 4 FASTEST WINDS L Consider an air parcel rising through the atmosphere The parcel expands as it
2. What are the four most common gasses in the atmosphere and their percentages?
 Meteorology Review Directions: Answer the following open ended review questions. Utilize a diagram where appropriate and do make sure that you label and describe the drawing. Atmospheric Composition 1.
Chapter 14 Thunderstorm Fundamentals
 Chapter overview: Thunderstorm appearance Thunderstorm cells and evolution Thunderstorm types and organization o Single cell thunderstorms o Multicell thunderstorms o Orographic thunderstorms o Severe
MIDTERM 1: APPROXIMATE GRADES TOTAL POINTS = 45 AVERAGE = 33 HIGH SCORE = = A = B = C < 20.0 NP
 MIDTERM 1: TOTAL POINTS = 45 AVERAGE = 33 HIGH SCORE = 43 APPROXIMATE GRADES 38.0 45.0 = A 30.0 37.5 = B 20.0 29.5 = C < 20.0 NP Forces to consider: 1) Pressure Gradient Force 2) Coriolis Force 3) Centripetal
Chapter 3 Convective Dynamics
 Chapter 3 Convective Dynamics Photographs Todd Lindley 3.2 Ordinary or "air-mass storm 3.2.1. Main Characteristics Consists of a single cell (updraft/downdraft pair) Forms in environment characterized
Weather Systems. The air around high-pressure weather systems tends to swirl in a clockwise direction, and usually brings clear skies.
 Weather Systems A weather system is a set of temperature, wind, pressure, and moisture conditions for a certain region that moves as a unit for a period of several days. Low-pressure weather systems form
Aviation Hazards: Thunderstorms and Deep Convection
 Aviation Hazards: Thunderstorms and Deep Convection TREND Empirical thunderstorm forecasting techniques Contents Necessary conditions for convection: Instability Low-level moisture Trigger mechanism Forecasting
NOTES Surface Weather Maps.notebook. April 05, atmospheric. rises. Coriolis. Coriolis. counterclockwise. counterclockwise. point. origin.
 Surface Weather Maps L Symbol : Indicates an area of low air pressure (aka, pressure or pressure). Called a relatively barometric atmospheric cyclone Formation: As warm air in the center cyclone of a,
MEA 214 Midterm Exam, Spring 2008 Tuesday 26 February
 MEA 214 Midterm Exam, Spring 2008 Tuesday 26 February Name: As usual, feel free to ask me if you are confused about the meaning of any question. Good luck, and have a great spring break! Don t forget that
Temperature (T) degrees Celsius ( o C) arbitrary scale from 0 o C at melting point of ice to 100 o C at boiling point of water Also (Kelvin, K) = o C
 degrees Celsius ( o C) arbitrary scale from 0 o C at melting point of ice to 100 o C at boiling point of water Also (Kelvin, K) = o C") 1 2 3 4 Temperature (T) degrees Celsius ( o C) arbitrary scale from 0 o C at melting point of ice to 100 o C at boiling point of water Also (Kelvin, K) = o C plus 273.15 0 K is absolute zero, the minimum
1 2 3 4 Temperature (T) degrees Celsius ( o C) arbitrary scale from 0 o C at melting point of ice to 100 o C at boiling point of water Also (Kelvin, K) = o C plus 273.15 0 K is absolute zero, the minimum
according to and water. High atmospheric pressure - Cold dry air is other air so it remains close to the earth, giving weather.
 EARTH'S ATMOSPHERE Composition of the atmosphere - Earth's atmosphere consists of nitrogen ( %), oxygen ( %), small amounts of carbon dioxide, methane, argon, krypton, ozone, neon and other gases such
WEATHER PATTERNS NAME DATE. VOCABULARY: Synoptic weather map- Isotherm- Barometric Pressure- Isobar- Convergence- Divergence- Cyclone- Anticyclone-
 NAME DATE VOCABULARY: Synoptic weather map- WEATHER PATTERNS Isotherm- Barometric Pressure- Isobar- Convergence- Divergence- Cyclone- Anticyclone- Air mass- Source region- Front- OBJECTIVE: Construct a
Anthony A. Rockwood Robert A. Maddox
 Anthony A. Rockwood Robert A. Maddox An unusually intense MCS produced large hail and wind damage in northeast Kansas and northern Missouri during the predawn hours of June 7 th, 1982. Takes a look at
Page 1. Name:
 Name: 1) As the difference between the dewpoint temperature and the air temperature decreases, the probability of precipitation increases remains the same decreases 2) Which statement best explains why
SAN FRANCISCO STATE UNIVERSITY NAME DEPARTMENT OF GEOSCIENCES Spring 2013
 SAN FRANCISCO STATE UNIVERSITY NAME DEPARTMENT OF GEOSCIENCES Spring 2013 METR 415/715: MONTEVERDI QUIZ 1 Open Book and Open Notes 200 points, 45 minutes 1. Compute the altitude of a geostationary orbit
Final Examination. Part A Answer ONLY TWELVE QUESTIONS in Part A. (Each question is 3 points)
") ATS 210 Spring Term 2001 NAME: Final Examination This is a 2 hour, closed-book examination. Calculators may be used. All answers should be written on the examination paper. Use the final sheet for any
ATS 210 Spring Term 2001 NAME: Final Examination This is a 2 hour, closed-book examination. Calculators may be used. All answers should be written on the examination paper. Use the final sheet for any
Solutions to Comprehensive Final Examination Given on Thursday, 13 December 2001
 Name & Signature Dr. Droegemeier Student ID Meteorology 1004 Introduction to Meteorology Fall, 2001 Solutions to Comprehensive Final Examination Given on Thursday, 13 December 2001 BEFORE YOU BEGIN!! Please
Student Exploration: Hurricane Motion
 Name: Date: Student Exploration: Hurricane Motion Vocabulary: air pressure, Coriolis effect, eye, hurricane, knot, meteorologist, precipitation Prior Knowledge Questions (Do these BEFORE using the Gizmo.)
THE MESOSCALE CONVECTIVE SYSTEM FROM
 RISCURI I CATASTROFE, NR.X, VOL.9, NR. 1/2011 THE MESOSCALE CONVECTIVE SYSTEM FROM 24.07.2010 ELZA HAUER, 1 C. NICHITA 1 ABSTRACT. The Mesoscale Convective System from 24.07.2010. A severe weather event
Department of Earth & Climate Sciences San Francisco State University Fall 2016 ERTH 360. Homework #1 Answer Sheet (Graphics Online) 100 points
 100 points") Department of Earth & Climate Sciences Name San Francisco State University Fall 2016 ERTH 360 Homework #1 Answer Sheet (Graphics Online) 100 points (Due Beginning of Class, Thursday 22 September 2016)
Department of Earth & Climate Sciences Name San Francisco State University Fall 2016 ERTH 360 Homework #1 Answer Sheet (Graphics Online) 100 points (Due Beginning of Class, Thursday 22 September 2016)
3. As warm, moist air moves into a region, barometric pressure readings in the region will generally 1. decrease 2. increase 3.
 Teacher: Mr. Prizzi Castle Learning Review 1 1. Which process most directly results in cloud formation? 1. condensation 3. precipitation 2. transpiration 4. radiation 2. An air mass originating over north
SEVERE AND UNUSUAL WEATHER
 SEVERE AND UNUSUAL WEATHER Basic Meteorological Terminology Adiabatic - Referring to a process without the addition or removal of heat. A temperature change may come about as a result of a change in the
Figure 1: Tephigram for radiosonde launched from Bath at 1100 UTC on 15 June 2005 (IOP 1). The CAPE and CIN are shaded dark and light gray,
. The CAPE and CIN are shaded dark and light gray,") Figure 1: Tephigram for radiosonde launched from Bath at 1100 UTC on 1 June 200 (IOP 1). The CAPE and CIN are shaded dark and light gray, respectively; the thin solid line partially bounding these areas
Figure 1: Tephigram for radiosonde launched from Bath at 1100 UTC on 1 June 200 (IOP 1). The CAPE and CIN are shaded dark and light gray, respectively; the thin solid line partially bounding these areas
Guided Notes Weather. Part 1: Weather Factors Temperature Humidity Air Pressure Winds Station Models
 Guided Notes Weather Part 1: Weather Factors Temperature Humidity Air Pressure Winds Station Models. 1. What is weather? Weather: short-term atmospheric conditions in a specific area at a specific time
A Case Study on Diurnal Boundary Layer Evolution
 UNIVERSITY OF OKLAHOMA A Case Study on Diurnal Boundary Layer Evolution Meteorological Measurement Systems Fall 2010 Jason Godwin 12/9/2010 Lab partners: Sam Irons, Charles Kuster, Nathan New, and Stefan
EAS270, The Atmosphere Mid-term Exam 28 Oct. 2011
 EAS270, The Atmosphere Mid-term Exam 28 Oct. 2011 Professor: J.D. Wilson Time available: 50 mins Value: 20% Instructions: For each of the 30 multi-choice questions, choose the most logical option. Use
INTRODUCTION TO METEOROLOGY PART ONE SC 213 MAY 21, 2014 JOHN BUSH
 INTRODUCTION TO METEOROLOGY PART ONE SC 213 MAY 21, 2014 JOHN BUSH WEATHER PATTERNS Extratropical cyclones (low pressure core) and anticyclones (high pressure core) Cold fronts and warm fronts Jet stream
ATS 351, Spring 2010 Lab #9 Weather Radar - 55 points
 ATS 351, Spring 2010 Lab #9 Weather Radar - 55 points 1. (5 points) If a radar has a maximum unambiguous range of 300km, what is its PRF? (The speed of light, c, is equal to 3x10 8 m/s) The equation to
Thunderstorm: a cumulonimbus cloud or collection of cumulonimbus clouds featuring vigorous updrafts, precipitation and lightning
 Thunderstorm: a cumulonimbus cloud or collection of cumulonimbus clouds featuring vigorous updrafts, precipitation and lightning Thunderstorms are responsible for most of what we refer to as severe weather,
Weather report 28 November 2017 Campinas/SP
 Weather report 28 November 2017 Campinas/SP Summary: 1) Synoptic analysis and pre-convective environment 2) Verification 1) Synoptic analysis and pre-convective environment: At 1200 UTC 28 November 2017
ERTH 465 Fall Lab 3. Vertical Consistency and Analysis of Thickness
 Name Date ERTH 465 Fall 2015 Lab 3 Vertical Consistency and Analysis of Thickness 1. All labs are to be kept in a three hole binder. Turn in the binder when you have finished the Lab. 2. Show all work
XC Meteorology. And other bullshit
 XC Meteorology And other bullshit (c) Jim White 2014 Why do Met? Choose whether to turn up Choose best task for day Choose glider configuration Choose pilot configuration! Avoid being in wrong place Achieve
ATS 351, Spring 2010 Lab #9 Weather Radar - 55 points
 ATS 351, Spring 2010 Lab #9 Weather Radar - 55 points 1. (5 points) If a radar has a maximum unambiguous range of 300km, what is its PRF? (The speed of light, c, is equal to 3x10 8 m/s) 2. (5 points) Explain
DEPARTMENT OF EARTH & CLIMATE SCIENCES SAN FRANCISCO STATE UNIVERSITY. Metr Fall 2014 Test #1 September 30, 2014
 DEPARTMENT OF EARTH & CLIMATE SCIENCES SAN FRANCISCO STATE UNIVERSITY NAME Metr 302.02 Fall 2014 Test #1 September 30, 2014 200 pts (4 pts each answer) Part I. Surface Chart Interpretation. Questions 1
Lecture 1. Equations of motion - Newton s second law in three dimensions. Pressure gradient + force force
 Lecture 3 Lecture 1 Basic dynamics Equations of motion - Newton s second law in three dimensions Acceleration = Pressure Coriolis + gravity + friction gradient + force force This set of equations is the
Earth s Environmental System: Climate V2100. Midterm Exam. Wednesday March 12, 2003
 Earth s Environmental System: Climate V2100 Midterm Exam Wednesday March 12, 2003 Please put your name at the top of each page If you sketch something, make it big and clear and label your axes Explain
PLOTTING WEATHER DATA to perform a SURFACE ANALYSIS
 PLOTTING WEATHER DATA to perform a SURFACE ANALYSIS The surface analysis permits one to identify and locate the large scale features of the sea level pressure field and the surface fronts. Isobars with
Pressure Conversion in Millibars
 Name Date The Weather Map Biggie Lab: Make it Colorful and Purty! Now that you have learned about all of the different variables that contribute to daily changes in weather, it is now time to bring it
STATISTICAL ANALYSIS ON SEVERE CONVECTIVE WEATHER COMBINING SATELLITE, CONVENTIONAL OBSERVATION AND NCEP DATA
 12.12 STATISTICAL ANALYSIS ON SEVERE CONVECTIVE WEATHER COMBINING SATELLITE, CONVENTIONAL OBSERVATION AND NCEP DATA Zhu Yaping, Cheng Zhoujie, Liu Jianwen, Li Yaodong Institute of Aviation Meteorology
CONVERGENCE, DIVERGENCE, AND VORTICITY
 CHAPTER 1 CONVERGENCE, DIVERGENCE, AND VORTICITY In your reading of the AG2 manual, volume 1, you became familiar with the terms convergence, divergence, and vorticity when used in relation to surface
Chapter 12 Section 12.1 The causes of weather
 Chapter 12 Section 12.1 The causes of weather Main Idea: Air masses have different temperatures and amounts of moisture because of the uneven heating of earth's surface. What is Meteorology The study of
Pilots watch the clouds, because clouds can indicate the kind of weather in store for a flight.
 Low stratus Cumulonimbus Pilots watch the clouds, because clouds can indicate the kind of weather in store for a flight. FILL IN THE BLANKS OR CIRCLE ONE: A. Stratus means flat or on one level. Low stratus
3 Severe Weather. Critical Thinking
 CHAPTER 2 3 Severe Weather SECTION Understanding Weather BEFORE YOU READ After you read this section, you should be able to answer these questions: What are some types of severe weather? How can you stay
Week: Dates: 3/2 3/20 Unit: Climate
 clementaged.weebly.com Name: EVEN Period: Week: 28 30 Dates: 3/2 3/20 Unit: Climate Monday Tuesday Wednesday Thursday Friday 2 O 3 E *Vocabulary *Water in the Atmosphere and Clouds Notes *Cloud Drawings
Module 9 Weather Systems
 Module 9 Weather Systems In this module the theory of atmospheric dynamics is applied to different weather phenomena. The first section deals with extratropical cyclones, low and high pressure areas of
METEOROLOGY. 1 The average height of the tropopause at 50 N is about A 14 km B 16 km C 11 km D 8 km
 1 The average height of the tropopause at 50 N is about A 14 km B 16 km C 11 km D 8 km 2 In the lower part of the stratosphere the temperature A is almost constant B decreases with altitude C increases
Hurricane: an organized tropical storm system featuring vigorous convection and sustained winds in excess of 64 knots (74 mph)
") Hurricane: an organized tropical storm system featuring vigorous convection and sustained winds in excess of 64 knots (74 mph) The storms have different names, depending on where they form: Western Hemisphere:
Hurricane: an organized tropical storm system featuring vigorous convection and sustained winds in excess of 64 knots (74 mph) The storms have different names, depending on where they form: Western Hemisphere:
Feel free to ask me if you are confused about the meaning of any question. Good luck, and have a great spring break!
 Name: _ MEA 214 Midterm Exam, Spring 2011 Feel free to ask me if you are confused about the meaning of any question. Good luck, and have a great spring break! 1.) For each of the characteristics listed
General Meteorology Laboratory #11. Forecast Models
 General Meteorology Laboratory #11 Name Partners Forecast Models Date _ Section Purpose: Develop the ability to contour two dimensional data and use the resulting information to locate a cold front. Equipment:
Atmospheric Dynamics: lecture 3
 Atmospheric Dynamics: lecture 3 Moist convection Dew point temperature/lapse rate/lcl Equivalent potential temperature Conditional and potential instability Thermodynamic diagram CAPE Introduction to Python
Warm season forecasting! Some material adapted from Material Produced at COMET for their Residence Course in Hydrometeorology
 Warm season forecasting! Some material adapted from Material Produced at COMET for their Residence Course in Hydrometeorology 1 Outline! Types of stability and application to forecasting! Dry and moist
Module 11: Meteorology Topic 5 Content: Weather Maps Notes
 Introduction A variety of weather maps are produced by the National Weather Service and National Oceanographic Atmospheric Administration. These maps are used to help meteorologists accurately predict
ATSC 201 Final Exam Name: Fall 2008 (total points = 100) Student Number: 1. (2 points) The two main conditions needed for downbursts to form are: and
 Student Number: 1. (2 points) The two main conditions needed for downbursts to form are: and") Prof. Stull (open book) Fall 2008 (total points = 100) Student Number: 1. (2 points) The two main conditions needed for downbursts to form are: and 2. (6 pts) For the most-used imager channels on weather
Prof. Stull (open book) Fall 2008 (total points = 100) Student Number: 1. (2 points) The two main conditions needed for downbursts to form are: and 2. (6 pts) For the most-used imager channels on weather
Cyclones and Anticyclones, Ridges and Troughs
 Cyclones and Anticyclones, Ridges and Troughs Isobars on surface maps often have a closed appearance (as illustrated) Areas of low pressure are called cyclones, while areas with high pressure are called
Thunderstorm: a cumulonimbus cloud or collection of cumulonimbus clouds featuring vigorous updrafts, precipitation and lightning
 Thunderstorm: a cumulonimbus cloud or collection of cumulonimbus clouds featuring vigorous updrafts, precipitation and lightning Thunderstorm: a cumulonimbus cloud or collection of cumulonimbus clouds
11A.2 Forecasting Short Term Convective Mode And Evolution For Severe Storms Initiated Along Synoptic Boundaries
 11A.2 Forecasting Short Term Convective Mode And Evolution For Severe Storms Initiated Along Synoptic Boundaries Greg L. Dial and Jonathan P. Racy Storm Prediction Center, Norman, Oklahoma 1. Introduction
1. Static Stability. (ρ V ) d2 z (1) d 2 z. = g (2) = g (3) T T = g T (4)
 d2 z (1) d 2 z. = g (2) = g (3) T T = g T (4)") NCAR (National Center for Atmospheric Research) has an excellent resource for education called COMET-MetEd. There you can find some really great tutorials on SkewT-LogP plots: visit http://www.meted.ucar.edu/mesoprim/skewt/index.htm.
NCAR (National Center for Atmospheric Research) has an excellent resource for education called COMET-MetEd. There you can find some really great tutorials on SkewT-LogP plots: visit http://www.meted.ucar.edu/mesoprim/skewt/index.htm.
Lab 19.2 Synoptic Weather Maps
 Lab 19.2 Synoptic Weather Maps Name: Partner: Purpose The purpose of this lab is to have you read and interpret the information displayed on synoptic weather maps. You will also learn the techniques used
Problem #1: The Gradient Wind in Natural Coordinates (Due Friday, Feb. 28; 20 pts total)
") METR 50: Atmospheric Dynamics II Dr. Dave Dempsey Spring 014 Problem #1: The Gradient Wind in Natural Coordinates (Due Friday, Feb. 8; 0 pts total) In natural (s,n,p) coordinates, the synoptic-scaled,
METR 50: Atmospheric Dynamics II Dr. Dave Dempsey Spring 014 Problem #1: The Gradient Wind in Natural Coordinates (Due Friday, Feb. 8; 0 pts total) In natural (s,n,p) coordinates, the synoptic-scaled,
Kenneth L. Pryor* and Gary P. Ellrod Center for Satellite Applications and Research (NOAA/NESDIS) Camp Springs, MD
 Camp Springs, MD") P1.57 GOES WMSI PROGRESS AND DEVELOPMENTS Kenneth L. Pryor* and Gary P. Ellrod Center for Satellite Applications and Research (NOAA/NESDIS) Camp Springs, MD 1. INTRODUCTION A multi-parameter index has
P1.57 GOES WMSI PROGRESS AND DEVELOPMENTS Kenneth L. Pryor* and Gary P. Ellrod Center for Satellite Applications and Research (NOAA/NESDIS) Camp Springs, MD 1. INTRODUCTION A multi-parameter index has
Instabilities and Basic Convection
 Instabilities and Basic Convection Buoyant Instability (gravity is restoring force) Assume a stationary incompressible fluid (like water), so that ρ = ρ 0 + ρ/ z z and also it is in hydrostatic equilibrium
Guided Reading Chapter 18: Weather Patterns
 Name Number Date Guided Reading Chapter 18: Weather Patterns 18-1: Air Masses and Fronts 1. What is an air mass? 2. Scientists classify air masses according to and 3. Is the following sentence true or
Chapter 5. Atmospheric Moisture
 Chapter 5 Atmospheric Moisture hydrologic cycle--movement of water in all forms between earth & atmosphere Humidity: amount of water vapor in air vapor pressure saturation vapor pressure absolute humidity
F = ma. ATS 150 Global Climate Change Winds and Weather. Scott Denning CSU CMMAP 1. Please read Chapter 6 from Archer Textbook
 Winds and Weather Please read Chapter 6 from Archer Textbook Circulation of the atmosphere and oceans are driven by energy imbalances Energy Imbalances What Makes the Wind Blow? Three real forces (gravity,
Regional Climatology. Lab Number One Atmospheric Processes
 Name: Time of Class: Due Date: Regional Climatology Lab Number One Atmospheric Processes Part I: Group Discussion and Answer Directions: Arrange a group of three to five individuals. Discuss each of the
Project 3 Convection and Atmospheric Thermodynamics
 12.818 Project 3 Convection and Atmospheric Thermodynamics Lodovica Illari 1 Background The Earth is bathed in radiation from the Sun whose intensity peaks in the visible. In order to maintain energy balance
Mr. P s Science Test!
 WEATHER- 2017 Mr. P s Science Test! # Name Date 1. Draw and label a weather station model. (10 pts) 2. The is the layer of the atmosphere with our weather. 3. Meteorologists classify clouds in about different
Precipitation and Wind AOSC 200 Tim Canty. Current Weather
 Precipitation and Wind AOSC 200 Tim Canty Class Web Site: http://www.atmos.umd.edu/~tcanty/aosc200 Topics for today: Precipitation cont. RADAR Pressure Coriolis force Lecture 12 Oct 5 2017 1 Current Weather
SEVERE WEATHER AND FRONTS TAKE HOME QUIZ
 1. Most of the hurricanes that affect the east coast of the United States originally form over the A) warm waters of the Atlantic Ocean in summer B) warm land of the southeastern United States in summer
Tornadogenesis in Supercells: The Three Main Ingredients. Ted Funk
 Tornadogenesis in Supercells: The Three Main Ingredients Ted Funk NWS Louisville, KY Spring 2002 Environmental Parameters Supercells occur within environments exhibiting several wellknown characteristics
Science 1206 Chapter 1 - Inquiring about Weather
 Science 1206 Chapter 1 - Inquiring about Weather 1.1 - The Atmosphere: Energy Transfer and Properties (pp. 10-25) Weather and the Atmosphere weather the physical conditions of the atmosphere at a specific
ERTH 365 Homework #2: Hurricane Harvey. 100 points
 ERTH 365 Homework #2: Hurricane Harvey 100 points Due by 6pm, Tuesday 30 October 2018, ELECTRONIC SUBMISSON BY EMAIL ONLY BY 6PM (send to klevey@sfsu.edu) (acceptable formats: MS Word, Google Doc, plain
Weather & Atmospheric Variables Review
 Weather & Atmospheric Variables Review Words that are bold, italicized and/or underlined are vocabulary you must KNOW! A) Atmospheric variables: a) Temperature as it relates to: 1) duration of insolation...longer
Moisture, Clouds, and Precipitation: Clouds and Precipitation. Dr. Michael J Passow
 Moisture, Clouds, and Precipitation: Clouds and Precipitation Dr. Michael J Passow What Processes Lift Air? Clouds require three things: water vapor, a condensation nucleus, and cooling Cooling usually