EDF 7405 Advanced Quantitative Methods in Educational Research MULTR.SAS
|
|
|
- Evangeline Burke
- 6 years ago
- Views:
Transcription
1 EDF 7405 Advanced Quantitative Methods in Educational Research MULTR.SAS The data used in this example describe teacher and student behavior in 8 classrooms. The variables are: Y percentage of interventions in a 30 minute period that are punitive (PI) X percentage of 30 one-minute time Periods in which the student should be on task but is off task (OTR) X percentage of 30 one-minute time periods during which students are changing activities or are waiting for teacher directions (TT) The data are used to illustrate multiple regression with two independent variables: or in terms of the variables in the analysis Y X X PI TT OTR See pages 0- of the first section for directions to calculate descriptive statistics. Descriptives Descriptive Statistics OTR TT PI Valid N (listwise) Std. N Minimum Maximum Mean Deviation
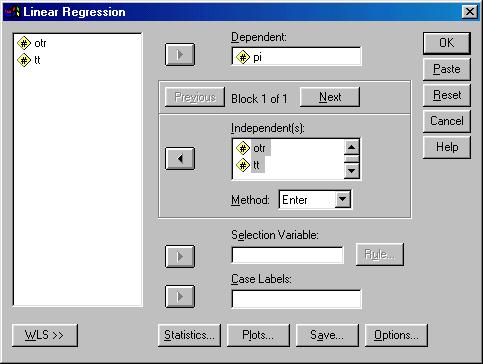
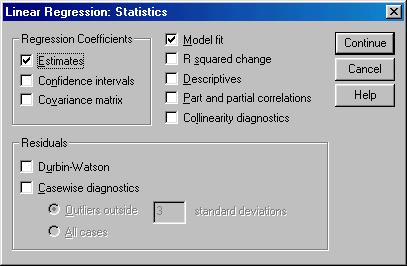
2 See pages 4-6 of the first section for direction to calculate a correlation matrix Correlations Correlations OTR TT PI OTR Pearson Correlation Sig. (-tailed) N TT Pearson Correlation ** Sig. (-tailed) N PI Pearson Correlation **.000 Sig. (-tailed) N **. Correlation is significant at the 0.0 level (-tailed). Regression Analysis. When you do the regression analysis you should save both the predicted values and the Studentized residuals. Both are used to constrict residual plots.. If there are missing data, it may be a good idea to use the regression procedure to calculate descriptive statistics and correlation coefficients, even though these have already been calculated. 3. I also want to calculate partial and semi-partial correlations. (In SPSS a semipartial correlation is called a part correlation.) To calculate the statistics mentioned in points and 3, in addition to following the steps for a regression analysis (see pages 8-9 of the first section) also select the options in the following screen:
3 3
4 4 Regression Descriptive Statistics PI OTR TT Std. Mean Deviation N Correlations Pearson Correlation Sig. (-tailed) N PI OTR TT PI OTR TT PI OTR TT PI OTR TT Model Variables Entered/Removed b Variables Variables Entered Removed Method TT, OTR a. Enter a. All requested variables entered. b. Dependent Variable: PI Model Model Summary b Std. Error Adjusted of the R R Square R Square Estimate.353 a a. Predictors: (Constant), TT, OTR b. Dependent Variable: PI
5 5 Model Regression Residual Total ANOVA b Sum of Mean Squares df Square F Sig a a. Predictors: (Constant), TT, OTR b. Dependent Variable: PI Model (Constant) OTR TT a. Dependent Variable: PI Unstandardized Coefficients Standardi zed Coefficien ts Coefficients a Correlations t Sig. Zero-order Partial Part B Std. Error Beta E Case Number 64 Casewise Diagnostics a a. Dependent Variable: PI Std. Residual PI Note that the correlations are not squared. What SPSS labels a part correlation is a (unsquared) semi-partial correlation. Predicted Value Std. Predicted Value Standard Error of Predicted Value Adjusted Predicted Value Residual Std. Residual Stud. Residual Deleted Residual Stud. Deleted Residual Mahal. Distance Cook's Distance Centered Leverage Value a. Dependent Variable: PI Residuals Statistics a Std. Minimum Maximum Mean Deviation N E E
6 6 Graph Plot of Studentized Residuals Versus Predicted Values 4 3 Studentized Residual Unstandardized Predicted Value Graph Plot of Studentized Residuals Versus OTR 4 3 Studentized Residual OTR
7 7 Graph Plot of Studentized Residuals Versus TT 4 3 Studentized Residual TT A Confidence Interval for the Squared Multiple Correlation Coefficient To compute the confidence interval, you must download the file ci.smcc.bisec.sps from the Webcite The link to the program is SPSS CI Program for a Squared Multiple Correlation Coefficient. Once you have downloaded the file you run it by following these directions:. Start SPSS.. Click File, Open, Syntax and find the file ci.smcc.bisec.sps It will open into the SPSS syntax editor. The top few lines of the file are comment This program computes a confidence interval for the comment squared multiple correlation coefficient for the design comment in which values of the independent variables are sampled. comment To use the program you input comment n--the sample size comment k--the number of predictors comment rsq--the sample squared multiple correlation coefficient comment conlevel--the confidence level for the interval. NEW file. INPUT PROGRAM.
8 8 compute n= 7. compute k=. compute rsq=0.45. compute conlev= Click run, all To use the program for other problems, change n, k, and rsq. To change the confidence level, change conlev. Note that a period must end each of these lines and you should not edit any other lines.
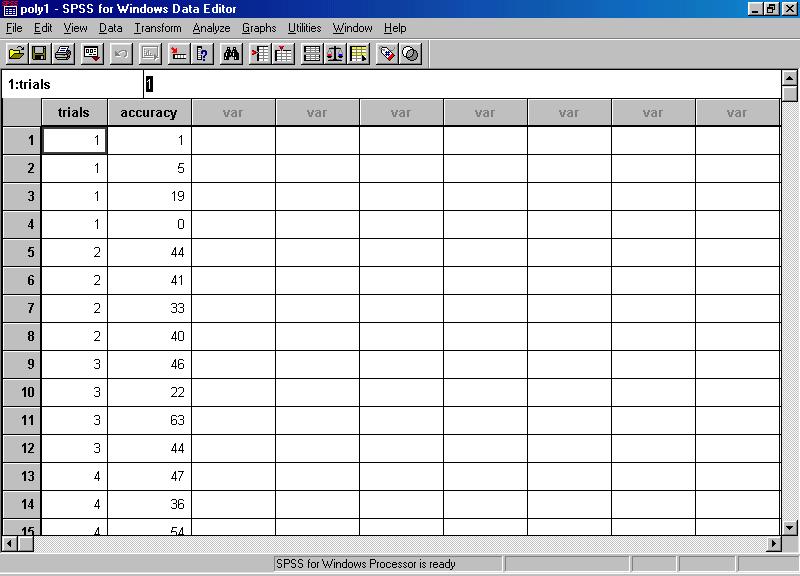
9 9 EDF 7405 Advanced Quantitative Methods in Educational Research POLY.SAS Data are available for 4 participants in a study. Participants practiced a psychomotor task. The number of trials of practice ranged from one to six and was determined by random assignment. Thus four participants had one trial of practice, four had two trials, and so forth. The dependent variable was accuracy on a trial following the last practice trial. See pages 6-9 of the first section for directions to producing case summaries Summarize Case Processing Summary a Cases Included Excluded Total N Percent N Percent N Percent TRIALS % 0.0% % ACCURACY % 0.0% % a. Limited to first 00 cases.
10 0 Case Summaries a ACCURA TRIALS CY Total N 4 4 a. Limited to first 00 cases.
11 See pages -3 of the first section for directions to construct a scatterplot. Graph 70 Accuracy vs. Trials of Practice ACCURACY TRIALS See pages 8-9 and 3-35 of the first section for directions to conduct a regression analysis. Regression Model Variables Entered/Removed b Variables Variables Entered Removed Method TRIALS a. Enter a. All requested variables entered. b. Dependent Variable: ACCURACY Model Model Summary b Std. Error Adjusted of the R R Square R Square Estimate.75 a a. Predictors: (Constant), TRIALS b. Dependent Variable: ACCURACY
12 Model Regression Residual Total ANOVA b Sum of Mean Squares df Square F Sig a a. Predictors: (Constant), TRIALS b. Dependent Variable: ACCURACY Model (Constant) TRIALS Unstandardized Coefficients a. Dependent Variable: ACCURACY Coefficients a Standardi zed Coefficien ts B Std. Error Beta t Sig Predicted Value Std. Predicted Value Standard Error of Predicted Value Adjusted Predicted Value Residual Std. Residual Stud. Residual Deleted Residual Stud. Deleted Residual Mahal. Distance Cook's Distance Centered Leverage Value a. Dependent Variable: ACCURACY Residuals Statistics a Std. Minimum Maximum Mean Deviation N
13 3 Graph 3 Residual Plot: Linear Model Studentized Residual TRIALS Graph 70 Accuracy vs. Trials of Practice ACCURACY TRIALS
14 4
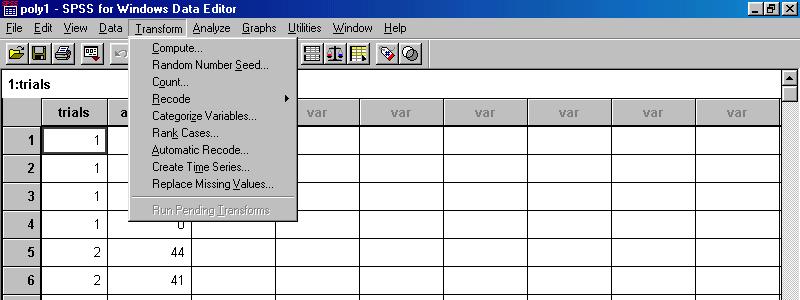
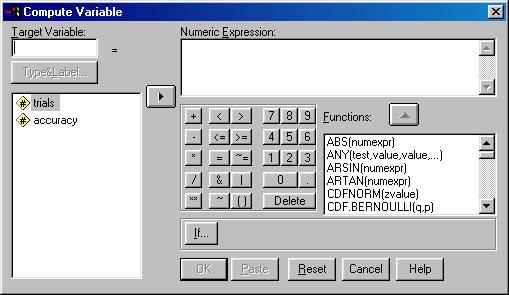
15 5 EDF 7405 Advanced Quantitative Methods in Educational Research POLY.SAS In this analysis the quadratic model is used to analyze the psychomotor data. The quadratic model is where Y X X Y is accuracy X is number of trials of practice. To use the quadratic model we must use the TRANSFORM procedure to compute and add it to the data set. We have already seen how to compute new variables and add them to the data set. To review use the COMPUTE option within the TRANSFORM option. X
16 6
17 7

18 8 Once the squared trials term is added to the data set, we analyze the data by using multiple regression analysis. See pages 6-9 of the first section for directions to produce case summaries. Summarize Case Processing Summary a Cases Included Excluded Total N Percent N Percent N Percent TRIALS % 0.0% % ACCURACY % 0.0% % TRIALRD % 0.0% % a. Limited to first 00 cases.
19 9 Case Summaries a ACCURA TRIALS CY TRIALRD Total N a. Limited to first 00 cases. Regression Model Variables Entered/Removed b Variables Variables Entered Removed Method TRIALRD, TRIALS a. Enter a. All requested variables entered. b. Dependent Variable: ACCURACY
20 0 Model Model Summary b Std. Error Adjusted of the R R Square R Square Estimate.848 a a. Predictors: (Constant), TRIALRD, TRIALS b. Dependent Variable: ACCURACY Model Regression Residual Total ANOVA b Sum of Mean Squares df Square F Sig a a. Predictors: (Constant), TRIALRD, TRIALS b. Dependent Variable: ACCURACY Model (Constant) TRIALS TRIALRD Unstandardized Coefficients a. Dependent Variable: ACCURACY Coefficients a Standardi zed Coefficien ts B Std. Error Beta t Sig Predicted Value Std. Predicted Value Standard Error of Predicted Value Adjusted Predicted Value Residual Std. Residual Stud. Residual Deleted Residual Stud. Deleted Residual Mahal. Distance Cook's Distance Centered Leverage Value a. Dependent Variable: ACCURACY Residuals Statistics a Std. Minimum Maximum Mean Deviation N E E

21 We want to construct a residual plot. Since I have continued the analysis from the linear analysis, there are now two residual variables in the data set. Sre_ is the residual variable from the quadratic analysis.
 until we get to the following screen in the SPSS for Windows")
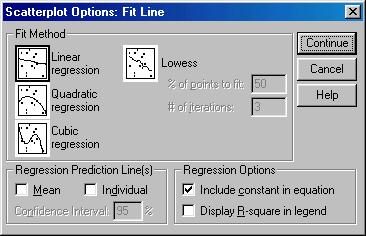
22 Graph Residual plot: Qudratic Model Studentized Residual TRIALS It may be useful to have a scatterplot with the quadratic regression curve drawn on it. To do this we follow the steps used to draw a linear regression line on the plot (see pages - 3 of the first section) until we get to the following screen in the SPSS for Windows Chart Editor:
23 3
24 4 Graph 70 Scatter Plot with Quadratic Regression Curve ACCURACY TRIALS
25 5 cubic model is EDF 7405 Advanced Quantitative Methods in Educational Research POLY3.SAS In this analysis the cubic model is used to analyze the psychomotor data. The Y X X X 3 To use the cubic model we must use the COMPUTE procedure to compute X and and add them to the data set (see pages 5-8 of this section for directions to compute new variables). Then we analyze the data by using multiple regression analysis. 3 X See pages 6-9 of the first section for directions to produce case summaries. Summarize Case Processing Summary a Cases Included Excluded Total N Percent N Percent N Percent TRIALS % 0.0% % ACCURACY % 0.0% % TRIALRD % 0.0% % TRIAL3RD % 0.0% % a. Limited to first 00 cases.
26 6 Case Summaries a ACCURA TRIALS CY TRIALRD TRIAL3RD Total N a. Limited to first 00 cases. See pages 8-9 and 3-35 of the first section for directions to conduct a regression analysis. Regression Model Variables Entered/Removed b Variables Variables Entered Removed Method TRIAL3RD, TRIALS, TRIALRD a. Enter a. All requested variables entered. b. Dependent Variable: ACCURACY
27 7 Model Model Summary b Std. Error Adjusted of the R R Square R Square Estimate.874 a a. Predictors: (Constant), TRIAL3RD, TRIALS, TRIALRD b. Dependent Variable: ACCURACY Model Regression Residual Total ANOVA b Sum of Mean Squares df Square F Sig a a. Predictors: (Constant), TRIAL3RD, TRIALS, TRIALRD b. Dependent Variable: ACCURACY Model (Constant) TRIALS TRIALRD TRIAL3RD Unstandardized Coefficients a. Dependent Variable: ACCURACY Coefficients a Standardi zed Coefficien ts B Std. Error Beta t Sig
28 8 Predicted Value Std. Predicted Value Standard Error of Predicted Value Adjusted Predicted Value Residual Std. Residual Stud. Residual Deleted Residual Stud. Deleted Residual Mahal. Distance Cook's Distance Centered Leverage Value a. Dependent Variable: ACCURACY Residuals Statistics a Std. Minimum Maximum Mean Deviation N E E
29 9 Graph Residual Plot: Cubic Model Studentized Residual TRIALS See pages -4 of this section for directions to draw the regression relationship on a scatterplot.
30 30 Graph 70 Scatter Plot with Cubic Regression Curve ACCURACY TRIALS
31 3 EDF 7405 Advanced Quantitative Methods in Educational Research RPLOTS.SAS Data available for 9 cities describe the support for social services (SS), the ethnic/racial mix in the city (HI - heterogeneity index), and the degree of migration in and out of the city (MI mobility index). The purpose of the following analysis is to determine whether SS is related to either HI or MI. These data are used to illustrate residual plots in multiple regression. The model is or in terms of the variables in the analysis Y X X SS HI MI See pages 6-9 of the first section for direction to produce case summaries. Summarize Case Processing Summary a Cases Included Excluded Total N Percent N Percent N Percent SS % 0.0% % HI % 0.0% % MI % 0.0% % a. Limited to first 00 cases.
32 3 Case Summaries a SS HI MI Total N a. Limited to first 00 cases.
33 33 See pages 8-9 and 3-35 of the first section for directions to conduct a regression analysis. Regression Model Variables Entered/Removed b Variables Variables Entered Removed Method MI, HI a. Enter a. All requested variables entered. b. Dependent Variable: SS Model Model Summary b Std. Error Adjusted of the R R Square R Square Estimate.593 a a. Predictors: (Constant), MI, HI b. Dependent Variable: SS Model Regression Residual Total a. Predictors: (Constant), MI, HI b. Dependent Variable: SS ANOVA b Sum of Mean Squares df Square F Sig a Model (Constant) HI MI a. Dependent Variable: SS Unstandardized Coefficients Coefficients a Standardi zed Coefficien ts B Std. Error Beta t Sig
34 34 Predicted Value Std. Predicted Value Standard Error of Predicted Value Adjusted Predicted Value Residual Std. Residual Stud. Residual Deleted Residual Stud. Deleted Residual Mahal. Distance Cook's Distance Centered Leverage Value Graph a. Dependent Variable: SS Residuals Statistics a Std. Minimum Maximum Mean Deviation N E E Student. Residuals vs. Predicted Values Studentized Residual Unstandardized Predicted Value
35 35 Graph Studentized Residuals vs. HI 3 Studentized Residual HI Graph Studentized Residuals vs. MI 3 Studentized Residual MI
36 36
37 37 EDF 7405 Advanced Quantitative Methods in Educational Research RPLOTS.SAS The previous analysis is continued to illustrate the use of polynomials when there is more than one conceptual independent variable. We need to add a squared MI term to the model, which becomes Y X X X 3 or in terms of the variables in the analysis SS HI MI MI 3 To add MI to the data we used the COMPUTE option within the TRANSFORM option (see pages 5-8 of this section for directions to computing new variables). See pages 8-9 and 3-35 of the first section for directions to conduct a regression analysis. Regression Model Variables Entered/Removed b Variables Variables Entered Removed Method MIRD, HI, MI a. Enter a. All requested variables entered. b. Dependent Variable: SS Model Model Summary b Std. Error Adjusted of the R R Square R Square Estimate.743 a a. Predictors: (Constant), MIRD, HI, MI b. Dependent Variable: SS
38 38 Model Regression Residual Total ANOVA b Sum of Mean Squares df Square F Sig a a. Predictors: (Constant), MIRD, HI, MI b. Dependent Variable: SS Model (Constant) HI MI MIRD a. Dependent Variable: SS Unstandardized Coefficients Coefficients a Standardi zed Coefficien ts B Std. Error Beta t Sig E Predicted Value Std. Predicted Value Standard Error of Predicted Value Adjusted Predicted Value Residual Std. Residual Stud. Residual Deleted Residual Stud. Deleted Residual Mahal. Distance Cook's Distance Centered Leverage Value a. Dependent Variable: SS Residuals Statistics a Std. Minimum Maximum Mean Deviation N E E
39 39 Graph Student. Residual vs. Predicted Values Studentized Residual Unstandardized Predicted Value Graph Studentized Residual vs HI Studentized Residual HI
40 40 Graph Studentized Residual vs MI Studentized Residual MI
41 4 EDF 7405 Advanced Quantitative Methods in Educational Research For 0 students, data are available on grade point average (GPA) for a particular semester, SAT math scores, and average number of hours spent studying weekly (HRS). A researcher is investigating whether SAT ( X ) scores and study time ( X ) interact in predicting GPA (Y). The regression model is Y X X X X 3 or in terms of the abbreviations for the variables: 3 GPA SAT HRS SAT HRS To estimate the model, the TRANFORM procedure must be used to compute the product term (see pages 5-8 of this section for directions to compute new variables). We are going to add collinearity statistics to our results. Follow the steps to estimate a regression equation (see pages 8-9 of the first section) until you get to the following screen:
42 4 Regression Model Variables Entered/Removed b Variables Variables Entered Removed Method SATXHRS, HRS, SAT a. Enter a. All requested variables entered. b. Dependent Variable: GPA Model Model Summary b Std. Error Adjusted of the R R Square R Square Estimate.963 a a. Predictors: (Constant), SATXHRS, HRS, SAT b. Dependent Variable: GPA Model Regression Residual Total ANOVA b Sum of Mean Squares df Square F Sig a E a. Predictors: (Constant), SATXHRS, HRS, SAT b. Dependent Variable: GPA
43 43 Model (Constant) SAT HRS SATXHRS a. Dependent Variable: GPA Unstandardized Coefficients Coefficients a Standardi zed Coefficien ts Collinearity Statistics B Std. Error Beta t Sig. Tolerance VIF E E E Collinearity Diagnostics a Model Dimension 3 4 a. Dependent Variable: GPA Condition Variance Proportions Eigenvalue Index (Constant) SAT HRS SATXHRS E E E Predicted Value Std. Predicted Value Standard Error of Predicted Value Adjusted Predicted Value Residual Std. Residual Stud. Residual Deleted Residual Stud. Deleted Residual Mahal. Distance Cook's Distance Centered Leverage Value a. Dependent Variable: GPA Residuals Statistics a Std. Minimum Maximum Mean Deviation N E E E-0.47E E E
44 44 Graph Student. Residual vs. Predicted Values 3 Studentized Residual Unstandardized Predicted Value Graph Student. Residual vs. SAT 3 Studentized Residual SAT
45 45 Graph 3 Student. Residual vs. HRS Studentized Residual HRS
46 46
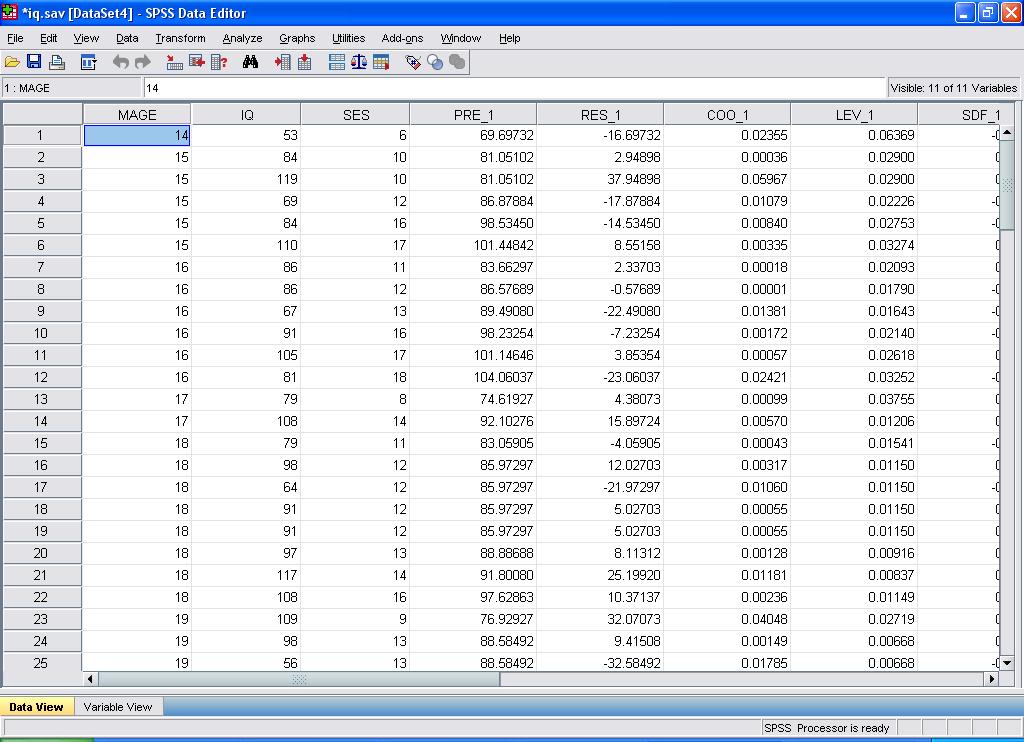
47 47 EDF 7405 Advanced Quantitative Methods in Educational Research MULTR.SAS This handout illustrates obtaining predicted values and residuals, as well as outlier, leverage, and influence diagnostics. The IQ-MAGE data are used. Follow the usual steps in the regression analysis (see pages 8-9 of the first section) until you see the following screen:

48 48 I have not included the printout from the analysis. Rather the following shows SPSS for Windows Data Editor. Not all of the added results fit on the screen. Here is a list of the names of the added variables PRE_ predicted values RES_ residuals COO_ Cook s distance LEV_ leverage value SDF_ DFFITS SDB0_ DFBETA for the intercept SDB_ DFBETA for the slope for the first variable in the model (MAGE in our case) SDB_ DFBETA for the slope for the second variable in the model (SES in our case)
49 49


50 50 It may be helpful to sort these results. To do so click Data to obtain I sorted the data by MAGE and SES.
51 5 EDF 7405 Advanced Quantitative Methods in Educational Research MULTR.SAS These results illustrate the use of multiple regression analysis with more than two quantitative independent variables. The dependent variable is IQ measured at age three. The independent variables are four variables measured during or right after birth: Birthweight (BW) the weight of the new born in grams; very large or very small weights may indicate health problems ( X ). APGAR a quick assessment of overall newborn well being. Low numbers may indicate problems ( X ). Intrapartum factors (IF) a measure of the quality of the delivery. Low numbers indicate problems occurred in the delivery ( X 3 ). Neonatal factors (NF) a measure of the health of the newborn. Low numbers The model is may indicate health problems ( X 4 ). Y X X X X or in terms of the abbreviations for the variables IQ BW APGAR IF NF 3 4 See pages 4-4 for directions to conduct a collinearity analysis and pages for directions to conduct an influence analysis.
52 5 Regression Descriptive Statistics IQ BW APGAR IF NF Std. Mean Deviation N Pearson Correlation Sig. (-tailed) N IQ BW APGAR IF NF IQ BW APGAR IF NF IQ BW APGAR IF NF Correlations IQ BW APGAR IF NF Model Variables Entered/Removed b Variables Variables Entered Removed Method NF, IF, APGAR, BW a. Enter a. All requested variables entered. b. Dependent Variable: IQ
53 53 Model Model Summary b Std. Error Adjusted of the R R Square R Square Estimate.380 a a. Predictors: (Constant), NF, IF, APGAR, BW b. Dependent Variable: IQ Model Regression Residual Total ANOVA b Sum of Mean Squares df Square F Sig a a. Predictors: (Constant), NF, IF, APGAR, BW b. Dependent Variable: IQ Model (Constant) BW APGAR IF NF a. Dependent Variable: IQ Unstandardized Coefficients Coefficients a Standardi zed Coefficien ts Collinearity Statistics B Std. Error Beta t Sig. Tolerance VIF E Collinearity Diagnostics a Model Dimension a. Dependent Variable: IQ Condition Variance Proportions Eigenvalue Index (Constant) BW APGAR IF NF E E
54 54 Predicted Value Std. Predicted Value Standard Error of Predicted Value Adjusted Predicted Value Residual Std. Residual Stud. Residual Deleted Residual Stud. Deleted Residual Mahal. Distance Cook's Distance Centered Leverage Value a. Dependent Variable: IQ Residuals Statistics a Std. Minimum Maximum Mean Deviation N E E Graph 3 Student. Residuals vs. Predicted Values Studentized Residual Unstandardized Predicted Value
55 55 Graph Studentized Residuals vs. BW 3 Studentized Residual BW Graph Studentized Residuals vs. APGAR 3 Studentized Residual APGAR
56 56 Graph Studentized Residuals vs. IF 3 Studentized Residual IF Graph Studentized Residuals vs. NF 3 Studentized Residual NF
57 57 The following results were copied from the SPSS Windows Data Editor Studentized deleted residuals: 0 most extreme values sdr_ BW APGAR IF NF IQ Residual cases deleted Leverage: 0 largest values lev_ BW APGAR IF NF IQ Leverage
58 58 Cook s distance: 0 largest values Coo_ BW APGAR IF NF IQ Cook s DFFITS: 0 most extreme values Sdf_ BW APGAR IF NF IQ DFFITS cases deleted
59 59 The following table is sorted by BW sdb0_ sdb_ sdb_ sdb3_ sdb4_ BW APGAR IF NF IQ DFBET Int DFBET BW DFBET APGAR DFBET IF DFBET NF
60
61

62 6 Reading Data into SPSS When you start SPSS the SPSS data editor appears: GO TO THE NEXT PAGE

63 63 Click file, then open, then data GO TO THE NEXT PAGE


64 64 You will get a Windows dialog box like this Press the down arrow in the Files of type slot and use the slide on the right hand side to locate the *.dat option as shown in the following display. Click on this option

65 65 This is the result on my computer: Use the down arrow in the Look in slot to find the folder in which you stored the file hsb.dat. On my computer the results looks like GO TO THE NEXT PAGE

66 66 Click hsb.dat. The result is the text import wizard GO TO THE NEXT PAGE

67 67 Click next and display GO TO THE NEXT PAGE

68 68 Click the fixed width radio button and then click next. You get GO TO THE NEXT PAGE
69 69 Click next again. You get GO TO THE NEXT PAGE

70 70 Click next again. You get GO TO THE NEXT PAGE
71 7 Click on the heading of the V column to highlight the column. In the variable name slot, type over V to change the name V to ACHIEVE. If numeric is not displayed in the data format slot, click on the down arrow to the data format slot, use the slide to locate the numeric option, and highlight the numeric option. Next click the heading of the V column to highlight the column. Then type over V to change the name V to LOC. If numeric is not displayed in the data format slot, click on the down arrow to the data format slot, use the slide to locate the numeric option, and highlight the numeric option.. Finally click the heading of the V3 column to highlight the column. Then type over V3 to change the name V to SELF. If numeric is not displayed in the data format slot, click on the down arrow to the data format slot, use the slide to locate the numeric option, and highlight that option.
72 7 Once you have completed changing the names and, if necessary selecting the numeric option, you will see GO TO THE NEXT PAGE


73 73 Click next and then click finish. The data editor will look like this Click, file, and then save. A WINDOWS dialog box like the following will be displayed
74 74 Type HSB in the file name slot and click save. This saves the file in the *.sav format. This format will allow you to open hsb.sav directly into SPSS without going through the process described in this handout. Now you can use SPSS to do the required analysis.
EDF 7405 Advanced Quantitative Methods in Educational Research. Data are available on IQ of the child and seven potential predictors.
 EDF 7405 Advanced Quantitative Methods in Educational Research Data are available on IQ of the child and seven potential predictors. Four are medical variables available at the birth of the child: Birthweight
LAB 3 INSTRUCTIONS SIMPLE LINEAR REGRESSION
 LAB 3 INSTRUCTIONS SIMPLE LINEAR REGRESSION In this lab you will first learn how to display the relationship between two quantitative variables with a scatterplot and also how to measure the strength of
Chapter 9 - Correlation and Regression
 Chapter 9 - Correlation and Regression 9. Scatter diagram of percentage of LBW infants (Y) and high-risk fertility rate (X ) in Vermont Health Planning Districts. 9.3 Correlation between percentage of
Regression ( Kemampuan Individu, Lingkungan kerja dan Motivasi)
") Regression (, Lingkungan kerja dan ) Descriptive Statistics Mean Std. Deviation N 3.87.333 32 3.47.672 32 3.78.585 32 s Pearson Sig. (-tailed) N Kemampuan Lingkungan Individu Kerja.000.432.49.432.000.3.49.3.000..000.000.000..000.000.000.
Regression (, Lingkungan kerja dan ) Descriptive Statistics Mean Std. Deviation N 3.87.333 32 3.47.672 32 3.78.585 32 s Pearson Sig. (-tailed) N Kemampuan Lingkungan Individu Kerja.000.432.49.432.000.3.49.3.000..000.000.000..000.000.000.
Item-Total Statistics. Corrected Item- Cronbach's Item Deleted. Total
 45 Lampiran 3 : Uji Validitas dan Reliabilitas Reliability Case Processing Summary N % Valid 75 00.0 Cases Excluded a 0.0 Total 75 00.0 a. Listwise deletion based on all variables in the procedure. Reliability
Advanced Quantitative Data Analysis
 Chapter 24 Advanced Quantitative Data Analysis Daniel Muijs Doing Regression Analysis in SPSS When we want to do regression analysis in SPSS, we have to go through the following steps: 1 As usual, we choose
Regression: Main Ideas Setting: Quantitative outcome with a quantitative explanatory variable. Example, cont.
 TCELL 9/4/205 36-309/749 Experimental Design for Behavioral and Social Sciences Simple Regression Example Male black wheatear birds carry stones to the nest as a form of sexual display. Soler et al. wanted
Simple Linear Regression
 Simple Linear Regression 1 Correlation indicates the magnitude and direction of the linear relationship between two variables. Linear Regression: variable Y (criterion) is predicted by variable X (predictor)
SPSS LAB FILE 1
 SPSS LAB FILE www.mcdtu.wordpress.com 1 www.mcdtu.wordpress.com 2 www.mcdtu.wordpress.com 3 OBJECTIVE 1: Transporation of Data Set to SPSS Editor INPUTS: Files: group1.xlsx, group1.txt PROCEDURE FOLLOWED:
Multiple Regression. More Hypothesis Testing. More Hypothesis Testing The big question: What we really want to know: What we actually know: We know:
 Multiple Regression Ψ320 Ainsworth More Hypothesis Testing What we really want to know: Is the relationship in the population we have selected between X & Y strong enough that we can use the relationship
36-309/749 Experimental Design for Behavioral and Social Sciences. Sep. 22, 2015 Lecture 4: Linear Regression
 36-309/749 Experimental Design for Behavioral and Social Sciences Sep. 22, 2015 Lecture 4: Linear Regression TCELL Simple Regression Example Male black wheatear birds carry stones to the nest as a form
Using SPSS for One Way Analysis of Variance
 Using SPSS for One Way Analysis of Variance This tutorial will show you how to use SPSS version 12 to perform a one-way, between- subjects analysis of variance and related post-hoc tests. This tutorial
1 Correlation and Inference from Regression
 1 Correlation and Inference from Regression Reading: Kennedy (1998) A Guide to Econometrics, Chapters 4 and 6 Maddala, G.S. (1992) Introduction to Econometrics p. 170-177 Moore and McCabe, chapter 12 is
Regression. Notes. Page 1. Output Created Comments 25-JAN :29:55
 REGRESSION /MISSING LISTWISE /STATISTICS COEFF OUTS CI(95) BCOV R ANOVA /CRITERIA=PIN(.05) POUT(.10) /NOORIGIN /DEPENDENT favorability /METHOD=ENTER Zcontemp ZAnxious6 zallcontact. Regression Notes Output
Area1 Scaled Score (NAPLEX) .535 ** **.000 N. Sig. (2-tailed)
 .535 ** **.000 N. Sig. (2-tailed)") Institutional Assessment Report Texas Southern University College of Pharmacy and Health Sciences "An Analysis of 2013 NAPLEX, P4-Comp. Exams and P3 courses The following analysis illustrates relationships
Institutional Assessment Report Texas Southern University College of Pharmacy and Health Sciences "An Analysis of 2013 NAPLEX, P4-Comp. Exams and P3 courses The following analysis illustrates relationships
1 A Review of Correlation and Regression
 1 A Review of Correlation and Regression SW, Chapter 12 Suppose we select n = 10 persons from the population of college seniors who plan to take the MCAT exam. Each takes the test, is coached, and then
4:3 LEC - PLANNED COMPARISONS AND REGRESSION ANALYSES
 4:3 LEC - PLANNED COMPARISONS AND REGRESSION ANALYSES FOR SINGLE FACTOR BETWEEN-S DESIGNS Planned or A Priori Comparisons We previously showed various ways to test all possible pairwise comparisons for
Daniel Boduszek University of Huddersfield
 Daniel Boduszek University of Huddersfield d.boduszek@hud.ac.uk Introduction to moderator effects Hierarchical Regression analysis with continuous moderator Hierarchical Regression analysis with categorical
Research Design - - Topic 19 Multiple regression: Applications 2009 R.C. Gardner, Ph.D.
 Research Design - - Topic 19 Multiple regression: Applications 2009 R.C. Gardner, Ph.D. Curve Fitting Mediation analysis Moderation Analysis 1 Curve Fitting The investigation of non-linear functions using
Review of Multiple Regression
 Ronald H. Heck 1 Let s begin with a little review of multiple regression this week. Linear models [e.g., correlation, t-tests, analysis of variance (ANOVA), multiple regression, path analysis, multivariate
IT 403 Practice Problems (2-2) Answers
 Answers") IT 403 Practice Problems (2-2) Answers #1. Which of the following is correct with respect to the correlation coefficient (r) and the slope of the leastsquares regression line (Choose one)? a. They will
IT 403 Practice Problems (2-2) Answers #1. Which of the following is correct with respect to the correlation coefficient (r) and the slope of the leastsquares regression line (Choose one)? a. They will
SPSS Output. ANOVA a b Residual Coefficients a Standardized Coefficients
 SPSS Output Homework 1-1e ANOVA a Sum of Squares df Mean Square F Sig. 1 Regression 351.056 1 351.056 11.295.002 b Residual 932.412 30 31.080 Total 1283.469 31 a. Dependent Variable: Sexual Harassment
Chapter Goals. To understand the methods for displaying and describing relationship among variables. Formulate Theories.
 Chapter Goals To understand the methods for displaying and describing relationship among variables. Formulate Theories Interpret Results/Make Decisions Collect Data Summarize Results Chapter 7: Is There
Introduction to Regression
 Regression Introduction to Regression If two variables covary, we should be able to predict the value of one variable from another. Correlation only tells us how much two variables covary. In regression,
Interactions and Centering in Regression: MRC09 Salaries for graduate faculty in psychology
 Psychology 308c Dale Berger Interactions and Centering in Regression: MRC09 Salaries for graduate faculty in psychology This example illustrates modeling an interaction with centering and transformations.
Module 8: Linear Regression. The Applied Research Center
 Module 8: Linear Regression The Applied Research Center Module 8 Overview } Purpose of Linear Regression } Scatter Diagrams } Regression Equation } Regression Results } Example Purpose } To predict scores
Sociology 593 Exam 1 February 14, 1997
 Sociology 9 Exam February, 997 I. True-False. ( points) Indicate whether the following statements are true or false. If false, briefly explain why.. There are IVs in a multiple regression model. If the
Regression Diagnostics Procedures
 Regression Diagnostics Procedures ASSUMPTIONS UNDERLYING REGRESSION/CORRELATION NORMALITY OF VARIANCE IN Y FOR EACH VALUE OF X For any fixed value of the independent variable X, the distribution of the
Multiple linear regression S6
 Basic medical statistics for clinical and experimental research Multiple linear regression S6 Katarzyna Jóźwiak k.jozwiak@nki.nl November 15, 2017 1/42 Introduction Two main motivations for doing multiple
1 Introduction to Minitab
 1 Introduction to Minitab Minitab is a statistical analysis software package. The software is freely available to all students and is downloadable through the Technology Tab at my.calpoly.edu. When you
Nonlinear Regression. Summary. Sample StatFolio: nonlinear reg.sgp
 Nonlinear Regression Summary... 1 Analysis Summary... 4 Plot of Fitted Model... 6 Response Surface Plots... 7 Analysis Options... 10 Reports... 11 Correlation Matrix... 12 Observed versus Predicted...
Regression Model Building
 Regression Model Building Setting: Possibly a large set of predictor variables (including interactions). Goal: Fit a parsimonious model that explains variation in Y with a small set of predictors Automated
Key Concepts. Correlation (Pearson & Spearman) & Linear Regression. Assumptions. Correlation parametric & non-para. Correlation
 & Linear Regression. Assumptions. Correlation parametric & non-para. Correlation") Correlation (Pearson & Spearman) & Linear Regression Azmi Mohd Tamil Key Concepts Correlation as a statistic Positive and Negative Bivariate Correlation Range Effects Outliers Regression & Prediction Directionality
Correlation (Pearson & Spearman) & Linear Regression Azmi Mohd Tamil Key Concepts Correlation as a statistic Positive and Negative Bivariate Correlation Range Effects Outliers Regression & Prediction Directionality
x3,..., Multiple Regression β q α, β 1, β 2, β 3,..., β q in the model can all be estimated by least square estimators
 Multiple Regression Relating a response (dependent, input) y to a set of explanatory (independent, output, predictor) variables x, x 2, x 3,, x q. A technique for modeling the relationship between variables.
STATISTICS 110/201 PRACTICE FINAL EXAM
 STATISTICS 110/201 PRACTICE FINAL EXAM Questions 1 to 5: There is a downloadable Stata package that produces sequential sums of squares for regression. In other words, the SS is built up as each variable
LAB 5 INSTRUCTIONS LINEAR REGRESSION AND CORRELATION
 LAB 5 INSTRUCTIONS LINEAR REGRESSION AND CORRELATION In this lab you will learn how to use Excel to display the relationship between two quantitative variables, measure the strength and direction of the
Chapter 10-Regression
 Chapter 10-Regression 10.1 Regression equation predicting infant mortality from income Y = Infant mortality X = Income Y = 6.70 s Y = 0.698 s 2 Y = 0.487 X = 46.00 s X = 6.289 s 2 X = 39.553 cov XY = 2.7245
*************NO YOGA!!!!!!!************************************.
 *************NO YOGA!!!!!!!************************************. temporary. select if human gt 1 and Q_TotalDuration gt 239 and subjectnum ne 672 and subj ectnum ne 115 and subjectnum ne 104 and subjectnum
Psychology Seminar Psych 406 Dr. Jeffrey Leitzel
 Psychology Seminar Psych 406 Dr. Jeffrey Leitzel Structural Equation Modeling Topic 1: Correlation / Linear Regression Outline/Overview Correlations (r, pr, sr) Linear regression Multiple regression interpreting
Correlations. Notes. Output Created Comments 04-OCT :34:52
 Correlations Output Created Comments Input Missing Value Handling Syntax Resources Notes Data Active Dataset Filter Weight Split File N of Rows in Working Data File Definition of Missing Cases Used Processor
Correlation and simple linear regression S5
 Basic medical statistics for clinical and eperimental research Correlation and simple linear regression S5 Katarzyna Jóźwiak k.jozwiak@nki.nl November 15, 2017 1/41 Introduction Eample: Brain size and
Inference for Regression Inference about the Regression Model and Using the Regression Line, with Details. Section 10.1, 2, 3
 Inference for Regression Inference about the Regression Model and Using the Regression Line, with Details Section 10.1, 2, 3 Basic components of regression setup Target of inference: linear dependency
Univariate analysis. Simple and Multiple Regression. Univariate analysis. Simple Regression How best to summarise the data?
 Univariate analysis Example - linear regression equation: y = ax + c Least squares criteria ( yobs ycalc ) = yobs ( ax + c) = minimum Simple and + = xa xc xy xa + nc = y Solve for a and c Univariate analysis
Simple Linear Regression: One Quantitative IV
 Simple Linear Regression: One Quantitative IV Linear regression is frequently used to explain variation observed in a dependent variable (DV) with theoretically linked independent variables (IV). For example,
Practical Biostatistics
 Practical Biostatistics Clinical Epidemiology, Biostatistics and Bioinformatics AMC Multivariable regression Day 5 Recap Describing association: Correlation Parametric technique: Pearson (PMCC) Non-parametric:
ASSIGNMENT 3 SIMPLE LINEAR REGRESSION. Old Faithful
 ASSIGNMENT 3 SIMPLE LINEAR REGRESSION In the simple linear regression model, the mean of a response variable is a linear function of an explanatory variable. The model and associated inferential tools
Box-Cox Transformations
 Box-Cox Transformations Revised: 10/10/2017 Summary... 1 Data Input... 3 Analysis Summary... 3 Analysis Options... 5 Plot of Fitted Model... 6 MSE Comparison Plot... 8 MSE Comparison Table... 9 Skewness
In Class Review Exercises Vartanian: SW 540
 In Class Review Exercises Vartanian: SW 540 1. Given the following output from an OLS model looking at income, what is the slope and intercept for those who are black and those who are not black? b SE
Parametric Test. Multiple Linear Regression Spatial Application I: State Homicide Rates Equations taken from Zar, 1984.
 Multiple Linear Regression Spatial Application I: State Homicide Rates Equations taken from Zar, 984. y ˆ = a + b x + b 2 x 2K + b n x n where n is the number of variables Example: In an earlier bivariate
M&M Exponentials Exponential Function
 M&M Exponentials Exponential Function Teacher Guide Activity Overview In M&M Exponentials students will experiment with growth and decay functions. Students will also graph their experimental data and
Topic 1. Definitions
 S Topic. Definitions. Scalar A scalar is a number. 2. Vector A vector is a column of numbers. 3. Linear combination A scalar times a vector plus a scalar times a vector, plus a scalar times a vector...
Multiple Regression. Inference for Multiple Regression and A Case Study. IPS Chapters 11.1 and W.H. Freeman and Company
 Multiple Regression Inference for Multiple Regression and A Case Study IPS Chapters 11.1 and 11.2 2009 W.H. Freeman and Company Objectives (IPS Chapters 11.1 and 11.2) Multiple regression Data for multiple
Sociology 593 Exam 1 February 17, 1995
 Sociology 593 Exam 1 February 17, 1995 I. True-False. (25 points) Indicate whether the following statements are true or false. If false, briefly explain why. 1. A researcher regressed Y on. When he plotted
Multiple Regression and Model Building (cont d) + GIS Lecture 21 3 May 2006 R. Ryznar
 + GIS Lecture 21 3 May 2006 R. Ryznar") Multiple Regression and Model Building (cont d) + GIS 11.220 Lecture 21 3 May 2006 R. Ryznar Model Summary b 1-[(SSE/n-k+1)/(SST/n-1)] Model 1 Adjusted Std. Error of R R Square R Square the Estimate.991
Multiple Regression and Model Building (cont d) + GIS 11.220 Lecture 21 3 May 2006 R. Ryznar Model Summary b 1-[(SSE/n-k+1)/(SST/n-1)] Model 1 Adjusted Std. Error of R R Square R Square the Estimate.991
9. Linear Regression and Correlation
 9. Linear Regression and Correlation Data: y a quantitative response variable x a quantitative explanatory variable (Chap. 8: Recall that both variables were categorical) For example, y = annual income,
Any of 27 linear and nonlinear models may be fit. The output parallels that of the Simple Regression procedure.
 STATGRAPHICS Rev. 9/13/213 Calibration Models Summary... 1 Data Input... 3 Analysis Summary... 5 Analysis Options... 7 Plot of Fitted Model... 9 Predicted Values... 1 Confidence Intervals... 11 Observed
Ridge Regression. Summary. Sample StatFolio: ridge reg.sgp. STATGRAPHICS Rev. 10/1/2014
 Ridge Regression Summary... 1 Data Input... 4 Analysis Summary... 5 Analysis Options... 6 Ridge Trace... 7 Regression Coefficients... 8 Standardized Regression Coefficients... 9 Observed versus Predicted...
Appendix A Summary of Tasks. Appendix Table of Contents
 Appendix A Summary of Tasks Appendix Table of Contents Reporting Tasks...357 ListData...357 Tables...358 Graphical Tasks...358 BarChart...358 PieChart...359 Histogram...359 BoxPlot...360 Probability Plot...360
y response variable x 1, x 2,, x k -- a set of explanatory variables
 11. Multiple Regression and Correlation y response variable x 1, x 2,, x k -- a set of explanatory variables In this chapter, all variables are assumed to be quantitative. Chapters 12-14 show how to incorporate
Independent Samples ANOVA
 Independent Samples ANOVA In this example students were randomly assigned to one of three mnemonics (techniques for improving memory) rehearsal (the control group; simply repeat the words), visual imagery
Multiple Linear Regression II. Lecture 8. Overview. Readings
 Multiple Linear Regression II Lecture 8 Image source:https://commons.wikimedia.org/wiki/file:autobunnskr%c3%a4iz-ro-a201.jpg Survey Research & Design in Psychology James Neill, 2016 Creative Commons Attribution
Multiple Linear Regression II. Lecture 8. Overview. Readings. Summary of MLR I. Summary of MLR I. Summary of MLR I
 Multiple Linear Regression II Lecture 8 Image source:https://commons.wikimedia.org/wiki/file:autobunnskr%c3%a4iz-ro-a201.jpg Survey Research & Design in Psychology James Neill, 2016 Creative Commons Attribution
SPSS Guide For MMI 409
 SPSS Guide For MMI 409 by John Wong March 2012 Preface Hopefully, this document can provide some guidance to MMI 409 students on how to use SPSS to solve many of the problems covered in the D Agostino
Regression Analysis and Forecasting Prof. Shalabh Department of Mathematics and Statistics Indian Institute of Technology-Kanpur
 Regression Analysis and Forecasting Prof. Shalabh Department of Mathematics and Statistics Indian Institute of Technology-Kanpur Lecture 10 Software Implementation in Simple Linear Regression Model using
CHAPTER 10. Regression and Correlation
 CHAPTER 10 Regression and Correlation In this Chapter we assess the strength of the linear relationship between two continuous variables. If a significant linear relationship is found, the next step would
Sociology Research Statistics I Final Exam Answer Key December 15, 1993
 Sociology 592 - Research Statistics I Final Exam Answer Key December 15, 1993 Where appropriate, show your work - partial credit may be given. (On the other hand, don't waste a lot of time on excess verbiage.)
Step 2: Select Analyze, Mixed Models, and Linear.
 Example 1a. 20 employees were given a mood questionnaire on Monday, Wednesday and again on Friday. The data will be first be analyzed using a Covariance Pattern model. Step 1: Copy Example1.sav data file
Unit 6 - Introduction to linear regression
 Unit 6 - Introduction to linear regression Suggested reading: OpenIntro Statistics, Chapter 7 Suggested exercises: Part 1 - Relationship between two numerical variables: 7.7, 7.9, 7.11, 7.13, 7.15, 7.25,
Can you tell the relationship between students SAT scores and their college grades?
 Correlation One Challenge Can you tell the relationship between students SAT scores and their college grades? A: The higher SAT scores are, the better GPA may be. B: The higher SAT scores are, the lower
STAT 3900/4950 MIDTERM TWO Name: Spring, 2015 (print: first last ) Covered topics: Two-way ANOVA, ANCOVA, SLR, MLR and correlation analysis
 Covered topics: Two-way ANOVA, ANCOVA, SLR, MLR and correlation analysis") STAT 3900/4950 MIDTERM TWO Name: Spring, 205 (print: first last ) Covered topics: Two-way ANOVA, ANCOVA, SLR, MLR and correlation analysis Instructions: You may use your books, notes, and SPSS/SAS. NO
STAT 3900/4950 MIDTERM TWO Name: Spring, 205 (print: first last ) Covered topics: Two-way ANOVA, ANCOVA, SLR, MLR and correlation analysis Instructions: You may use your books, notes, and SPSS/SAS. NO
Introduction to Regression
 Introduction to Regression Using Mult Lin Regression Derived variables Many alternative models Which model to choose? Model Criticism Modelling Objective Model Details Data and Residuals Assumptions 1
Multiple Regression Examples
 Multiple Regression Examples Example: Tree data. we have seen that a simple linear regression of usable volume on diameter at chest height is not suitable, but that a quadratic model y = β 0 + β 1 x +
Multiple Linear Regression II. Lecture 8. Overview. Readings
 Multiple Linear Regression II Lecture 8 Image source:http://commons.wikimedia.org/wiki/file:vidrarias_de_laboratorio.jpg Survey Research & Design in Psychology James Neill, 2015 Creative Commons Attribution
Multiple Linear Regression II. Lecture 8. Overview. Readings. Summary of MLR I. Summary of MLR I. Summary of MLR I
 Multiple Linear Regression II Lecture 8 Image source:http://commons.wikimedia.org/wiki/file:vidrarias_de_laboratorio.jpg Survey Research & Design in Psychology James Neill, 2015 Creative Commons Attribution
Taguchi Method and Robust Design: Tutorial and Guideline
 Taguchi Method and Robust Design: Tutorial and Guideline CONTENT 1. Introduction 2. Microsoft Excel: graphing 3. Microsoft Excel: Regression 4. Microsoft Excel: Variance analysis 5. Robust Design: An Example
SOS3003 Applied data analysis for social science Lecture note Erling Berge Department of sociology and political science NTNU.
 SOS3003 Applied data analysis for social science Lecture note 08-00 Erling Berge Department of sociology and political science NTNU Erling Berge 00 Literature Logistic regression II Hamilton Ch 7 p7-4
Checking model assumptions with regression diagnostics
 @graemeleehickey www.glhickey.com graeme.hickey@liverpool.ac.uk Checking model assumptions with regression diagnostics Graeme L. Hickey University of Liverpool Conflicts of interest None Assistant Editor
Linear Regression Measurement & Evaluation of HCC Systems
 Linear Regression Measurement & Evaluation of HCC Systems Linear Regression Today s goal: Evaluate the effect of multiple variables on an outcome variable (regression) Outline: - Basic theory - Simple
REVIEW 8/2/2017 陈芳华东师大英语系
 REVIEW Hypothesis testing starts with a null hypothesis and a null distribution. We compare what we have to the null distribution, if the result is too extreme to belong to the null distribution (p
Chapter 19: Logistic regression
 Chapter 19: Logistic regression Self-test answers SELF-TEST Rerun this analysis using a stepwise method (Forward: LR) entry method of analysis. The main analysis To open the main Logistic Regression dialog
Steps to take to do the descriptive part of regression analysis:
 STA 2023 Simple Linear Regression: Least Squares Model Steps to take to do the descriptive part of regression analysis: A. Plot the data on a scatter plot. Describe patterns: 1. Is there a strong, moderate,
One-Way ANOVA. Some examples of when ANOVA would be appropriate include:
 One-Way ANOVA 1. Purpose Analysis of variance (ANOVA) is used when one wishes to determine whether two or more groups (e.g., classes A, B, and C) differ on some outcome of interest (e.g., an achievement
MULTIPLE LINEAR REGRESSION IN MINITAB
 MULTIPLE LINEAR REGRESSION IN MINITAB This document shows a complicated Minitab multiple regression. It includes descriptions of the Minitab commands, and the Minitab output is heavily annotated. Comments
SPSS and its usage 2073/06/07 06/12. Dr. Bijay Lal Pradhan Dr Bijay Lal Pradhan
 SPSS and its usage 2073/06/07 06/12 Dr. Bijay Lal Pradhan bijayprad@gmail.com http://bijaylalpradhan.com.np Ground Rule Mobile Penalty System Involvement Object of session I Define Statistics and SPSS
: The model hypothesizes a relationship between the variables. The simplest probabilistic model: or.
 Chapter Simple Linear Regression : comparing means across groups : presenting relationships among numeric variables. Probabilistic Model : The model hypothesizes an relationship between the variables.
Topic 18: Model Selection and Diagnostics
 Topic 18: Model Selection and Diagnostics Variable Selection We want to choose a best model that is a subset of the available explanatory variables Two separate problems 1. How many explanatory variables
Multicollinearity Exercise
 Multicollinearity Exercise Use the attached SAS output to answer the questions. [OPTIONAL: Copy the SAS program below into the SAS editor window and run it.] You do not need to submit any output, so there
Scatterplots. 3.1: Scatterplots & Correlation. Scatterplots. Explanatory & Response Variables. Section 3.1 Scatterplots and Correlation
 3.1: Scatterplots & Correlation Scatterplots A scatterplot shows the relationship between two quantitative variables measured on the same individuals. The values of one variable appear on the horizontal
Introduction and Single Predictor Regression. Correlation
 Introduction and Single Predictor Regression Dr. J. Kyle Roberts Southern Methodist University Simmons School of Education and Human Development Department of Teaching and Learning Correlation A correlation
FIN822 project 2 Project 2 contains part I and part II. (Due on November 10, 2008)
") FIN822 project 2 Project 2 contains part I and part II. (Due on November 10, 2008) Part I Logit Model in Bankruptcy Prediction You do not believe in Altman and you decide to estimate the bankruptcy prediction
FIN822 project 2 Project 2 contains part I and part II. (Due on November 10, 2008) Part I Logit Model in Bankruptcy Prediction You do not believe in Altman and you decide to estimate the bankruptcy prediction
Ref.: Spring SOS3003 Applied data analysis for social science Lecture note
 SOS3003 Applied data analysis for social science Lecture note 05-2010 Erling Berge Department of sociology and political science NTNU Spring 2010 Erling Berge 2010 1 Literature Regression criticism I Hamilton
Designing Multilevel Models Using SPSS 11.5 Mixed Model. John Painter, Ph.D.
 Designing Multilevel Models Using SPSS 11.5 Mixed Model John Painter, Ph.D. Jordan Institute for Families School of Social Work University of North Carolina at Chapel Hill 1 Creating Multilevel Models
Washington State Test
 Technical Report # 1101 easycbm Reading Criterion Related Validity Evidence: Washington State Test 2009-2010 Daniel Anderson Julie Alonzo Gerald Tindal University of Oregon Published by Behavioral Research
Determining the Conductivity of Standard Solutions
 Determining the Conductivity of Standard Solutions by Anna Cole and Shannon Clement Louisiana Curriculum Framework Content Strand: Science as Inquiry, Physical Science Grade Level 11-12 Objectives: 1.
Sociology 593 Exam 2 Answer Key March 28, 2002
 Sociology 59 Exam Answer Key March 8, 00 I. True-False. (0 points) Indicate whether the following statements are true or false. If false, briefly explain why.. A variable is called CATHOLIC. This probably
Investigating Models with Two or Three Categories
 Ronald H. Heck and Lynn N. Tabata 1 Investigating Models with Two or Three Categories For the past few weeks we have been working with discriminant analysis. Let s now see what the same sort of model might
Latent Growth Models 1
 1 We will use the dataset bp3, which has diastolic blood pressure measurements at four time points for 256 patients undergoing three types of blood pressure medication. These are our observed variables:
CAMPBELL COLLABORATION
 CAMPBELL COLLABORATION Random and Mixed-effects Modeling C Training Materials 1 Overview Effect-size estimates Random-effects model Mixed model C Training Materials Effect sizes Suppose we have computed
Statistics 5100 Spring 2018 Exam 1
 Statistics 5100 Spring 2018 Exam 1 Directions: You have 60 minutes to complete the exam. Be sure to answer every question, and do not spend too much time on any part of any question. Be concise with all
Polynomial Regression
 Polynomial Regression Summary... 1 Analysis Summary... 3 Plot of Fitted Model... 4 Analysis Options... 6 Conditional Sums of Squares... 7 Lack-of-Fit Test... 7 Observed versus Predicted... 8 Residual Plots...