Multiple Regression and Model Building (cont d) + GIS Lecture 21 3 May 2006 R. Ryznar
|
|
|
- Milton Chambers
- 6 years ago
- Views:
Transcription
1 Multiple Regression and Model Building (cont d) + GIS Lecture 21 3 May 2006 R. Ryznar
2 Model Summary b 1-[(SSE/n-k+1)/(SST/n-1)] Model 1 Adjusted Std. Error of R R Square R Square the Estimate.991 a a. Predictors: (Constant), SizeSquared, HomeSize SSE Model 1 Regression Residual Total b. Dependent Variable: EnergyUse R 2 =SSR/SST or 1-(SSE/SST) ANOVA b Sum of Squares df Mean Square F Sig a a. Predictors: (Constant), SizeSquared, HomeSize b. Dependent Variable: EnergyUse Coefficients a S 2 = SSE/n (k + 1) Sometimes called MSE F= R 2 /k (1-R 2 )/[n-(k+1)] Model 1 (Constant) HomeSize SizeSquared a. Dependent Variable: EnergyUse Unstandardized Coefficients Standardized Coefficients B Std. Error Beta t Sig y = 2 β + β x + β + ε x K=number of X variables
3 y 0 1 = β + β x + ε Model 1 Model Summary b Adjusted Std. Error of R R Square R Square the Estimate.912 a a. Predictors: (Constant), HomeSize b. Dependent Variable: EnergyUse ANOVA b Model 1 Regression Residual Total Sum of Squares df Mean Square F Sig a a. Predictors: (Constant), HomeSize b. Dependent Variable: EnergyUse Model 1 (Constant) HomeSize Unstandardized Coefficients a. Dependent Variable: EnergyUse Coefficients a Standardized Coefficients B Std. Error Beta t Sig
4 Correlation with Y (r) (survival time) x x x x X variables SSE R 2 X 1 (Blood Clotting) X 2 (Prognostic Ind.) X 3 (Enzyme Func.) X 4 (Liver Func.) X 1, X X 1, X X 1, X x 1 x 2 x 3 x 4 x x x x 4 1 X 2, X X 2, X X 3, X X 1, X 2, X X 1, X 2, X X 1, X 3, X X 2, X 3, X X 1, X 2, X 3, X
5 Standardized coefficients used to establish a common metric for comparison income = α + β years income = α + 2( years of education) + β ( I. Q.) 1 ( 2 of education) + 1( I. Q.) + ε + ε Can you say that years of education is more important than I.Q.? Of course, you cannot, because they are not measured with the same metric. One way to solve this problem of comparing beta coefficients is to use standardized coefficients. Standardized coefficients are calculated in a regression equation using the z-scores of the dependent (Y) and independent (X) variables.
6 Interpreting the standardized coefficients One standard deviation of x 1 will increase y by the standardized coefficient associated with x 1. Model 1 (Constant) HomeSize SizeSquared a. Dependent Variable: EnergyUse EnergyUse HomeSize SizeSquared Valid N (listwise) Descriptive Statistics Coefficients a Unstandardized Coefficients Standardized Coefficients B Std. Error Beta t Sig N Mean Std. Deviation Every increase of 1 s.d. in X 1 increases the Y by s.d., i.e., * = or using the unstandardized coefficients * = (rounding errors but they should be equal)
7 Dummy variables Income = * ASIAMER + 2.5* CAUCAS + 0.7* HISPAN + 2.2* OTHER +.95* 12 yrs of educ
8 Multicolinearity Data for 67 Florida Counties fem = Percentage of households headed by a female inc = Median income hs = Percentage of residents over 25 years old with at least a high school diploma urb = Percentage of residents living in an urban environment cr = Number of crimes per capita unemrt = Unemployment rate
9 unemrt cr urb hs un inc fem fem inc un hs urb cr unemrt
10 Correlations fem inc un hs urb cr unemrt fem Pearson Correlation ** ** -.435** Sig. (2-tailed) N inc Pearson Correlation -.561** **.730**.432** Sig. (2-tailed) N un Pearson Correlation * ** Sig. (2-tailed) N hs Pearson Correlation -.511**.793** -.250* 1.791**.468** -.250* Sig. (2-tailed) N urb Pearson Correlation -.435**.730** ** 1.678** Sig. (2-tailed) N cr Pearson Correlation ** **.678** Sig. (2-tailed) N unemrt Pearson Correlation ** -.250* Sig. (2-tailed) N **. Correlation is significant at the 0.01 level (2-tailed). *. Correlation is significant at the 0.05 level (2-tailed).
11 Detecting Multicollinearity with the Variance Inflation Factor (VIF) The percentage of each variable not related to the other predictors. Model 1 (Constant) fem inc hs unemrt urb a. Dependent Variable: cr Unstandardized Coefficients Coefficients a Standardized Coefficients Collinearity Statistics B Std. Error Beta t Sig. Tolerance VIF E VIF = 1/Tolerance. If Tolerance =1, then VIF =1. As VIF becomes larger, greater overlap exists among predictors.
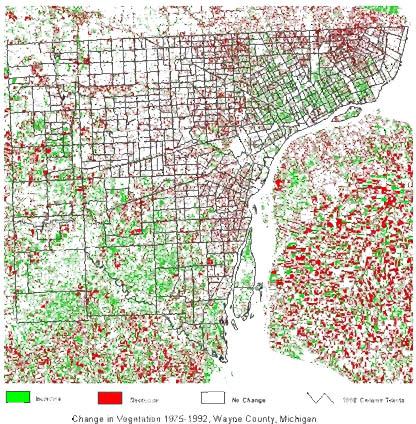
12 Z scores for crime per capita

13 Z scores for % living in urbanized area

14
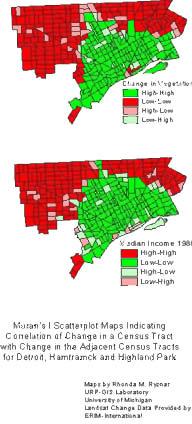
15 Positive and significant z-score indicates spatial clustering of high values. Negative and significant z-score indicates spatial clustering of low values.
16 Final Paper data in GIS ma_eqv.dbf ma_eqv_intro.txt MA Kind of Community (KOC) data for all cities/towns in MA A brief explanation of the MA Department of Revenue s Kind-of- Community classification of MA cities and towns GIS Spatial Data Set (formatted as ArcGIS shapefiles and located in the gis sub-directory): ma_towns00 majmhda1 maj_pop1 p525_ma majmhdcl.avl Town boundaries for MA cities and towns Major roads for MA 9see class for road type distinctions) Major MA lakes and ponds (for better cartography) Boundaries for MA PUMA regions Pre-configured classification and symbols for MA major roads
Multiple Regression and Model Building Lecture 20 1 May 2006 R. Ryznar
 Multiple Regression and Model Building 11.220 Lecture 20 1 May 2006 R. Ryznar Building Models: Making Sure the Assumptions Hold 1. There is a linear relationship between the explanatory (independent) variable(s)
x3,..., Multiple Regression β q α, β 1, β 2, β 3,..., β q in the model can all be estimated by least square estimators
 Multiple Regression Relating a response (dependent, input) y to a set of explanatory (independent, output, predictor) variables x, x 2, x 3,, x q. A technique for modeling the relationship between variables.
Regression ( Kemampuan Individu, Lingkungan kerja dan Motivasi)
") Regression (, Lingkungan kerja dan ) Descriptive Statistics Mean Std. Deviation N 3.87.333 32 3.47.672 32 3.78.585 32 s Pearson Sig. (-tailed) N Kemampuan Lingkungan Individu Kerja.000.432.49.432.000.3.49.3.000..000.000.000..000.000.000.
Regression (, Lingkungan kerja dan ) Descriptive Statistics Mean Std. Deviation N 3.87.333 32 3.47.672 32 3.78.585 32 s Pearson Sig. (-tailed) N Kemampuan Lingkungan Individu Kerja.000.432.49.432.000.3.49.3.000..000.000.000..000.000.000.
Multiple Regression. More Hypothesis Testing. More Hypothesis Testing The big question: What we really want to know: What we actually know: We know:
 Multiple Regression Ψ320 Ainsworth More Hypothesis Testing What we really want to know: Is the relationship in the population we have selected between X & Y strong enough that we can use the relationship
Item-Total Statistics. Corrected Item- Cronbach's Item Deleted. Total
 45 Lampiran 3 : Uji Validitas dan Reliabilitas Reliability Case Processing Summary N % Valid 75 00.0 Cases Excluded a 0.0 Total 75 00.0 a. Listwise deletion based on all variables in the procedure. Reliability
In Class Review Exercises Vartanian: SW 540
 In Class Review Exercises Vartanian: SW 540 1. Given the following output from an OLS model looking at income, what is the slope and intercept for those who are black and those who are not black? b SE
SPSS Output. ANOVA a b Residual Coefficients a Standardized Coefficients
 SPSS Output Homework 1-1e ANOVA a Sum of Squares df Mean Square F Sig. 1 Regression 351.056 1 351.056 11.295.002 b Residual 932.412 30 31.080 Total 1283.469 31 a. Dependent Variable: Sexual Harassment
Model Building Chap 5 p251
 Model Building Chap 5 p251 Models with one qualitative variable, 5.7 p277 Example 4 Colours : Blue, Green, Lemon Yellow and white Row Blue Green Lemon Insects trapped 1 0 0 1 45 2 0 0 1 59 3 0 0 1 48 4
Sociology 593 Exam 1 February 14, 1997
 Sociology 9 Exam February, 997 I. True-False. ( points) Indicate whether the following statements are true or false. If false, briefly explain why.. There are IVs in a multiple regression model. If the
Area1 Scaled Score (NAPLEX) .535 ** **.000 N. Sig. (2-tailed)
 .535 ** **.000 N. Sig. (2-tailed)") Institutional Assessment Report Texas Southern University College of Pharmacy and Health Sciences "An Analysis of 2013 NAPLEX, P4-Comp. Exams and P3 courses The following analysis illustrates relationships
Institutional Assessment Report Texas Southern University College of Pharmacy and Health Sciences "An Analysis of 2013 NAPLEX, P4-Comp. Exams and P3 courses The following analysis illustrates relationships
Parametric Test. Multiple Linear Regression Spatial Application I: State Homicide Rates Equations taken from Zar, 1984.
 Multiple Linear Regression Spatial Application I: State Homicide Rates Equations taken from Zar, 984. y ˆ = a + b x + b 2 x 2K + b n x n where n is the number of variables Example: In an earlier bivariate
Correlation and simple linear regression S5
 Basic medical statistics for clinical and eperimental research Correlation and simple linear regression S5 Katarzyna Jóźwiak k.jozwiak@nki.nl November 15, 2017 1/41 Introduction Eample: Brain size and
Topic 18: Model Selection and Diagnostics
 Topic 18: Model Selection and Diagnostics Variable Selection We want to choose a best model that is a subset of the available explanatory variables Two separate problems 1. How many explanatory variables
ESP 178 Applied Research Methods. 2/23: Quantitative Analysis
 ESP 178 Applied Research Methods 2/23: Quantitative Analysis Data Preparation Data coding create codebook that defines each variable, its response scale, how it was coded Data entry for mail surveys and
Lecture 3: Multivariate Regression
 Lecture 3: Multivariate Regression Rates, cont. Two weeks ago, we modeled state homicide rates as being dependent on one variable: poverty. In reality, we know that state homicide rates depend on numerous
Multivariate Correlational Analysis: An Introduction
 Assignment. Multivariate Correlational Analysis: An Introduction Mertler & Vanetta, Chapter 7 Kachigan, Chapter 4, pps 180-193 Terms you should know. Multiple Regression Linear Equations Least Squares
Multiple linear regression S6
 Basic medical statistics for clinical and experimental research Multiple linear regression S6 Katarzyna Jóźwiak k.jozwiak@nki.nl November 15, 2017 1/42 Introduction Two main motivations for doing multiple
EDF 7405 Advanced Quantitative Methods in Educational Research MULTR.SAS
 EDF 7405 Advanced Quantitative Methods in Educational Research MULTR.SAS The data used in this example describe teacher and student behavior in 8 classrooms. The variables are: Y percentage of interventions
Predictive Analytics : QM901.1x Prof U Dinesh Kumar, IIMB. All Rights Reserved, Indian Institute of Management Bangalore
 What is Multiple Linear Regression Several independent variables may influence the change in response variable we are trying to study. When several independent variables are included in the equation, the
Ordinary Least Squares Regression Explained: Vartanian
 Ordinary Least Squares Regression Eplained: Vartanian When to Use Ordinary Least Squares Regression Analysis A. Variable types. When you have an interval/ratio scale dependent variable.. When your independent
STAT 212 Business Statistics II 1
 STAT 1 Business Statistics II 1 KING FAHD UNIVERSITY OF PETROLEUM & MINERALS DEPARTMENT OF MATHEMATICAL SCIENCES DHAHRAN, SAUDI ARABIA STAT 1: BUSINESS STATISTICS II Semester 091 Final Exam Thursday Feb
Statistics 5100 Spring 2018 Exam 1
 Statistics 5100 Spring 2018 Exam 1 Directions: You have 60 minutes to complete the exam. Be sure to answer every question, and do not spend too much time on any part of any question. Be concise with all
Lecture 4: Multivariate Regression, Part 2
 Lecture 4: Multivariate Regression, Part 2 Gauss-Markov Assumptions 1) Linear in Parameters: Y X X X i 0 1 1 2 2 k k 2) Random Sampling: we have a random sample from the population that follows the above
Multiple Regression Analysis
 Multiple Regression Analysis Where as simple linear regression has 2 variables (1 dependent, 1 independent): y ˆ = a + bx Multiple linear regression has >2 variables (1 dependent, many independent): ˆ
Self-Assessment Weeks 6 and 7: Multiple Regression with a Qualitative Predictor; Multiple Comparisons
 Self-Assessment Weeks 6 and 7: Multiple Regression with a Qualitative Predictor; Multiple Comparisons 1. Suppose we wish to assess the impact of five treatments on an outcome Y. How would these five treatments
Regression: Main Ideas Setting: Quantitative outcome with a quantitative explanatory variable. Example, cont.
 TCELL 9/4/205 36-309/749 Experimental Design for Behavioral and Social Sciences Simple Regression Example Male black wheatear birds carry stones to the nest as a form of sexual display. Soler et al. wanted
Multiple linear regression
 Multiple linear regression Course MF 930: Introduction to statistics June 0 Tron Anders Moger Department of biostatistics, IMB University of Oslo Aims for this lecture: Continue where we left off. Repeat
36-309/749 Experimental Design for Behavioral and Social Sciences. Sep. 22, 2015 Lecture 4: Linear Regression
 36-309/749 Experimental Design for Behavioral and Social Sciences Sep. 22, 2015 Lecture 4: Linear Regression TCELL Simple Regression Example Male black wheatear birds carry stones to the nest as a form
Multiple Regression Methods
 Chapter 1: Multiple Regression Methods Hildebrand, Ott and Gray Basic Statistical Ideas for Managers Second Edition 1 Learning Objectives for Ch. 1 The Multiple Linear Regression Model How to interpret
y response variable x 1, x 2,, x k -- a set of explanatory variables
 11. Multiple Regression and Correlation y response variable x 1, x 2,, x k -- a set of explanatory variables In this chapter, all variables are assumed to be quantitative. Chapters 12-14 show how to incorporate
MORE ON SIMPLE REGRESSION: OVERVIEW
 FI=NOT0106 NOTICE. Unless otherwise indicated, all materials on this page and linked pages at the blue.temple.edu address and at the astro.temple.edu address are the sole property of Ralph B. Taylor and
Practical Biostatistics
 Practical Biostatistics Clinical Epidemiology, Biostatistics and Bioinformatics AMC Multivariable regression Day 5 Recap Describing association: Correlation Parametric technique: Pearson (PMCC) Non-parametric:
Simple Linear Regression: One Qualitative IV
 Simple Linear Regression: One Qualitative IV Simple linear regression with one qualitative IV variable is essentially identical to linear regression with quantitative variables. The primary difference
MATH ASSIGNMENT 2: SOLUTIONS
 MATH 204 - ASSIGNMENT 2: SOLUTIONS (a) Fitting the simple linear regression model to each of the variables in turn yields the following results: we look at t-tests for the individual coefficients, and
Daniel Boduszek University of Huddersfield
 Daniel Boduszek University of Huddersfield d.boduszek@hud.ac.uk Introduction to moderator effects Hierarchical Regression analysis with continuous moderator Hierarchical Regression analysis with categorical
Univariate analysis. Simple and Multiple Regression. Univariate analysis. Simple Regression How best to summarise the data?
 Univariate analysis Example - linear regression equation: y = ax + c Least squares criteria ( yobs ycalc ) = yobs ( ax + c) = minimum Simple and + = xa xc xy xa + nc = y Solve for a and c Univariate analysis
Correlation and Regression Bangkok, 14-18, Sept. 2015
 Analysing and Understanding Learning Assessment for Evidence-based Policy Making Correlation and Regression Bangkok, 14-18, Sept. 2015 Australian Council for Educational Research Correlation The strength
: The model hypothesizes a relationship between the variables. The simplest probabilistic model: or.
 Chapter Simple Linear Regression : comparing means across groups : presenting relationships among numeric variables. Probabilistic Model : The model hypothesizes an relationship between the variables.
STAT 3900/4950 MIDTERM TWO Name: Spring, 2015 (print: first last ) Covered topics: Two-way ANOVA, ANCOVA, SLR, MLR and correlation analysis
 Covered topics: Two-way ANOVA, ANCOVA, SLR, MLR and correlation analysis") STAT 3900/4950 MIDTERM TWO Name: Spring, 205 (print: first last ) Covered topics: Two-way ANOVA, ANCOVA, SLR, MLR and correlation analysis Instructions: You may use your books, notes, and SPSS/SAS. NO
STAT 3900/4950 MIDTERM TWO Name: Spring, 205 (print: first last ) Covered topics: Two-way ANOVA, ANCOVA, SLR, MLR and correlation analysis Instructions: You may use your books, notes, and SPSS/SAS. NO
CRP 272 Introduction To Regression Analysis
 CRP 272 Introduction To Regression Analysis 30 Relationships Among Two Variables: Interpretations One variable is used to explain another variable X Variable Independent Variable Explaining Variable Exogenous
Chapter 4. Regression Models. Learning Objectives
 Chapter 4 Regression Models To accompany Quantitative Analysis for Management, Eleventh Edition, by Render, Stair, and Hanna Power Point slides created by Brian Peterson Learning Objectives After completing
Analysing data: regression and correlation S6 and S7
 Basic medical statistics for clinical and experimental research Analysing data: regression and correlation S6 and S7 K. Jozwiak k.jozwiak@nki.nl 2 / 49 Correlation So far we have looked at the association
Using the Regression Model in multivariate data analysis
 Bulletin of the Transilvania University of Braşov Series V: Economic Sciences Vol. 10 (59) No. 1-2017 Using the Regression Model in multivariate data analysis Cristinel CONSTANTIN 1 Abstract: This paper
Technical Appendix C: Methods. Multilevel Regression Models
 Technical Appendix C: Methods Multilevel Regression Models As not all readers may be familiar with the analytical methods used in this study, a brief note helps to clarify the techniques. The firewall
Simple Linear Regression
 Simple Linear Regression 1 Correlation indicates the magnitude and direction of the linear relationship between two variables. Linear Regression: variable Y (criterion) is predicted by variable X (predictor)
Simple Linear Regression: One Quantitative IV
 Simple Linear Regression: One Quantitative IV Linear regression is frequently used to explain variation observed in a dependent variable (DV) with theoretically linked independent variables (IV). For example,
McGill University. Faculty of Science MATH 204 PRINCIPLES OF STATISTICS II. Final Examination
 McGill University Faculty of Science MATH 204 PRINCIPLES OF STATISTICS II Final Examination Date: 20th April 2009 Time: 9am-2pm Examiner: Dr David A Stephens Associate Examiner: Dr Russell Steele Please
Sociology Research Statistics I Final Exam Answer Key December 15, 1993
 Sociology 592 - Research Statistics I Final Exam Answer Key December 15, 1993 Where appropriate, show your work - partial credit may be given. (On the other hand, don't waste a lot of time on excess verbiage.)
Ref.: Spring SOS3003 Applied data analysis for social science Lecture note
 SOS3003 Applied data analysis for social science Lecture note 05-2010 Erling Berge Department of sociology and political science NTNU Spring 2010 Erling Berge 2010 1 Literature Regression criticism I Hamilton
Chapter 9 - Correlation and Regression
 Chapter 9 - Correlation and Regression 9. Scatter diagram of percentage of LBW infants (Y) and high-risk fertility rate (X ) in Vermont Health Planning Districts. 9.3 Correlation between percentage of
ECON 497 Midterm Spring
 ECON 497 Midterm Spring 2009 1 ECON 497: Economic Research and Forecasting Name: Spring 2009 Bellas Midterm You have three hours and twenty minutes to complete this exam. Answer all questions and explain
Equation Number 1 Dependent Variable.. Y W's Childbearing expectations
 Sociology 592 - Homework #10 - Advanced Multiple Regression 1. In their classic 1982 paper, Beyond Wives' Family Sociology: A Method for Analyzing Couple Data, Thomson and Williams examined the relationship
Sociology 593 Exam 1 February 17, 1995
 Sociology 593 Exam 1 February 17, 1995 I. True-False. (25 points) Indicate whether the following statements are true or false. If false, briefly explain why. 1. A researcher regressed Y on. When he plotted
Chapter 4 Regression with Categorical Predictor Variables Page 1. Overview of regression with categorical predictors
 Chapter 4 Regression with Categorical Predictor Variables Page. Overview of regression with categorical predictors 4-. Dummy coding 4-3 4-5 A. Karpinski Regression with Categorical Predictor Variables.
Descriptive Statistics
 Lampiran STATISTIK DESKRIPTIF MODEL REGRESI Descriptive Statistics IR Valid N (listwise) N Minimum Maximum Mean Std. Dev iation 30,02222,98000,2595358,2555370 30,050 6,5334,354584,2806794 30-3,44268 6,38392,8378998,87505435
Statistics and Quantitative Analysis U4320
 Statistics and Quantitative Analysis U3 Lecture 13: Explaining Variation Prof. Sharyn O Halloran Explaining Variation: Adjusted R (cont) Definition of Adjusted R So we'd like a measure like R, but one
Inter Item Correlation Matrix (R )
") 7 1. I have the ability to influence my child s well-being. 2. Whether my child avoids injury is just a matter of luck. 3. Luck plays a big part in determining how healthy my child is. 4. I can do a lot
7 1. I have the ability to influence my child s well-being. 2. Whether my child avoids injury is just a matter of luck. 3. Luck plays a big part in determining how healthy my child is. 4. I can do a lot
Regression Analysis. Regression: Methodology for studying the relationship among two or more variables
 Regression Analysis Regression: Methodology for studying the relationship among two or more variables Two major aims: Determine an appropriate model for the relationship between the variables Predict the
Prepared by: Prof. Dr Bahaman Abu Samah Department of Professional Development and Continuing Education Faculty of Educational Studies Universiti
 Prepared by: Prof Dr Bahaman Abu Samah Department of Professional Development and Continuing Education Faculty of Educational Studies Universiti Putra Malaysia Serdang M L Regression is an extension to
Lecture 4: Multivariate Regression, Part 2
 Lecture 4: Multivariate Regression, Part 2 Gauss-Markov Assumptions 1) Linear in Parameters: Y X X X i 0 1 1 2 2 k k 2) Random Sampling: we have a random sample from the population that follows the above
Multiple Regression. Peerapat Wongchaiwat, Ph.D.
 Peerapat Wongchaiwat, Ph.D. wongchaiwat@hotmail.com The Multiple Regression Model Examine the linear relationship between 1 dependent (Y) & 2 or more independent variables (X i ) Multiple Regression Model
Review of Multiple Regression
 Ronald H. Heck 1 Let s begin with a little review of multiple regression this week. Linear models [e.g., correlation, t-tests, analysis of variance (ANOVA), multiple regression, path analysis, multivariate
Bivariate Regression Analysis. The most useful means of discerning causality and significance of variables
 Bivariate Regression Analysis The most useful means of discerning causality and significance of variables Purpose of Regression Analysis Test causal hypotheses Make predictions from samples of data Derive
Interactions, Dummies, and Outliers
 Interactions, Dummies, and Outliers Modeling Interactive Relationships in Regression Income=b 1 (sex)+b 2 (education)+c Income=b 1 (sex)+b 2 (education)+b 3 (sex x education)+c In both cases, b 1 gives
1 Correlation and Inference from Regression
 1 Correlation and Inference from Regression Reading: Kennedy (1998) A Guide to Econometrics, Chapters 4 and 6 Maddala, G.S. (1992) Introduction to Econometrics p. 170-177 Moore and McCabe, chapter 12 is
Econ 3790: Business and Economics Statistics. Instructor: Yogesh Uppal
 Econ 3790: Business and Economics Statistics Instructor: Yogesh Uppal yuppal@ysu.edu Sampling Distribution of b 1 Expected value of b 1 : Variance of b 1 : E(b 1 ) = 1 Var(b 1 ) = σ 2 /SS x Estimate of
Sociology 593 Exam 2 March 28, 2002
 Sociology 59 Exam March 8, 00 I. True-False. (0 points) Indicate whether the following statements are true or false. If false, briefly explain why.. A variable is called CATHOLIC. This probably means that
General Linear Model (Chapter 4)
") General Linear Model (Chapter 4) Outcome variable is considered continuous Simple linear regression Scatterplots OLS is BLUE under basic assumptions MSE estimates residual variance testing regression coefficients
General Linear Model (Chapter 4) Outcome variable is considered continuous Simple linear regression Scatterplots OLS is BLUE under basic assumptions MSE estimates residual variance testing regression coefficients
Regression. Notes. Page 1. Output Created Comments 25-JAN :29:55
 REGRESSION /MISSING LISTWISE /STATISTICS COEFF OUTS CI(95) BCOV R ANOVA /CRITERIA=PIN(.05) POUT(.10) /NOORIGIN /DEPENDENT favorability /METHOD=ENTER Zcontemp ZAnxious6 zallcontact. Regression Notes Output
Chapter 7 Student Lecture Notes 7-1
 Chapter 7 Student Lecture Notes 7- Chapter Goals QM353: Business Statistics Chapter 7 Multiple Regression Analysis and Model Building After completing this chapter, you should be able to: Explain model
STA 4210 Practise set 2a
 STA 410 Practise set a For all significance tests, use = 0.05 significance level. S.1. A multiple linear regression model is fit, relating household weekly food expenditures (Y, in $100s) to weekly income
Sociology 593 Exam 1 Answer Key February 17, 1995
 Sociology 593 Exam 1 Answer Key February 17, 1995 I. True-False. (5 points) Indicate whether the following statements are true or false. If false, briefly explain why. 1. A researcher regressed Y on. When
Psychology Seminar Psych 406 Dr. Jeffrey Leitzel
 Psychology Seminar Psych 406 Dr. Jeffrey Leitzel Structural Equation Modeling Topic 1: Correlation / Linear Regression Outline/Overview Correlations (r, pr, sr) Linear regression Multiple regression interpreting
Chapter Fifteen. Frequency Distribution, Cross-Tabulation, and Hypothesis Testing
 Chapter Fifteen Frequency Distribution, Cross-Tabulation, and Hypothesis Testing Copyright 2010 Pearson Education, Inc. publishing as Prentice Hall 15-1 Internet Usage Data Table 15.1 Respondent Sex Familiarity
Introduction to Linear regression analysis. Part 2. Model comparisons
 Introduction to Linear regression analysis Part Model comparisons 1 ANOVA for regression Total variation in Y SS Total = Variation explained by regression with X SS Regression + Residual variation SS Residual
LI EAR REGRESSIO A D CORRELATIO
 CHAPTER 6 LI EAR REGRESSIO A D CORRELATIO Page Contents 6.1 Introduction 10 6. Curve Fitting 10 6.3 Fitting a Simple Linear Regression Line 103 6.4 Linear Correlation Analysis 107 6.5 Spearman s Rank Correlation
Simple Linear Regression: One Qualitative IV
 Simple Linear Regression: One Qualitative IV 1. Purpose As noted before regression is used both to explain and predict variation in DVs, and adding to the equation categorical variables extends regression
( ), which of the coefficients would end
, which of the coefficients would end") Discussion Sheet 29.7.9 Qualitative Variables We have devoted most of our attention in multiple regression to quantitative or numerical variables. MR models can become more useful and complex when we consider
Discussion Sheet 29.7.9 Qualitative Variables We have devoted most of our attention in multiple regression to quantitative or numerical variables. MR models can become more useful and complex when we consider
DEVELOPMENT OF CRASH PREDICTION MODEL USING MULTIPLE REGRESSION ANALYSIS Harshit Gupta 1, Dr. Siddhartha Rokade 2 1
 DEVELOPMENT OF CRASH PREDICTION MODEL USING MULTIPLE REGRESSION ANALYSIS Harshit Gupta 1, Dr. Siddhartha Rokade 2 1 PG Student, 2 Assistant Professor, Department of Civil Engineering, Maulana Azad National
Lecture 19: Inference for SLR & Transformations
 Lecture 19: Inference for SLR & Transformations Statistics 101 Mine Çetinkaya-Rundel April 3, 2012 Announcements Announcements HW 7 due Thursday. Correlation guessing game - ends on April 12 at noon. Winner
Self-Assessment Weeks 8: Multiple Regression with Qualitative Predictors; Multiple Comparisons
 Self-Assessment Weeks 8: Multiple Regression with Qualitative Predictors; Multiple Comparisons 1. Suppose we wish to assess the impact of five treatments while blocking for study participant race (Black,
Draft Proof - Do not copy, post, or distribute. Chapter Learning Objectives REGRESSION AND CORRELATION THE SCATTER DIAGRAM
 1 REGRESSION AND CORRELATION As we learned in Chapter 9 ( Bivariate Tables ), the differential access to the Internet is real and persistent. Celeste Campos-Castillo s (015) research confirmed the impact
Technical Appendix C: Methods
 Technical Appendix C: Methods As not all readers may be familiar with the multilevel analytical methods used in this study, a brief note helps to clarify the techniques. The general theory developed in
Unit 11: Multiple Linear Regression
 Unit 11: Multiple Linear Regression Statistics 571: Statistical Methods Ramón V. León 7/13/2004 Unit 11 - Stat 571 - Ramón V. León 1 Main Application of Multiple Regression Isolating the effect of a variable
Confidence Interval for the mean response
 Week 3: Prediction and Confidence Intervals at specified x. Testing lack of fit with replicates at some x's. Inference for the correlation. Introduction to regression with several explanatory variables.
Single and multiple linear regression analysis
 Single and multiple linear regression analysis Marike Cockeran 2017 Introduction Outline of the session Simple linear regression analysis SPSS example of simple linear regression analysis Additional topics
Regression Models. Chapter 4. Introduction. Introduction. Introduction
 Chapter 4 Regression Models Quantitative Analysis for Management, Tenth Edition, by Render, Stair, and Hanna 008 Prentice-Hall, Inc. Introduction Regression analysis is a very valuable tool for a manager
(4) 1. Create dummy variables for Town. Name these dummy variables A and B. These 0,1 variables now indicate the location of the house.
 1. Create dummy variables for Town. Name these dummy variables A and B. These 0,1 variables now indicate the location of the house.") Exam 3 Resource Economics 312 Introductory Econometrics Please complete all questions on this exam. The data in the spreadsheet: Exam 3- Home Prices.xls are to be used for all analyses. These data are
Exam 3 Resource Economics 312 Introductory Econometrics Please complete all questions on this exam. The data in the spreadsheet: Exam 3- Home Prices.xls are to be used for all analyses. These data are
Lecture 11 Multiple Linear Regression
 Lecture 11 Multiple Linear Regression STAT 512 Spring 2011 Background Reading KNNL: 6.1-6.5 11-1 Topic Overview Review: Multiple Linear Regression (MLR) Computer Science Case Study 11-2 Multiple Regression
Model Selection Procedures
 Model Selection Procedures Statistics 135 Autumn 2005 Copyright c 2005 by Mark E. Irwin Model Selection Procedures Consider a regression setting with K potential predictor variables and you wish to explore
QUANTITATIVE STATISTICAL METHODS: REGRESSION AND FORECASTING JOHANNES LEDOLTER VIENNA UNIVERSITY OF ECONOMICS AND BUSINESS ADMINISTRATION SPRING 2013
 QUANTITATIVE STATISTICAL METHODS: REGRESSION AND FORECASTING JOHANNES LEDOLTER VIENNA UNIVERSITY OF ECONOMICS AND BUSINESS ADMINISTRATION SPRING 3 Introduction Objectives of course: Regression and Forecasting
SCHOOL OF MATHEMATICS AND STATISTICS
 RESTRICTED OPEN BOOK EXAMINATION (Not to be removed from the examination hall) Data provided: Statistics Tables by H.R. Neave MAS5052 SCHOOL OF MATHEMATICS AND STATISTICS Basic Statistics Spring Semester
Chapter 3 Multiple Regression Complete Example
 Department of Quantitative Methods & Information Systems ECON 504 Chapter 3 Multiple Regression Complete Example Spring 2013 Dr. Mohammad Zainal Review Goals After completing this lecture, you should be
Lecture (chapter 13): Association between variables measured at the interval-ratio level
: Association between variables measured at the interval-ratio level") Lecture (chapter 13): Association between variables measured at the interval-ratio level Ernesto F. L. Amaral April 9 11, 2018 Advanced Methods of Social Research (SOCI 420) Source: Healey, Joseph F. 2015.
Lecture (chapter 13): Association between variables measured at the interval-ratio level Ernesto F. L. Amaral April 9 11, 2018 Advanced Methods of Social Research (SOCI 420) Source: Healey, Joseph F. 2015.
Sociology 593 Exam 2 Answer Key March 28, 2002
 Sociology 59 Exam Answer Key March 8, 00 I. True-False. (0 points) Indicate whether the following statements are true or false. If false, briefly explain why.. A variable is called CATHOLIC. This probably
Multiple Regression: Chapter 13. July 24, 2015
 Multiple Regression: Chapter 13 July 24, 2015 Multiple Regression (MR) Response Variable: Y - only one response variable (quantitative) Several Predictor Variables: X 1, X 2, X 3,..., X p (p = # predictors)
Categorical Predictor Variables
 Categorical Predictor Variables We often wish to use categorical (or qualitative) variables as covariates in a regression model. For binary variables (taking on only 2 values, e.g. sex), it is relatively
9. Linear Regression and Correlation
 9. Linear Regression and Correlation Data: y a quantitative response variable x a quantitative explanatory variable (Chap. 8: Recall that both variables were categorical) For example, y = annual income,
Bayesian Analysis LEARNING OBJECTIVES. Calculating Revised Probabilities. Calculating Revised Probabilities. Calculating Revised Probabilities
 Valua%on and pricing (November 5, 2013) LEARNING OBJECTIVES Lecture 7 Decision making (part 3) Regression theory Olivier J. de Jong, LL.M., MM., MBA, CFD, CFFA, AA www.olivierdejong.com 1. List the steps
Chapter Goals. To understand the methods for displaying and describing relationship among variables. Formulate Theories.
 Chapter Goals To understand the methods for displaying and describing relationship among variables. Formulate Theories Interpret Results/Make Decisions Collect Data Summarize Results Chapter 7: Is There