Model Building Chap 5 p251
|
|
|
- Hortense Leonard
- 6 years ago
- Views:
Transcription
1 Model Building Chap 5 p251 Models with one qualitative variable, 5.7 p277 Example 4 Colours : Blue, Green, Lemon Yellow and white Row Blue Green Lemon Insects trapped Descriptive Statistics: Insects Variable Colour N N* Mean Insects B G L W The regression equation is Insects trapped = Blue Green Lemon Predictor Coef StDev T P Constant Blue Green Lemon S = R-Sq = 82.1% R-Sq(adj) = 79.4% 1
2 Analysis of Variance Source DF SS MS F P Regression Residual Error Estimate the betas using the means (Descriptive statistics) State whether the following statements are true or false. a) The value of the F-statistic for testing any differences among the colours is b) We have evidence at p < 0.01 that the means for green and white are different. c) We have evidence at p < 0.01 that means for blue and white are different. d) A 95% confidence interval for the difference between means for lemon yellow and white is (23.3, 39.7) e) We may say that 82.1% of the variation in the number of insects trapped has been accounted for by the above model. 2
3 Models with two qualitative variables, 5.8 p282 Data Display Row C1 perform F2 F3 B2 F2B2 F3B2 F B 1 F1B F1 B1 2 F1B F1 B1 3 F1B F1 B1 4 F1B F1 B2 5 F2B F2 B1 6 F2B F2 B1 7 F2B F2 B2 8 F2B F2 B2 9 F3B F3 B1 10 F3B F3 B1 11 F3B F3 B2 12 F3B F3 B2 Example 5.10 p286 Main effects model The regression equation is perform = F F B2 Predictor Coef StDev T P Constant F F B S = R-Sq = 36.2% R-Sq(adj) = 12.3% Analysis of Variance Source DF SS MS F P Regression Residual Error Total Source DF Seq SS F F B
4 Interaction model Descriptive Statistics: perform Variable C1 N N* Mean StDev perform F1B F1B * F2B F2B F3B F3B The regression equation is perform = F F B F2B F3B2 Predictor Coef StDev T P Constant F F B F2B F3B S = R-Sq = 97.1% R-Sq(adj) = 94.8% Analysis of Variance Source DF SS MS F P Regression Residual Error Total Source DF Seq SS F F B F2B F3B
5 Interaction Plot - Data Means for perform B 80 B1 B2 70 Mean F1 F2 F3 F Estimate the regression equation using the means (descriptive statistics) Test whether there is an interaction between brand and fuel type. 5
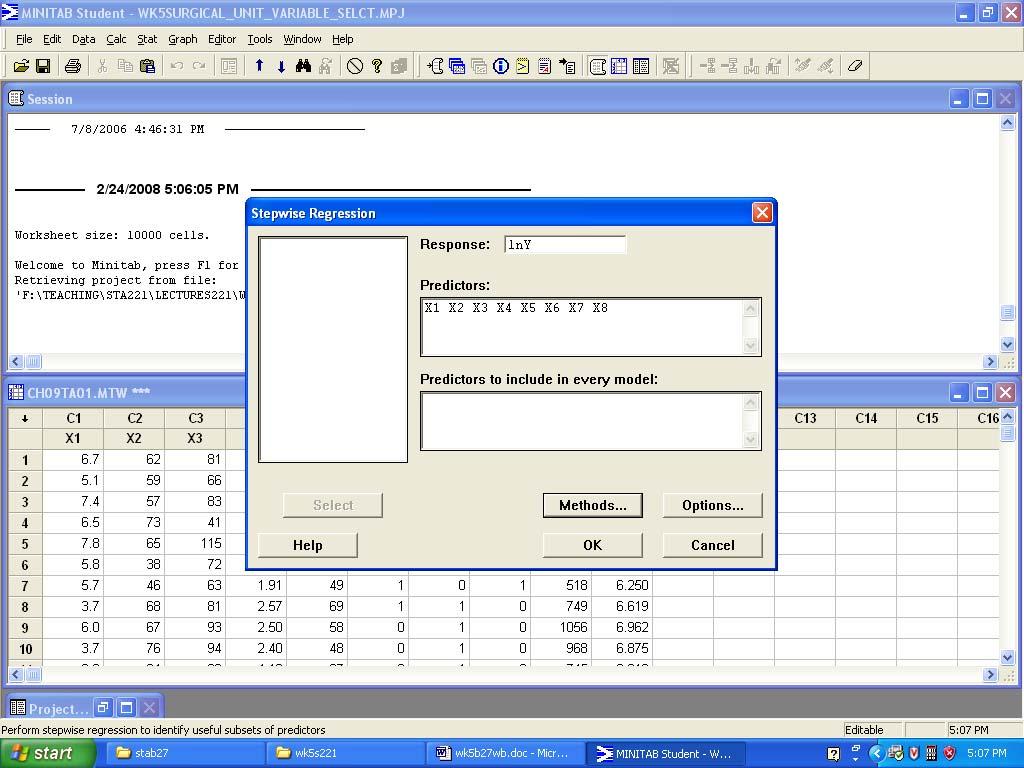
6 Variable Screening methods, Chap 6 p321 Stepwise regression p323 A hospital Surgical unit was interested in predicting the survival times of patients undergoing a particular type of liver operation. A random sample of patients was available for analysis. From each patient record, the following info was extracted from the preoperation evaluation: X1 = blood clotting score X2 = prognostic index X3 = enzyme function test score X4 = liver function test score X5 = age in years X6 = indicator variable for gender (0 = M, 1 = F) X7 and X8 = indicator variables for history of alcohol use (categorical: none, moderate, severe) X7 = indicator of moderate X8 = indicator of severe Data Display Row X1 X2 X3 X4 X5 X6 X7 X8 Y lny
7 The regression equation is Y = X X X X X X X X8 Predictor Coef StDev T P Constant X X X X X X X X S = R-Sq = 78.2% R-Sq(adj) = 74.3% Analysis of Variance Source DF SS MS F P Regression Residual Error Total Residuals Versus the Fitted Values (response is Y) 800 Residual Fitted Value 7
8 Normal Probability Plot of the Residuals (response is Y) 2 Normal Score Residual Histogram of the Residuals (response is Y) Frequency Residual
9 The regression equation is lny = X X X X X X X X8 Predictor Coef StDev T P Constant X X X X X X X X S = R-Sq = 84.6% R-Sq(adj) = 81.9% Analysis of Variance Source DF SS MS F P Regression Residual Error Total Residuals Versus the Fitted Values (response is lny) Residual Fitted Value 7.5 9
10 Normal Probability Plot of the Residuals (response is lny) 2 Normal Score Residual Histogram of the Residuals (response is lny) Frequency Residual 10
11 Stepwise Regression F-to-Enter: 4.00 F-to-Remove: 4.00 Response is lny on 8 predictors, with N = 54 Step Constant X T-Value X T-Value X T-Value X T-Value 3.86 S R-Sq

12 Minitab commands for stepwise regression 12
13 13
14 All possible Regressions Selection Procedure (6.3) p327 R-sq Criterion: 2 SSR SSE R = = 1 SST SST Response is lny Adj. X X X X X X X X Vars R-Sq R-Sq C-p s X X X X X X X X X X X X X X X X X X X X X X X X X X X X X X X X X X X X X X X X X X X X X X X X X X X X X X X X X X X X X X X X X X X X X X X X X X X X X X X X X X X X X X X X X X X X X X X X X X X X X X X X X X X X X X X X X X X X X X X X X X X X X X X X X X X X X X X X X X X X X X X X X X X X 14
15 Best Subsets Regression Response is lny Adj. X X X X X X X X Vars R-Sq R-Sq C-p s X X X X X X X X X X X X X X X X X X X X X X X X X X X X X X X X X X X X R-sq vars 15
16 Ex: Response is crimes p b o h d p t p s e o o 1 p g g v u t 8 o r r e n p - p a e r e Adj. o 3 6 d e t m Vars R-Sq R-Sq C-p s p 4 5 s s y p X X X X X X X X X X X X X X X X X X X X X X X X X X X X R-sq Vars
17 Other Criteria R-sq (Adj) 2) 2 MSE R = 1 Adj SST /( n 1) 3) C p criterion p328 Cp SSE p = + 2( p+ 1) n MSE k C p criterion selects as the best model, the subset model with 1) a small value of C p 2) value of C p near p + 1 (p is the number of predictors) 17

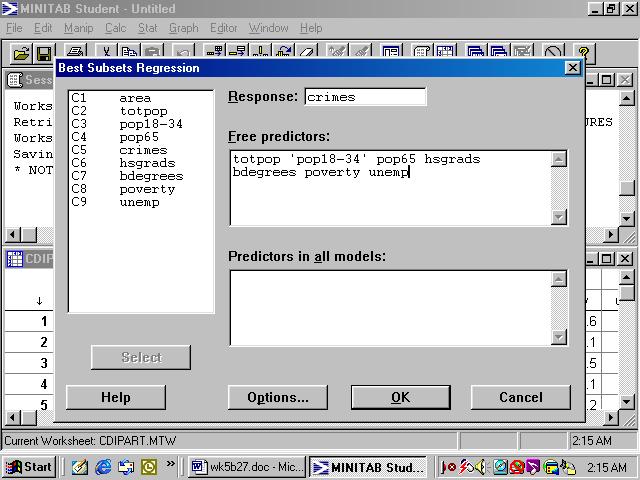
18 MINITAB commands 18
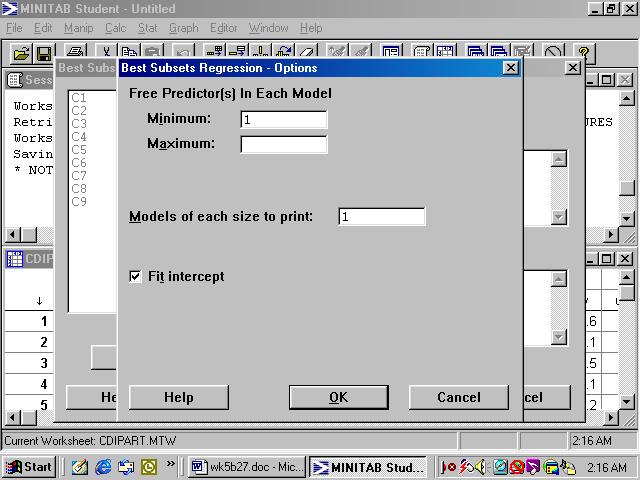
19 19
Models with qualitative explanatory variables p216
 Models with qualitative explanatory variables p216 Example gen = 1 for female Row gpa hsm gen 1 3.32 10 0 2 2.26 6 0 3 2.35 8 0 4 2.08 9 0 5 3.38 8 0 6 3.29 10 0 7 3.21 8 0 8 2.00 3 0 9 3.18 9 0 10 2.34
Confidence Interval for the mean response
 Week 3: Prediction and Confidence Intervals at specified x. Testing lack of fit with replicates at some x's. Inference for the correlation. Introduction to regression with several explanatory variables.
STA 108 Applied Linear Models: Regression Analysis Spring Solution for Homework #6
 STA 8 Applied Linear Models: Regression Analysis Spring 011 Solution for Homework #6 6. a) = 11 1 31 41 51 1 3 4 5 11 1 31 41 51 β = β1 β β 3 b) = 1 1 1 1 1 11 1 31 41 51 1 3 4 5 β = β 0 β1 β 6.15 a) Stem-and-leaf
Multiple Regression Examples
 Multiple Regression Examples Example: Tree data. we have seen that a simple linear regression of usable volume on diameter at chest height is not suitable, but that a quadratic model y = β 0 + β 1 x +
Model Selection Procedures
 Model Selection Procedures Statistics 135 Autumn 2005 Copyright c 2005 by Mark E. Irwin Model Selection Procedures Consider a regression setting with K potential predictor variables and you wish to explore
[4+3+3] Q 1. (a) Describe the normal regression model through origin. Show that the least square estimator of the regression parameter is given by
![[4+3+3] Q 1. (a) Describe the normal regression model through origin. Show that the least square estimator of the regression parameter is given by](/thumbs/75/71895393.jpg "[4+3+3] Q 1. (a) Describe the normal regression model through origin. Show that the least square estimator of the regression parameter is given by") Concordia University Department of Mathematics and Statistics Course Number Section Statistics 360/1 40 Examination Date Time Pages Final June 2004 3 hours 7 Instructors Course Examiner Marks Y.P. Chaubey
Concordia University Department of Mathematics and Statistics Course Number Section Statistics 360/1 40 Examination Date Time Pages Final June 2004 3 hours 7 Instructors Course Examiner Marks Y.P. Chaubey
Analysis of Covariance. The following example illustrates a case where the covariate is affected by the treatments.
 Analysis of Covariance In some experiments, the experimental units (subjects) are nonhomogeneous or there is variation in the experimental conditions that are not due to the treatments. For example, a
Chapter 14. Multiple Regression Models. Multiple Regression Models. Multiple Regression Models
 Chapter 14 Multiple Regression Models 1 Multiple Regression Models A general additive multiple regression model, which relates a dependent variable y to k predictor variables,,, is given by the model equation
STAT 360-Linear Models
 STAT 360-Linear Models Instructor: Yogendra P. Chaubey Sample Test Questions Fall 004 Note: The following questions are from previous tests and exams. The final exam will be for three hours and will contain
Basic Business Statistics, 10/e
 Chapter 4 4- Basic Business Statistics th Edition Chapter 4 Introduction to Multiple Regression Basic Business Statistics, e 9 Prentice-Hall, Inc. Chap 4- Learning Objectives In this chapter, you learn:
Outline. Topic 13 - Model Selection. Predicting Survival - Page 350. Survival Time as a Response. Variable Selection R 2 C p Adjusted R 2 PRESS
 Topic 13 - Model Selection - Fall 2013 Variable Selection R 2 C p Adjusted R 2 PRESS Outline Automatic Search Procedures Topic 13 2 Predicting Survival - Page 350 Surgical unit wants to predict survival
1 Introduction to Minitab
 1 Introduction to Minitab Minitab is a statistical analysis software package. The software is freely available to all students and is downloadable through the Technology Tab at my.calpoly.edu. When you
Steps for Regression. Simple Linear Regression. Data. Example. Residuals vs. X. Scatterplot. Make a Scatter plot Does it make sense to plot a line?
 Steps for Regression Simple Linear Regression Make a Scatter plot Does it make sense to plot a line? Check Residual Plot (Residuals vs. X) Are there any patterns? Check Histogram of Residuals Is it Normal?
The simple linear regression model discussed in Chapter 13 was written as
 1519T_c14 03/27/2006 07:28 AM Page 614 Chapter Jose Luis Pelaez Inc/Blend Images/Getty Images, Inc./Getty Images, Inc. 14 Multiple Regression 14.1 Multiple Regression Analysis 14.2 Assumptions of the Multiple
Basic Business Statistics 6 th Edition
 Basic Business Statistics 6 th Edition Chapter 12 Simple Linear Regression Learning Objectives In this chapter, you learn: How to use regression analysis to predict the value of a dependent variable based
Topic 18: Model Selection and Diagnostics
 Topic 18: Model Selection and Diagnostics Variable Selection We want to choose a best model that is a subset of the available explanatory variables Two separate problems 1. How many explanatory variables
TMA4255 Applied Statistics V2016 (5)
") TMA4255 Applied Statistics V2016 (5) Part 2: Regression Simple linear regression [11.1-11.4] Sum of squares [11.5] Anna Marie Holand To be lectured: January 26, 2016 wiki.math.ntnu.no/tma4255/2016v/start
TMA4255 Applied Statistics V2016 (5) Part 2: Regression Simple linear regression [11.1-11.4] Sum of squares [11.5] Anna Marie Holand To be lectured: January 26, 2016 wiki.math.ntnu.no/tma4255/2016v/start
PART I. (a) Describe all the assumptions for a normal error regression model with one predictor variable,
 Describe all the assumptions for a normal error regression model with one predictor variable,") Concordia University Department of Mathematics and Statistics Course Number Section Statistics 360/2 01 Examination Date Time Pages Final December 2002 3 hours 6 Instructors Course Examiner Marks Y.P.
Concordia University Department of Mathematics and Statistics Course Number Section Statistics 360/2 01 Examination Date Time Pages Final December 2002 3 hours 6 Instructors Course Examiner Marks Y.P.
Chapter 26 Multiple Regression, Logistic Regression, and Indicator Variables
 Chapter 26 Multiple Regression, Logistic Regression, and Indicator Variables 26.1 S 4 /IEE Application Examples: Multiple Regression An S 4 /IEE project was created to improve the 30,000-footlevel metric
Histogram of Residuals. Residual Normal Probability Plot. Reg. Analysis Check Model Utility. (con t) Check Model Utility. Inference.
 Check Model Utility. Inference.") Steps for Regression Simple Linear Regression Make a Scatter plot Does it make sense to plot a line? Check Residual Plot (Residuals vs. X) Are there any patterns? Check Histogram of Residuals Is it Normal?
Steps for Regression Simple Linear Regression Make a Scatter plot Does it make sense to plot a line? Check Residual Plot (Residuals vs. X) Are there any patterns? Check Histogram of Residuals Is it Normal?
Simple Linear Regression. Steps for Regression. Example. Make a Scatter plot. Check Residual Plot (Residuals vs. X)
") Simple Linear Regression 1 Steps for Regression Make a Scatter plot Does it make sense to plot a line? Check Residual Plot (Residuals vs. X) Are there any patterns? Check Histogram of Residuals Is it Normal?
Simple Linear Regression 1 Steps for Regression Make a Scatter plot Does it make sense to plot a line? Check Residual Plot (Residuals vs. X) Are there any patterns? Check Histogram of Residuals Is it Normal?
EX1. One way ANOVA: miles versus Plug. a) What are the hypotheses to be tested? b) What are df 1 and df 2? Verify by hand. , y 3
 What are the hypotheses to be tested? b) What are df 1 and df 2? Verify by hand. , y 3") EX. Chapter 8 Examples In an experiment to investigate the performance of four different brands of spark plugs intended for the use on a motorcycle, plugs of each brand were tested and the number of miles
EX. Chapter 8 Examples In an experiment to investigate the performance of four different brands of spark plugs intended for the use on a motorcycle, plugs of each brand were tested and the number of miles
Multiple Regression: Chapter 13. July 24, 2015
 Multiple Regression: Chapter 13 July 24, 2015 Multiple Regression (MR) Response Variable: Y - only one response variable (quantitative) Several Predictor Variables: X 1, X 2, X 3,..., X p (p = # predictors)
Examination paper for TMA4255 Applied statistics
 Department of Mathematical Sciences Examination paper for TMA4255 Applied statistics Academic contact during examination: Anna Marie Holand Phone: 951 38 038 Examination date: 16 May 2015 Examination time
ANOVA: Analysis of Variation
 ANOVA: Analysis of Variation The basic ANOVA situation Two variables: 1 Categorical, 1 Quantitative Main Question: Do the (means of) the quantitative variables depend on which group (given by categorical
Concordia University (5+5)Q 1.
Q 1.") (5+5)Q 1. Concordia University Department of Mathematics and Statistics Course Number Section Statistics 360/1 40 Examination Date Time Pages Mid Term Test May 26, 2004 Two Hours 3 Instructor Course Examiner
(5+5)Q 1. Concordia University Department of Mathematics and Statistics Course Number Section Statistics 360/1 40 Examination Date Time Pages Mid Term Test May 26, 2004 Two Hours 3 Instructor Course Examiner
Ch 13 & 14 - Regression Analysis
 Ch 3 & 4 - Regression Analysis Simple Regression Model I. Multiple Choice:. A simple regression is a regression model that contains a. only one independent variable b. only one dependent variable c. more
STATISTICS 110/201 PRACTICE FINAL EXAM
 STATISTICS 110/201 PRACTICE FINAL EXAM Questions 1 to 5: There is a downloadable Stata package that produces sequential sums of squares for regression. In other words, the SS is built up as each variable
Analysis of Bivariate Data
 Analysis of Bivariate Data Data Two Quantitative variables GPA and GAES Interest rates and indices Tax and fund allocation Population size and prison population Bivariate data (x,y) Case corr® 2 Independent
Multiple Regression Methods
 Chapter 1: Multiple Regression Methods Hildebrand, Ott and Gray Basic Statistical Ideas for Managers Second Edition 1 Learning Objectives for Ch. 1 The Multiple Linear Regression Model How to interpret
Chapter 14 Multiple Regression Analysis
 Chapter 14 Multiple Regression Analysis 1. a. Multiple regression equation b. the Y-intercept c. $374,748 found by Y ˆ = 64,1 +.394(796,) + 9.6(694) 11,6(6.) (LO 1) 2. a. Multiple regression equation b.
Data Set 8: Laysan Finch Beak Widths
 Data Set 8: Finch Beak Widths Statistical Setting This handout describes an analysis of covariance (ANCOVA) involving one categorical independent variable (with only two levels) and one quantitative covariate.
SMAM 314 Exam 42 Name
 SMAM 314 Exam 42 Name Mark the following statements True (T) or False (F) (10 points) 1. F A. The line that best fits points whose X and Y values are negatively correlated should have a positive slope.
23. Inference for regression
 23. Inference for regression The Practice of Statistics in the Life Sciences Third Edition 2014 W. H. Freeman and Company Objectives (PSLS Chapter 23) Inference for regression The regression model Confidence
1-Way ANOVA MATH 143. Spring Department of Mathematics and Statistics Calvin College
 1-Way ANOVA MATH 143 Department of Mathematics and Statistics Calvin College Spring 2010 The basic ANOVA situation Two variables: 1 Categorical, 1 Quantitative Main Question: Do the (means of) the quantitative
School of Mathematical Sciences. Question 1. Best Subsets Regression
 School of Mathematical Sciences MTH5120 Statistical Modelling I Practical 9 and Assignment 8 Solutions Question 1 Best Subsets Regression Response is Crime I n W c e I P a n A E P U U l e Mallows g E P
This document contains 3 sets of practice problems.
 P RACTICE PROBLEMS This document contains 3 sets of practice problems. Correlation: 3 problems Regression: 4 problems ANOVA: 8 problems You should print a copy of these practice problems and bring them
W&M CSCI 688: Design of Experiments Homework 2. Megan Rose Bryant
 W&M CSCI 688: Design of Experiments Homework 2 Megan Rose Bryant September 25, 201 3.5 The tensile strength of Portland cement is being studied. Four different mixing techniques can be used economically.
STAT 212 Business Statistics II 1
 STAT 1 Business Statistics II 1 KING FAHD UNIVERSITY OF PETROLEUM & MINERALS DEPARTMENT OF MATHEMATICAL SCIENCES DHAHRAN, SAUDI ARABIA STAT 1: BUSINESS STATISTICS II Semester 091 Final Exam Thursday Feb
Orthogonal contrasts for a 2x2 factorial design Example p130
 Week 9: Orthogonal comparisons for a 2x2 factorial design. The general two-factor factorial arrangement. Interaction and additivity. ANOVA summary table, tests, CIs. Planned/post-hoc comparisons for the
LEARNING WITH MINITAB Chapter 12 SESSION FIVE: DESIGNING AN EXPERIMENT
 LEARNING WITH MINITAB Chapter 12 SESSION FIVE: DESIGNING AN EXPERIMENT Laura M Williams, RN, CLNC, MSN MOREHEAD STATE UNIVERSITY IET603: STATISTICAL QUALITY ASSURANCE IN SCIENCE AND TECHNOLOGY DR. AHMAD
INFERENCE FOR REGRESSION
 CHAPTER 3 INFERENCE FOR REGRESSION OVERVIEW In Chapter 5 of the textbook, we first encountered regression. The assumptions that describe the regression model we use in this chapter are the following. We
One-Way Analysis of Variance (ANOVA)
") 1 One-Way Analysis of Variance (ANOVA) One-Way Analysis of Variance (ANOVA) is a method for comparing the means of a populations. This kind of problem arises in two different settings 1. When a independent
1 One-Way Analysis of Variance (ANOVA) One-Way Analysis of Variance (ANOVA) is a method for comparing the means of a populations. This kind of problem arises in two different settings 1. When a independent
General Linear Model (Chapter 4)
") General Linear Model (Chapter 4) Outcome variable is considered continuous Simple linear regression Scatterplots OLS is BLUE under basic assumptions MSE estimates residual variance testing regression coefficients
General Linear Model (Chapter 4) Outcome variable is considered continuous Simple linear regression Scatterplots OLS is BLUE under basic assumptions MSE estimates residual variance testing regression coefficients
Residual Analysis for two-way ANOVA The twoway model with K replicates, including interaction,
 Residual Analysis for two-way ANOVA The twoway model with K replicates, including interaction, is Y ijk = µ ij + ɛ ijk = µ + α i + β j + γ ij + ɛ ijk with i = 1,..., I, j = 1,..., J, k = 1,..., K. In carrying
Predictive Analytics : QM901.1x Prof U Dinesh Kumar, IIMB. All Rights Reserved, Indian Institute of Management Bangalore
 What is Multiple Linear Regression Several independent variables may influence the change in response variable we are trying to study. When several independent variables are included in the equation, the
Predict y from (possibly) many predictors x. Model Criticism Study the importance of columns
 many predictors x. Model Criticism Study the importance of columns") Lecture Week Multiple Linear Regression Predict y from (possibly) many predictors x Including extra derived variables Model Criticism Study the importance of columns Draw on Scientific framework Experiment;
Lecture Week Multiple Linear Regression Predict y from (possibly) many predictors x Including extra derived variables Model Criticism Study the importance of columns Draw on Scientific framework Experiment;
1 Use of indicator random variables. (Chapter 8)
") 1 Use of indicator random variables. (Chapter 8) let I(A) = 1 if the event A occurs, and I(A) = 0 otherwise. I(A) is referred to as the indicator of the event A. The notation I A is often used. 1 2 Fitting
1 Use of indicator random variables. (Chapter 8) let I(A) = 1 if the event A occurs, and I(A) = 0 otherwise. I(A) is referred to as the indicator of the event A. The notation I A is often used. 1 2 Fitting
Solution: X = , Y = = = = =
 Q1.19) Grade point average. The director of admissions of a small college selected 120 students at random from the new freshman class in a study to determine whether a student's grade point average (OPA)
Dr. Maddah ENMG 617 EM Statistics 11/28/12. Multiple Regression (3) (Chapter 15, Hines)
 (Chapter 15, Hines)") Dr. Maddah ENMG 617 EM Statistics 11/28/12 Multiple Regression (3) (Chapter 15, Hines) Problems in multiple regression: Multicollinearity This arises when the independent variables x 1, x 2,, x k, are
Dr. Maddah ENMG 617 EM Statistics 11/28/12 Multiple Regression (3) (Chapter 15, Hines) Problems in multiple regression: Multicollinearity This arises when the independent variables x 1, x 2,, x k, are
MBA Statistics COURSE #4
 MBA Statistics 51-651-00 COURSE #4 Simple and multiple linear regression What should be the sales of ice cream? Example: Before beginning building a movie theater, one must estimate the daily number of
Chapter 12: Multiple Regression
 Chapter 12: Multiple Regression 12.1 a. A scatterplot of the data is given here: Plot of Drug Potency versus Dose Level Potency 0 5 10 15 20 25 30 0 5 10 15 20 25 30 35 Dose Level b. ŷ = 8.667 + 0.575x
assumes a linear relationship between mean of Y and the X s with additive normal errors the errors are assumed to be a sample from N(0, σ 2 )
") Multiple Linear Regression is used to relate a continuous response (or dependent) variable Y to several explanatory (or independent) (or predictor) variables X 1, X 2,, X k assumes a linear relationship
Multiple Linear Regression is used to relate a continuous response (or dependent) variable Y to several explanatory (or independent) (or predictor) variables X 1, X 2,, X k assumes a linear relationship
STAT 212: BUSINESS STATISTICS II Third Exam Tuesday Dec 12, 6:00 PM
 STAT212_E3 KING FAHD UNIVERSITY OF PETROLEUM & MINERALS DEPARTMENT OF MATHEMATICS & STATISTICS Term 171 Page 1 of 9 STAT 212: BUSINESS STATISTICS II Third Exam Tuesday Dec 12, 2017 @ 6:00 PM Name: ID #:
SMAM 314 Computer Assignment 5 due Nov 8,2012 Data Set 1. For each of the following data sets use Minitab to 1. Make a scatterplot.
 SMAM 314 Computer Assignment 5 due Nov 8,2012 Data Set 1. For each of the following data sets use Minitab to 1. Make a scatterplot. 2. Fit the linear regression line. Regression Analysis: y versus x y
Apart from this page, you are not permitted to read the contents of this question paper until instructed to do so by an invigilator.
 B. Sc. Examination by course unit 2014 MTH5120 Statistical Modelling I Duration: 2 hours Date and time: 16 May 2014, 1000h 1200h Apart from this page, you are not permitted to read the contents of this
Inference for the Regression Coefficient
 Inference for the Regression Coefficient Recall, b 0 and b 1 are the estimates of the slope β 1 and intercept β 0 of population regression line. We can shows that b 0 and b 1 are the unbiased estimates
Inferences for linear regression (sections 12.1, 12.2)
") Inferences for linear regression (sections 12.1, 12.2) Regression case history: do bigger national parks help prevent extinction? ex. area of natural reserves and extinction: 6 national parks in Tanzania
Inferences for linear regression (sections 12.1, 12.2) Regression case history: do bigger national parks help prevent extinction? ex. area of natural reserves and extinction: 6 national parks in Tanzania
ST430 Exam 2 Solutions
 ST430 Exam 2 Solutions Date: November 9, 2015 Name: Guideline: You may use one-page (front and back of a standard A4 paper) of notes. No laptop or textbook are permitted but you may use a calculator. Giving
1. An article on peanut butter in Consumer reports reported the following scores for various brands
 SMAM 314 Review Exam 1 1. An article on peanut butter in Consumer reports reported the following scores for various brands Creamy 56 44 62 36 39 53 50 65 45 40 56 68 41 30 40 50 50 56 65 56 45 40 Crunchy
Multiple Regression an Introduction. Stat 511 Chap 9
 Multiple Regression an Introduction Stat 511 Chap 9 1 case studies meadowfoam flowers brain size of mammals 2 case study 1: meadowfoam flowering designed experiment carried out in a growth chamber general
Analysing qpcr outcomes. Lecture Analysis of Variance by Dr Maartje Klapwijk
 Analysing qpcr outcomes Lecture Analysis of Variance by Dr Maartje Klapwijk 22 October 2014 Personal Background Since 2009 Insect Ecologist at SLU Climate Change and other anthropogenic effects on interaction
(4) 1. Create dummy variables for Town. Name these dummy variables A and B. These 0,1 variables now indicate the location of the house.
 1. Create dummy variables for Town. Name these dummy variables A and B. These 0,1 variables now indicate the location of the house.") Exam 3 Resource Economics 312 Introductory Econometrics Please complete all questions on this exam. The data in the spreadsheet: Exam 3- Home Prices.xls are to be used for all analyses. These data are
Exam 3 Resource Economics 312 Introductory Econometrics Please complete all questions on this exam. The data in the spreadsheet: Exam 3- Home Prices.xls are to be used for all analyses. These data are
Lecture 1 Linear Regression with One Predictor Variable.p2
 Lecture Linear Regression with One Predictor Variablep - Basics - Meaning of regression parameters p - β - the slope of the regression line -it indicates the change in mean of the probability distn of
Inference for Regression Inference about the Regression Model and Using the Regression Line
 Inference for Regression Inference about the Regression Model and Using the Regression Line PBS Chapter 10.1 and 10.2 2009 W.H. Freeman and Company Objectives (PBS Chapter 10.1 and 10.2) Inference about
School of Mathematical Sciences. Question 1
 School of Mathematical Sciences MTH5120 Statistical Modelling I Practical 8 and Assignment 7 Solutions Question 1 Figure 1: The residual plots do not contradict the model assumptions of normality, constant
Multiple Linear Regression
 Andrew Lonardelli December 20, 2013 Multiple Linear Regression 1 Table Of Contents Introduction: p.3 Multiple Linear Regression Model: p.3 Least Squares Estimation of the Parameters: p.4-5 The matrix approach
Selection of the Best Regression Equation by sorting out Variables
 Selection of the Best Regression Equation by sorting out Variables Mohammad Ehsanul Karim Institute of Statistical Research and training; University of Dhaka, Dhaka 1000, Bangladesh
SMAM 314 Practice Final Examination Winter 2003
 SMAM 314 Practice Final Examination Winter 2003 You may use your textbook, one page of notes and a calculator. Please hand in the notes with your exam. 1. Mark the following statements True T or False
sociology 362 regression
 sociology 36 regression Regression is a means of studying how the conditional distribution of a response variable (say, Y) varies for different values of one or more independent explanatory variables (say,
Lecture 6 Multiple Linear Regression, cont.
 Lecture 6 Multiple Linear Regression, cont. BIOST 515 January 22, 2004 BIOST 515, Lecture 6 Testing general linear hypotheses Suppose we are interested in testing linear combinations of the regression
Lecture 3: Multivariate Regression
 Lecture 3: Multivariate Regression Rates, cont. Two weeks ago, we modeled state homicide rates as being dependent on one variable: poverty. In reality, we know that state homicide rates depend on numerous
Chapter 15 Multiple Regression
 Multiple Regression Learning Objectives 1. Understand how multiple regression analysis can be used to develop relationships involving one dependent variable and several independent variables. 2. Be able
Lecture 9: Linear Regression
 Lecture 9: Linear Regression Goals Develop basic concepts of linear regression from a probabilistic framework Estimating parameters and hypothesis testing with linear models Linear regression in R Regression
LINEAR REGRESSION ANALYSIS. MODULE XVI Lecture Exercises
 LINEAR REGRESSION ANALYSIS MODULE XVI Lecture - 44 Exercises Dr. Shalabh Department of Mathematics and Statistics Indian Institute of Technology Kanpur Exercise 1 The following data has been obtained on
EXAM IN TMA4255 EXPERIMENTAL DESIGN AND APPLIED STATISTICAL METHODS
 Norges teknisk naturvitenskapelige universitet Institutt for matematiske fag Side 1 av 8 Contact during exam: Bo Lindqvist Tel. 975 89 418 EXAM IN TMA4255 EXPERIMENTAL DESIGN AND APPLIED STATISTICAL METHODS
Lecture 4: Multivariate Regression, Part 2
 Lecture 4: Multivariate Regression, Part 2 Gauss-Markov Assumptions 1) Linear in Parameters: Y X X X i 0 1 1 2 2 k k 2) Random Sampling: we have a random sample from the population that follows the above
UNIVERSITY OF TORONTO SCARBOROUGH Department of Computer and Mathematical Sciences Midterm Test, October 2013
 UNIVERSITY OF TORONTO SCARBOROUGH Department of Computer and Mathematical Sciences Midterm Test, October 2013 STAC67H3 Regression Analysis Duration: One hour and fifty minutes Last Name: First Name: Student
SMAM 319 Exam 1 Name. 1.Pick the best choice for the multiple choice questions below (10 points 2 each)
") SMAM 319 Exam 1 Name 1.Pick the best choice for the multiple choice questions below (10 points 2 each) A b In Metropolis there are some houses for sale. Superman and Lois Lane are interested in the average
SMAM 319 Exam 1 Name 1.Pick the best choice for the multiple choice questions below (10 points 2 each) A b In Metropolis there are some houses for sale. Superman and Lois Lane are interested in the average
Chapter 14 Student Lecture Notes 14-1
 Chapter 14 Student Lecture Notes 14-1 Business Statistics: A Decision-Making Approach 6 th Edition Chapter 14 Multiple Regression Analysis and Model Building Chap 14-1 Chapter Goals After completing this
Notebook Tab 6 Pages 183 to ConteSolutions
 Notebook Tab 6 Pages 183 to 196 When the assumed relationship best fits a straight line model (r (Pearson s correlation coefficient) is close to 1 ), this approach is known as Linear Regression Analysis.
28. SIMPLE LINEAR REGRESSION III
 28. SIMPLE LINEAR REGRESSION III Fitted Values and Residuals To each observed x i, there corresponds a y-value on the fitted line, y = βˆ + βˆ x. The are called fitted values. ŷ i They are the values of
Simple Linear Regression Using Ordinary Least Squares
 Simple Linear Regression Using Ordinary Least Squares Purpose: To approximate a linear relationship with a line. Reason: We want to be able to predict Y using X. Definition: The Least Squares Regression
Institutionen för matematik och matematisk statistik Umeå universitet November 7, Inlämningsuppgift 3. Mariam Shirdel
 Institutionen för matematik och matematisk statistik Umeå universitet November 7, 2011 Inlämningsuppgift 3 Mariam Shirdel (mash0007@student.umu.se) Kvalitetsteknik och försöksplanering, 7.5 hp 1 Uppgift
holding all other predictors constant
 Multiple Regression Numeric Response variable (y) p Numeric predictor variables (p < n) Model: Y = b 0 + b 1 x 1 + + b p x p + e Partial Regression Coefficients: b i effect (on the mean response) of increasing
Linear models and their mathematical foundations: Simple linear regression
 Linear models and their mathematical foundations: Simple linear regression Steffen Unkel Department of Medical Statistics University Medical Center Göttingen, Germany Winter term 2018/19 1/21 Introduction
Lecture 18: Simple Linear Regression
 Lecture 18: Simple Linear Regression BIOS 553 Department of Biostatistics University of Michigan Fall 2004 The Correlation Coefficient: r The correlation coefficient (r) is a number that measures the strength
Linear Modelling in Stata Session 6: Further Topics in Linear Modelling
 Linear Modelling in Stata Session 6: Further Topics in Linear Modelling Mark Lunt Arthritis Research UK Epidemiology Unit University of Manchester 14/11/2017 This Week Categorical Variables Categorical
Correlation & Simple Regression
 Chapter 11 Correlation & Simple Regression The previous chapter dealt with inference for two categorical variables. In this chapter, we would like to examine the relationship between two quantitative variables.
MULTIPLE LINEAR REGRESSION IN MINITAB
 MULTIPLE LINEAR REGRESSION IN MINITAB This document shows a complicated Minitab multiple regression. It includes descriptions of the Minitab commands, and the Minitab output is heavily annotated. Comments
STA220H1F Term Test Oct 26, Last Name: First Name: Student #: TA s Name: or Tutorial Room:
 STA0HF Term Test Oct 6, 005 Last Name: First Name: Student #: TA s Name: or Tutorial Room: Time allowed: hour and 45 minutes. Aids: one sided handwritten aid sheet + non-programmable calculator Statistical
Lab 07 Introduction to Econometrics
 Lab 07 Introduction to Econometrics Learning outcomes for this lab: Introduce the different typologies of data and the econometric models that can be used Understand the rationale behind econometrics Understand
Multiple Regression and Model Building (cont d) + GIS Lecture 21 3 May 2006 R. Ryznar
 + GIS Lecture 21 3 May 2006 R. Ryznar") Multiple Regression and Model Building (cont d) + GIS 11.220 Lecture 21 3 May 2006 R. Ryznar Model Summary b 1-[(SSE/n-k+1)/(SST/n-1)] Model 1 Adjusted Std. Error of R R Square R Square the Estimate.991
Multiple Regression and Model Building (cont d) + GIS 11.220 Lecture 21 3 May 2006 R. Ryznar Model Summary b 1-[(SSE/n-k+1)/(SST/n-1)] Model 1 Adjusted Std. Error of R R Square R Square the Estimate.991
AP Statistics Unit 6 Note Packet Linear Regression. Scatterplots and Correlation
 Scatterplots and Correlation Name Hr A scatterplot shows the relationship between two quantitative variables measured on the same individuals. variable (y) measures an outcome of a study variable (x) may
1. Least squares with more than one predictor
 Statistics 1 Lecture ( November ) c David Pollard Page 1 Read M&M Chapter (skip part on logistic regression, pages 730 731). Read M&M pages 1, for ANOVA tables. Multiple regression. 1. Least squares with
Economics 326 Methods of Empirical Research in Economics. Lecture 14: Hypothesis testing in the multiple regression model, Part 2
 Economics 326 Methods of Empirical Research in Economics Lecture 14: Hypothesis testing in the multiple regression model, Part 2 Vadim Marmer University of British Columbia May 5, 2010 Multiple restrictions
Is economic freedom related to economic growth?
 Is economic freedom related to economic growth? It is an article of faith among supporters of capitalism: economic freedom leads to economic growth. The publication Economic Freedom of the World: 2003
Oregon Hill Wireless Survey Regression Model and Statistical Evaluation. Sky Huvard
 Oregon Hill Wireless Survey Regression Model and Statistical Evaluation Sky Huvard Business Statistics Dr. George Canavos 4 May 2003 Overview Huvard 2 I am interested in starting a wireless broadband project
(1) The explanatory or predictor variables may be qualitative. (We ll focus on examples where this is the case.)
 The explanatory or predictor variables may be qualitative. (We ll focus on examples where this is the case.)") Introduction to Analysis of Variance Analysis of variance models are similar to regression models, in that we re interested in learning about the relationship between a dependent variable (a response)
Introduction to Analysis of Variance Analysis of variance models are similar to regression models, in that we re interested in learning about the relationship between a dependent variable (a response)
ANOVA Situation The F Statistic Multiple Comparisons. 1-Way ANOVA MATH 143. Department of Mathematics and Statistics Calvin College
 1-Way ANOVA MATH 143 Department of Mathematics and Statistics Calvin College An example ANOVA situation Example (Treating Blisters) Subjects: 25 patients with blisters Treatments: Treatment A, Treatment