Module 8: Linear Regression. The Applied Research Center
|
|
|
- Teresa Fleming
- 5 years ago
- Views:
Transcription
1 Module 8: Linear Regression The Applied Research Center
2 Module 8 Overview } Purpose of Linear Regression } Scatter Diagrams } Regression Equation } Regression Results } Example
3 Purpose } To predict scores on one variable based on information regarding the other variables. } OR } To explain why the participants scored differently on a particular variable of interest.
4 Scatter Diagrams } Regression can best be understood by examining a scatter diagram, which includes the data points and a line of best fit.
5 Regression Equation } The slanted line passing through the data points of a scatter diagram is the regression line or line of best fit, which is used to make predictions. } The regression equation is the technical way of describing the regression line. } Y = a + bx } Y is the predicted score for the dependent variable } a is the constant } b is the regression coefficient } X is the known score on the independent variable
6 Y = a + bx } a is the constant, or intercept } Indicates where the regression line would intersect the y axis (or the vertical axis, also known as the ordinate). } It is the value for Y when X = 0 } b is the regression coefficient, or the slope of the regression line } It signifies how many predicted units of change (either positive or negative) in the DV there are for any one unit increase in the IV.
7 Regression Results } r } r 2 } the degree to which the predicted scores match up to the actual scores. } Coefficient of determination } The proportion of variability in the dependent variable that is explained by the independent variable } Reported as a percent
8 Example } A stats professor wanted to predict student grades on Assignment 2 based on student grades on Assignment 1. } Step 1: Write your null and alternate hypotheses: } H 0 = There is no relationship between Assignment 1 and Assignment 2. } H a = There is a relationship between Assignment 1 and Assignment 2.
9 Example (cont d) } Step 2: Input the data into SPSS } Create a variable for Assignment 1 and a second variable for Assignment 2 } Input the student grades on Assignment 1 in the Assignment 1 column and enter student grades on Assignment 2 in the Assignment 2 column
10 Example (cont d) } Step 3: Create a scatter diagram } Graphs à Legacy Dialogues à Scatter/Dot } Click on Simple Scatter, then Define } Assignment 2à Y-axis box } Assignment 1à X-axis box } Click Ok
11 Example (cont d) } To add a regression line to the scatter plot } Double click on the chart (in the SPSS Output) to select it for editing and maximize the chart editor } Click on any of the data points in the scatter plot to highlight the data points } Click Elements from the main menu bar and click on Fit Line at Total } Click Close
")
12 Example (cont d)
13 Example (cont d) } Step 4: Run the Bivariate Linear Regression } Analyze à Regressionà Linear } Assignment 2 à Dependent box } Assignment 1 à Independent box } Click Statistics } Click Confidence Intervals and Descriptives (make sure Estimates and Model fit are also selected) } Click Continue } Click OK
14 Example (cont d)
15 Example (cont d)
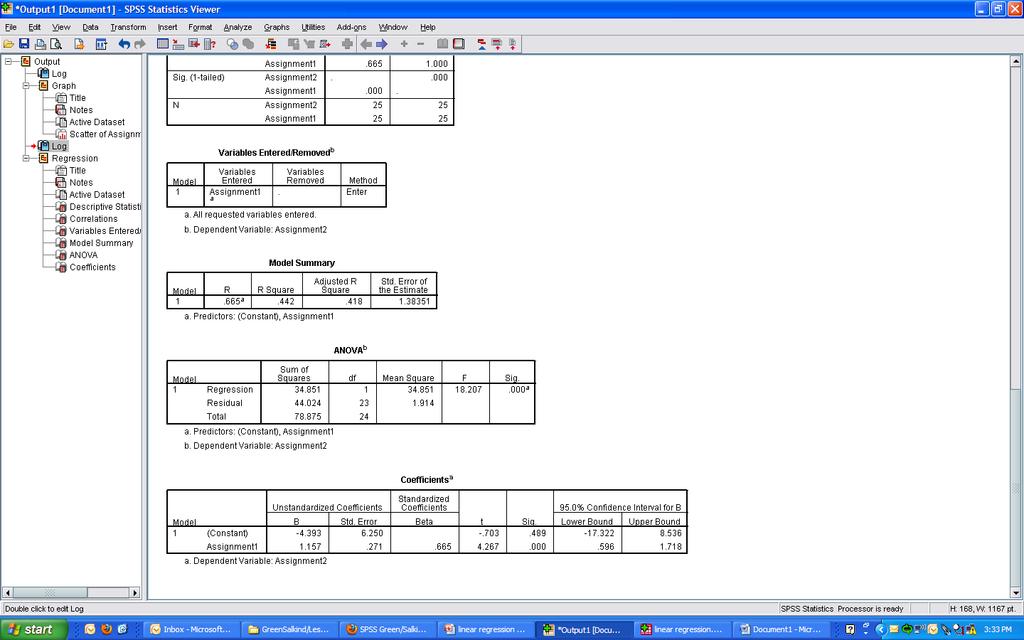
16
17 Example (cont d) } Step 5: Write the prediction equation } Y = X } Step 6: Write up your results } The hypothesis was tested using a bivariate linear regression to determine whether student grades on Assignment 2 could be predicted based on student grades from Assignment 1. Regression analysis revealed that the model significantly predicted Assignment 2 grades based on Assignment 1 grades, F (1, 23) = , p <.001. R 2 for the model was.44, and adjusted R 2 was.42
18 Module 8 Summary } Purpose of Linear Regression } Scatter Diagrams } Regression Equation } Regression Results } Example
19 Review Activity } Please complete the review activity at the end of the module. } All modules build on one another. Therefore, in order to move onto the next module you must successfully complete the review activity before moving on to next module. } You can complete the review activity and module as many times as you like.
20 Upcoming Modules } Module 1: Introduction to Statistics } Module 2: Introduction to SPSS } Module 3: Descriptive Statistics } Module 4: Inferential Statistics } Module 5: Correlation } Module 6: t-tests } Module 7: ANOVAs } Module 8: Linear Regression } Module 9: Nonparametric Procedures
LAB 3 INSTRUCTIONS SIMPLE LINEAR REGRESSION
 LAB 3 INSTRUCTIONS SIMPLE LINEAR REGRESSION In this lab you will first learn how to display the relationship between two quantitative variables with a scatterplot and also how to measure the strength of
DETAILED CONTENTS PART I INTRODUCTION AND DESCRIPTIVE STATISTICS. 1. Introduction to Statistics
 DETAILED CONTENTS About the Author Preface to the Instructor To the Student How to Use SPSS With This Book PART I INTRODUCTION AND DESCRIPTIVE STATISTICS 1. Introduction to Statistics 1.1 Descriptive and
THE PEARSON CORRELATION COEFFICIENT
 CORRELATION Two variables are said to have a relation if knowing the value of one variable gives you information about the likely value of the second variable this is known as a bivariate relation There
ASSIGNMENT 3 SIMPLE LINEAR REGRESSION. Old Faithful
 ASSIGNMENT 3 SIMPLE LINEAR REGRESSION In the simple linear regression model, the mean of a response variable is a linear function of an explanatory variable. The model and associated inferential tools
CHAPTER 10. Regression and Correlation
 CHAPTER 10 Regression and Correlation In this Chapter we assess the strength of the linear relationship between two continuous variables. If a significant linear relationship is found, the next step would
OHS Algebra 2 Summer Packet
 OHS Algebra 2 Summer Packet Good Luck to: Date Started: (please print student name here) Geometry Teacher s Name: Complete each of the following exercises in this formative assessment. To receive full
Using SPSS for One Way Analysis of Variance
 Using SPSS for One Way Analysis of Variance This tutorial will show you how to use SPSS version 12 to perform a one-way, between- subjects analysis of variance and related post-hoc tests. This tutorial
Introduction to Statistical Analysis using IBM SPSS Statistics (v24)
") to Statistical Analysis using IBM SPSS Statistics (v24) to Statistical Analysis Using IBM SPSS Statistics is a two day instructor-led classroom course that provides an application-oriented introduction
to Statistical Analysis using IBM SPSS Statistics (v24) to Statistical Analysis Using IBM SPSS Statistics is a two day instructor-led classroom course that provides an application-oriented introduction
Slide 7.1. Theme 7. Correlation
 Slide 7.1 Theme 7 Correlation Slide 7.2 Overview Researchers are often interested in exploring whether or not two variables are associated This lecture will consider Scatter plots Pearson correlation coefficient
Chapte The McGraw-Hill Companies, Inc. All rights reserved.
 12er12 Chapte Bivariate i Regression (Part 1) Bivariate Regression Visual Displays Begin the analysis of bivariate data (i.e., two variables) with a scatter plot. A scatter plot - displays each observed
Reteach 2-3. Graphing Linear Functions. 22 Holt Algebra 2. Name Date Class
 -3 Graphing Linear Functions Use intercepts to sketch the graph of the function 3x 6y 1. The x-intercept is where the graph crosses the x-axis. To find the x-intercept, set y 0 and solve for x. 3x 6y 1
This module focuses on the logic of ANOVA with special attention given to variance components and the relationship between ANOVA and regression.
 WISE ANOVA and Regression Lab Introduction to the WISE Correlation/Regression and ANOVA Applet This module focuses on the logic of ANOVA with special attention given to variance components and the relationship
Area1 Scaled Score (NAPLEX) .535 ** **.000 N. Sig. (2-tailed)
 .535 ** **.000 N. Sig. (2-tailed)") Institutional Assessment Report Texas Southern University College of Pharmacy and Health Sciences "An Analysis of 2013 NAPLEX, P4-Comp. Exams and P3 courses The following analysis illustrates relationships
Institutional Assessment Report Texas Southern University College of Pharmacy and Health Sciences "An Analysis of 2013 NAPLEX, P4-Comp. Exams and P3 courses The following analysis illustrates relationships
Contents. 9. Fractional and Quadratic Equations 2 Example Example Example
 Contents 9. Fractional and Quadratic Equations 2 Example 9.52................................ 2 Example 9.54................................ 3 Example 9.55................................ 4 1 Peterson,
LAB 5 INSTRUCTIONS LINEAR REGRESSION AND CORRELATION
 LAB 5 INSTRUCTIONS LINEAR REGRESSION AND CORRELATION In this lab you will learn how to use Excel to display the relationship between two quantitative variables, measure the strength and direction of the
One-Way ANOVA. Some examples of when ANOVA would be appropriate include:
 One-Way ANOVA 1. Purpose Analysis of variance (ANOVA) is used when one wishes to determine whether two or more groups (e.g., classes A, B, and C) differ on some outcome of interest (e.g., an achievement
Daniel Boduszek University of Huddersfield
 Daniel Boduszek University of Huddersfield d.boduszek@hud.ac.uk Introduction to moderator effects Hierarchical Regression analysis with continuous moderator Hierarchical Regression analysis with categorical
M&M Exponentials Exponential Function
 M&M Exponentials Exponential Function Teacher Guide Activity Overview In M&M Exponentials students will experiment with growth and decay functions. Students will also graph their experimental data and
Correlation and Regression (Excel 2007)
") Correlation and Regression (Excel 2007) (See Also Scatterplots, Regression Lines, and Time Series Charts With Excel 2007 for instructions on making a scatterplot of the data and an alternate method of
Correlation and Regression (Excel 2007) (See Also Scatterplots, Regression Lines, and Time Series Charts With Excel 2007 for instructions on making a scatterplot of the data and an alternate method of
LOOKING FOR RELATIONSHIPS
 LOOKING FOR RELATIONSHIPS One of most common types of investigation we do is to look for relationships between variables. Variables may be nominal (categorical), for example looking at the effect of an
STAT 350 Final (new Material) Review Problems Key Spring 2016
 Review Problems Key Spring 2016") 1. The editor of a statistics textbook would like to plan for the next edition. A key variable is the number of pages that will be in the final version. Text files are prepared by the authors using LaTeX,
1. The editor of a statistics textbook would like to plan for the next edition. A key variable is the number of pages that will be in the final version. Text files are prepared by the authors using LaTeX,
Business Statistics. Lecture 9: Simple Regression
 Business Statistics Lecture 9: Simple Regression 1 On to Model Building! Up to now, class was about descriptive and inferential statistics Numerical and graphical summaries of data Confidence intervals
Upon completion of this chapter, you should be able to:
 1 Chaptter 7:: CORRELATIION Upon completion of this chapter, you should be able to: Explain the concept of relationship between variables Discuss the use of the statistical tests to determine correlation
WISE Regression/Correlation Interactive Lab. Introduction to the WISE Correlation/Regression Applet
 WISE Regression/Correlation Interactive Lab Introduction to the WISE Correlation/Regression Applet This tutorial focuses on the logic of regression analysis with special attention given to variance components.
Regression Analysis. BUS 735: Business Decision Making and Research
 Regression Analysis BUS 735: Business Decision Making and Research 1 Goals and Agenda Goals of this section Specific goals Learn how to detect relationships between ordinal and categorical variables. Learn
Ch. 16: Correlation and Regression
 Ch. 1: Correlation and Regression With the shift to correlational analyses, we change the very nature of the question we are asking of our data. Heretofore, we were asking if a difference was likely to
Final Exam STAT On a Pareto chart, the frequency should be represented on the A) X-axis B) regression C) Y-axis D) none of the above
 X-axis B) regression C) Y-axis D) none of the above") King Abdul Aziz University Faculty of Sciences Statistics Department Final Exam STAT 0 First Term 49-430 A 40 Name No ID: Section: You have 40 questions in 9 pages. You have 90 minutes to solve the exam.
King Abdul Aziz University Faculty of Sciences Statistics Department Final Exam STAT 0 First Term 49-430 A 40 Name No ID: Section: You have 40 questions in 9 pages. You have 90 minutes to solve the exam.
Econometrics. 4) Statistical inference
 Statistical inference") 30C00200 Econometrics 4) Statistical inference Timo Kuosmanen Professor, Ph.D. http://nomepre.net/index.php/timokuosmanen Today s topics Confidence intervals of parameter estimates Student s t-distribution
30C00200 Econometrics 4) Statistical inference Timo Kuosmanen Professor, Ph.D. http://nomepre.net/index.php/timokuosmanen Today s topics Confidence intervals of parameter estimates Student s t-distribution
Taguchi Method and Robust Design: Tutorial and Guideline
 Taguchi Method and Robust Design: Tutorial and Guideline CONTENT 1. Introduction 2. Microsoft Excel: graphing 3. Microsoft Excel: Regression 4. Microsoft Excel: Variance analysis 5. Robust Design: An Example
10.1 Simple Linear Regression
 10.1 Simple Linear Regression Ulrich Hoensch Tuesday, December 1, 2009 The Simple Linear Regression Model We have two quantitative random variables X (the explanatory variable) and Y (the response variable).
Contents. Acknowledgments. xix
 Table of Preface Acknowledgments page xv xix 1 Introduction 1 The Role of the Computer in Data Analysis 1 Statistics: Descriptive and Inferential 2 Variables and Constants 3 The Measurement of Variables
Describing the Relationship between Two Variables
 1 Describing the Relationship between Two Variables Key Definitions Scatter : A graph made to show the relationship between two different variables (each pair of x s and y s) measured from the same equation.
Chs. 16 & 17: Correlation & Regression
 Chs. 16 & 17: Correlation & Regression With the shift to correlational analyses, we change the very nature of the question we are asking of our data. Heretofore, we were asking if a difference was likely
Dover- Sherborn High School Mathematics Curriculum Probability and Statistics
 Mathematics Curriculum A. DESCRIPTION This is a full year courses designed to introduce students to the basic elements of statistics and probability. Emphasis is placed on understanding terminology and
s e, which is large when errors are large and small Linear regression model
 Linear regression model we assume that two quantitative variables, x and y, are linearly related; that is, the the entire population of (x, y) pairs are related by an ideal population regression line y
Correlation and Regression
 Correlation and Regression Dr. Bob Gee Dean Scott Bonney Professor William G. Journigan American Meridian University 1 Learning Objectives Upon successful completion of this module, the student should
Graphing Equations in Slope-Intercept Form 4.1. Positive Slope Negative Slope 0 slope No Slope
 Slope-Intercept Form y = mx + b m = slope b = y-intercept Graphing Equations in Slope-Intercept Form 4.1 Positive Slope Negative Slope 0 slope No Slope Example 1 Write an equation in slope-intercept form
Using Tables and Graphing Calculators in Math 11
 Using Tables and Graphing Calculators in Math 11 Graphing calculators are not required for Math 11, but they are likely to be helpful, primarily because they allow you to avoid the use of tables in some
Simple Linear Regression: One Quantitative IV
 Simple Linear Regression: One Quantitative IV Linear regression is frequently used to explain variation observed in a dependent variable (DV) with theoretically linked independent variables (IV). For example,
Regression analysis is a tool for building mathematical and statistical models that characterize relationships between variables Finds a linear
 Regression analysis is a tool for building mathematical and statistical models that characterize relationships between variables Finds a linear relationship between: - one independent variable X and -
Wed, June 26, (Lecture 8-2). Nonlinearity. Significance test for correlation R-squared, SSE, and SST. Correlation in SPSS.
. Nonlinearity. Significance test for correlation R-squared, SSE, and SST. Correlation in SPSS.") Wed, June 26, (Lecture 8-2). Nonlinearity. Significance test for correlation R-squared, SSE, and SST. Correlation in SPSS. Last time, we looked at scatterplots, which show the interaction between two variables,
Wed, June 26, (Lecture 8-2). Nonlinearity. Significance test for correlation R-squared, SSE, and SST. Correlation in SPSS. Last time, we looked at scatterplots, which show the interaction between two variables,
Overview. Overview. Overview. Specific Examples. General Examples. Bivariate Regression & Correlation
 Bivariate Regression & Correlation Overview The Scatter Diagram Two Examples: Education & Prestige Correlation Coefficient Bivariate Linear Regression Line SPSS Output Interpretation Covariance ou already
3.2: Least Squares Regressions
 3.2: Least Squares Regressions Section 3.2 Least-Squares Regression After this section, you should be able to INTERPRET a regression line CALCULATE the equation of the least-squares regression line CALCULATE
Regression used to predict or estimate the value of one variable corresponding to a given value of another variable.
 CHAPTER 9 Simple Linear Regression and Correlation Regression used to predict or estimate the value of one variable corresponding to a given value of another variable. X = independent variable. Y = dependent
y = a + bx 12.1: Inference for Linear Regression Review: General Form of Linear Regression Equation Review: Interpreting Computer Regression Output
 12.1: Inference for Linear Regression Review: General Form of Linear Regression Equation y = a + bx y = dependent variable a = intercept b = slope x = independent variable Section 12.1 Inference for Linear
Analysis of Covariance. The following example illustrates a case where the covariate is affected by the treatments.
 Analysis of Covariance In some experiments, the experimental units (subjects) are nonhomogeneous or there is variation in the experimental conditions that are not due to the treatments. For example, a
Factorial Independent Samples ANOVA
 Factorial Independent Samples ANOVA Liljenquist, Zhong and Galinsky (2010) found that people were more charitable when they were in a clean smelling room than in a neutral smelling room. Based on that
1 Correlation and Inference from Regression
 1 Correlation and Inference from Regression Reading: Kennedy (1998) A Guide to Econometrics, Chapters 4 and 6 Maddala, G.S. (1992) Introduction to Econometrics p. 170-177 Moore and McCabe, chapter 12 is
Correlation and Regression Analysis. Linear Regression and Correlation. Correlation and Linear Regression. Three Questions.
 10/8/18 Correlation and Regression Analysis Correlation Analysis is the study of the relationship between variables. It is also defined as group of techniques to measure the association between two variables.
EDF 7405 Advanced Quantitative Methods in Educational Research MULTR.SAS
 EDF 7405 Advanced Quantitative Methods in Educational Research MULTR.SAS The data used in this example describe teacher and student behavior in 8 classrooms. The variables are: Y percentage of interventions
Can you tell the relationship between students SAT scores and their college grades?
 Correlation One Challenge Can you tell the relationship between students SAT scores and their college grades? A: The higher SAT scores are, the better GPA may be. B: The higher SAT scores are, the lower
Introduction and Descriptive Statistics p. 1 Introduction to Statistics p. 3 Statistics, Science, and Observations p. 5 Populations and Samples p.
 Preface p. xi Introduction and Descriptive Statistics p. 1 Introduction to Statistics p. 3 Statistics, Science, and Observations p. 5 Populations and Samples p. 6 The Scientific Method and the Design of
Gravity: How fast do objects fall? Student Advanced Version
 Gravity: How fast do objects fall? Student Advanced Version Kinematics is the study of how things move their position, velocity, and acceleration. Acceleration is always due to some force acting on an
Reminder: Univariate Data. Bivariate Data. Example: Puppy Weights. You weigh the pups and get these results: 2.5, 3.5, 3.3, 3.1, 2.6, 3.6, 2.
 TP: To review Standard Deviation, Residual Plots, and Correlation Coefficients HW: Do a journal entry on each of the calculator tricks in this lesson. Lesson slides will be posted with notes. Do Now: Write
Scatterplots. 3.1: Scatterplots & Correlation. Scatterplots. Explanatory & Response Variables. Section 3.1 Scatterplots and Correlation
 3.1: Scatterplots & Correlation Scatterplots A scatterplot shows the relationship between two quantitative variables measured on the same individuals. The values of one variable appear on the horizontal
determine whether or not this relationship is.
 Section 9-1 Correlation A correlation is a between two. The data can be represented by ordered pairs (x,y) where x is the (or ) variable and y is the (or ) variable. There are several types of correlations
Inferences for Regression
 Inferences for Regression An Example: Body Fat and Waist Size Looking at the relationship between % body fat and waist size (in inches). Here is a scatterplot of our data set: Remembering Regression In
Multiple Regression. More Hypothesis Testing. More Hypothesis Testing The big question: What we really want to know: What we actually know: We know:
 Multiple Regression Ψ320 Ainsworth More Hypothesis Testing What we really want to know: Is the relationship in the population we have selected between X & Y strong enough that we can use the relationship
Simple Linear Regression
 Simple Linear Regression 1 Correlation indicates the magnitude and direction of the linear relationship between two variables. Linear Regression: variable Y (criterion) is predicted by variable X (predictor)
1 Introduction to Minitab
 1 Introduction to Minitab Minitab is a statistical analysis software package. The software is freely available to all students and is downloadable through the Technology Tab at my.calpoly.edu. When you
CORRELATION AND REGRESSION
 CORRELATION AND REGRESSION CORRELATION Introduction CORRELATION problems which involve measuring the strength of a relationship. Correlation Analysis involves various methods and techniques used for studying
Chapter 12: Estimation
 Chapter 12: Estimation Estimation In general terms, estimation uses a sample statistic as the basis for estimating the value of the corresponding population parameter. Although estimation and hypothesis
Simple Linear Regression: One Qualitative IV
 Simple Linear Regression: One Qualitative IV 1. Purpose As noted before regression is used both to explain and predict variation in DVs, and adding to the equation categorical variables extends regression
Independent Samples ANOVA
 Independent Samples ANOVA In this example students were randomly assigned to one of three mnemonics (techniques for improving memory) rehearsal (the control group; simply repeat the words), visual imagery
Warm-up Using the given data Create a scatterplot Find the regression line
 Time at the lunch table Caloric intake 21.4 472 30.8 498 37.7 335 32.8 423 39.5 437 22.8 508 34.1 431 33.9 479 43.8 454 42.4 450 43.1 410 29.2 504 31.3 437 28.6 489 32.9 436 30.6 480 35.1 439 33.0 444
Exam details. Final Review Session. Things to Review
 Exam details Final Review Session Short answer, similar to book problems Formulae and tables will be given You CAN use a calculator Date and Time: Dec. 7, 006, 1-1:30 pm Location: Osborne Centre, Unit
5:1LEC - BETWEEN-S FACTORIAL ANOVA
 5:1LEC - BETWEEN-S FACTORIAL ANOVA The single-factor Between-S design described in previous classes is only appropriate when there is just one independent variable or factor in the study. Often, however,
4.1 Introduction. 4.2 The Scatter Diagram. Chapter 4 Linear Correlation and Regression Analysis
 4.1 Introduction Correlation is a technique that measures the strength (or the degree) of the relationship between two variables. For example, we could measure how strong the relationship is between people
SPSS and its usage 2073/06/07 06/12. Dr. Bijay Lal Pradhan Dr Bijay Lal Pradhan
 SPSS and its usage 2073/06/07 06/12 Dr. Bijay Lal Pradhan bijayprad@gmail.com http://bijaylalpradhan.com.np Ground Rule Mobile Penalty System Involvement Object of session I Define Statistics and SPSS
Chapter 10. Correlation and Regression. McGraw-Hill, Bluman, 7th ed., Chapter 10 1
 Chapter 10 Correlation and Regression McGraw-Hill, Bluman, 7th ed., Chapter 10 1 Example 10-2: Absences/Final Grades Please enter the data below in L1 and L2. The data appears on page 537 of your textbook.
Least-Squares Regression. Unit 3 Exploring Data
 Least-Squares Regression Unit 3 Exploring Data Regression Line A straight line that describes how a variable,, changes as an variable,, changes unlike, requires an and variable used to predict the value
Chapter 10. Regression. Understandable Statistics Ninth Edition By Brase and Brase Prepared by Yixun Shi Bloomsburg University of Pennsylvania
 Chapter 10 Regression Understandable Statistics Ninth Edition By Brase and Brase Prepared by Yixun Shi Bloomsburg University of Pennsylvania Scatter Diagrams A graph in which pairs of points, (x, y), are
Six Sigma Black Belt Study Guides
 Six Sigma Black Belt Study Guides 1 www.pmtutor.org Powered by POeT Solvers Limited. Analyze Correlation and Regression Analysis 2 www.pmtutor.org Powered by POeT Solvers Limited. Variables and relationships
Basic Statistics Exercises 66
 Basic Statistics Exercises 66 42. Suppose we are interested in predicting a person's height from the person's length of stride (distance between footprints). The following data is recorded for a random
Determining the Conductivity of Standard Solutions
 Determining the Conductivity of Standard Solutions by Anna Cole and Shannon Clement Louisiana Curriculum Framework Content Strand: Science as Inquiry, Physical Science Grade Level 11-12 Objectives: 1.
Module 2A Turning Multivariable Models into Interactive Animated Simulations
 Module 2A Turning Multivariable Models into Interactive Animated Simulations Using tools available in Excel, we will turn a multivariable model into an interactive animated simulation. Projectile motion,
y n 1 ( x i x )( y y i n 1 i y 2
( y y i n 1 i y 2") STP3 Brief Class Notes Instructor: Ela Jackiewicz Chapter Regression and Correlation In this chapter we will explore the relationship between two quantitative variables, X an Y. We will consider n ordered
STP3 Brief Class Notes Instructor: Ela Jackiewicz Chapter Regression and Correlation In this chapter we will explore the relationship between two quantitative variables, X an Y. We will consider n ordered
(ii) Scan your answer sheets INTO ONE FILE only, and submit it in the drop-box.
 Scan your answer sheets INTO ONE FILE only, and submit it in the drop-box.") FINAL EXAM ** Two different ways to submit your answer sheet (i) Use MS-Word and place it in a drop-box. (ii) Scan your answer sheets INTO ONE FILE only, and submit it in the drop-box. Deadline: December
FINAL EXAM ** Two different ways to submit your answer sheet (i) Use MS-Word and place it in a drop-box. (ii) Scan your answer sheets INTO ONE FILE only, and submit it in the drop-box. Deadline: December
regression analysis is a type of inferential statistics which tells us whether relationships between two or more variables exist
 regression analysis is a type of inferential statistics which tells us whether relationships between two or more variables exist sales $ (y - dependent variable) advertising $ (x - independent variable)
Lecture 14. Analysis of Variance * Correlation and Regression. The McGraw-Hill Companies, Inc., 2000
 Lecture 14 Analysis of Variance * Correlation and Regression Outline Analysis of Variance (ANOVA) 11-1 Introduction 11-2 Scatter Plots 11-3 Correlation 11-4 Regression Outline 11-5 Coefficient of Determination
Course Review. Kin 304W Week 14: April 9, 2013
 Course Review Kin 304W Week 14: April 9, 2013 1 Today s Outline Format of Kin 304W Final Exam Course Review Hand back marked Project Part II 2 Kin 304W Final Exam Saturday, Thursday, April 18, 3:30-6:30
Lecture 14. Outline. Outline. Analysis of Variance * Correlation and Regression Analysis of Variance (ANOVA)
") Outline Lecture 14 Analysis of Variance * Correlation and Regression Analysis of Variance (ANOVA) 11-1 Introduction 11- Scatter Plots 11-3 Correlation 11-4 Regression Outline 11-5 Coefficient of Determination
Outline Lecture 14 Analysis of Variance * Correlation and Regression Analysis of Variance (ANOVA) 11-1 Introduction 11- Scatter Plots 11-3 Correlation 11-4 Regression Outline 11-5 Coefficient of Determination
Computer simulation of radioactive decay
 Computer simulation of radioactive decay y now you should have worked your way through the introduction to Maple, as well as the introduction to data analysis using Excel Now we will explore radioactive
Basic Statistical Analysis
 indexerrt.qxd 8/21/2002 9:47 AM Page 1 Corrected index pages for Sprinthall Basic Statistical Analysis Seventh Edition indexerrt.qxd 8/21/2002 9:47 AM Page 656 Index Abscissa, 24 AB-STAT, vii ADD-OR rule,
Preview from Notesale.co.uk Page 3 of 63
 Stem-and-leaf diagram - vertical numbers on far left represent the 10s, numbers right of the line represent the 1s The mean should not be used if there are extreme scores, or for ranks and categories Unbiased
Ecn Analysis of Economic Data University of California - Davis February 23, 2010 Instructor: John Parman. Midterm 2. Name: ID Number: Section:
 Ecn 102 - Analysis of Economic Data University of California - Davis February 23, 2010 Instructor: John Parman Midterm 2 You have until 10:20am to complete this exam. Please remember to put your name,
Statistics and Quantitative Analysis U4320
 Statistics and Quantitative Analysis U3 Lecture 13: Explaining Variation Prof. Sharyn O Halloran Explaining Variation: Adjusted R (cont) Definition of Adjusted R So we'd like a measure like R, but one
AIM HIGH SCHOOL. Curriculum Map W. 12 Mile Road Farmington Hills, MI (248)
") AIM HIGH SCHOOL Curriculum Map 2923 W. 12 Mile Road Farmington Hills, MI 48334 (248) 702-6922 www.aimhighschool.com COURSE TITLE: Statistics DESCRIPTION OF COURSE: PREREQUISITES: Algebra 2 Students will
AIM HIGH SCHOOL Curriculum Map 2923 W. 12 Mile Road Farmington Hills, MI 48334 (248) 702-6922 www.aimhighschool.com COURSE TITLE: Statistics DESCRIPTION OF COURSE: PREREQUISITES: Algebra 2 Students will
LHS Algebra Pre-Test
 Your Name Teacher Block Grade (please circle): 9 10 11 12 Course level (please circle): Honors Level 1 Instructions LHS Algebra Pre-Test The purpose of this test is to see whether you know Algebra 1 well
STAT 328 (Statistical Packages)
") Department of Statistics and Operations Research College of Science King Saud University Exercises STAT 328 (Statistical Packages) nashmiah r.alshammari ^-^ Excel and Minitab - 1 - Write the commands of
Department of Statistics and Operations Research College of Science King Saud University Exercises STAT 328 (Statistical Packages) nashmiah r.alshammari ^-^ Excel and Minitab - 1 - Write the commands of
Bivariate Data Summary
 Bivariate Data Summary Bivariate data data that examines the relationship between two variables What individuals to the data describe? What are the variables and how are they measured Are the variables
Chs. 15 & 16: Correlation & Regression
 Chs. 15 & 16: Correlation & Regression With the shift to correlational analyses, we change the very nature of the question we are asking of our data. Heretofore, we were asking if a difference was likely
Correlation Analysis
 Simple Regression Correlation Analysis Correlation analysis is used to measure strength of the association (linear relationship) between two variables Correlation is only concerned with strength of the
Inference for Regression Simple Linear Regression
 Inference for Regression Simple Linear Regression IPS Chapter 10.1 2009 W.H. Freeman and Company Objectives (IPS Chapter 10.1) Simple linear regression p Statistical model for linear regression p Estimating
Review of Section 1.1. Mathematical Models. Review of Section 1.1. Review of Section 1.1. Functions. Domain and range. Piecewise functions
 Review of Section 1.1 Functions Mathematical Models Domain and range Piecewise functions January 19, 2017 Even and odd functions Increasing and decreasing functions Mathematical Models January 19, 2017
MEASUREMENT OF THE CHARGE TO MASS RATIO (e/m e ) OF AN ELECTRON
 OF AN ELECTRON") MEASUREMENT OF THE CHARGE TO MASS RATIO (e/m e ) OF AN ELECTRON Object This experiment will allow you to observe and understand the motion of a charged particle in a magnetic field and to measure the ratio
MEASUREMENT OF THE CHARGE TO MASS RATIO (e/m e ) OF AN ELECTRON Object This experiment will allow you to observe and understand the motion of a charged particle in a magnetic field and to measure the ratio
4 Multicategory Logistic Regression
 4 Multicategory Logistic Regression 4.1 Baseline Model for nominal response Response variable Y has J > 2 categories, i = 1,, J π 1,..., π J are the probabilities that observations fall into the categories
Correlation and Regression
 Correlation and Regression October 25, 2017 STAT 151 Class 9 Slide 1 Outline of Topics 1 Associations 2 Scatter plot 3 Correlation 4 Regression 5 Testing and estimation 6 Goodness-of-fit STAT 151 Class
Interactions. Interactions. Lectures 1 & 2. Linear Relationships. y = a + bx. Slope. Intercept
 Interactions Lectures 1 & Regression Sometimes two variables appear related: > smoking and lung cancers > height and weight > years of education and income > engine size and gas mileage > GMAT scores and
Error Analysis, Statistics and Graphing Workshop
 Error Analysis, Statistics and Graphing Workshop Percent error: The error of a measurement is defined as the difference between the experimental and the true value. This is often expressed as percent (%)