SPSS and its usage 2073/06/07 06/12. Dr. Bijay Lal Pradhan Dr Bijay Lal Pradhan
|
|
|
- Berniece Dalton
- 6 years ago
- Views:
Transcription

1 SPSS and its usage 2073/06/07 06/12 Dr. Bijay Lal Pradhan
2 Ground Rule Mobile Penalty System Involvement
3 Object of session I Define Statistics and SPSS Install SPSS 20 and crack Open and exit SPSS Importing and exporting data Different format of files
4 What is Statistics? Singular form: The process of collection, organization, presentation, analysis and interpretation of number facts. Plural form: Aggregate of facts which has different characteristics. Comparable Numerous factors effects Numerically expressed Systematically collected Purposefully collected Accurate reasonably
5 Introduction: What is SPSS? Originally it is an acronym of Statistical Package for the Social Science but now it stands for Statistical Product and Service Solutions One of the most popular statistical packages which can perform highly complex data organization, presentation and analysis with simple instructions.
6 The Three Windows: Data editor Output viewer Syntax editor

7 The Three Windows: Data Editor Data Editor Spreadsheet-like system for defining, entering, editing, and displaying data. Extension of the saved file will be sav.

8 The Three Windows: Output Viewer Output Viewer Displays output and errors. Extension of the saved file will be spv.

9 The Three Windows: Syntax editor Syntax Editor Text editor for syntax composition. Extension of the saved file will be sps.
10 The basics of managing software.
11 Installation of SPSS 20.0 You have software SPSS 20.0 in your computer There are two folders namely setup and crack Open setup folder and double click on application file setup. Follow the instruction and install SPSS in your computer. Don t go for licensing process. Copy "lservrc" from crack folder and paste it into the installed directory (C:\Programme\ IBM\SPSS\Statistics\20)

12 Opening Screen From start button click on IBM SPSS Statistics 20

13 Obtain the data Open your saved file with SPSS data1.sav

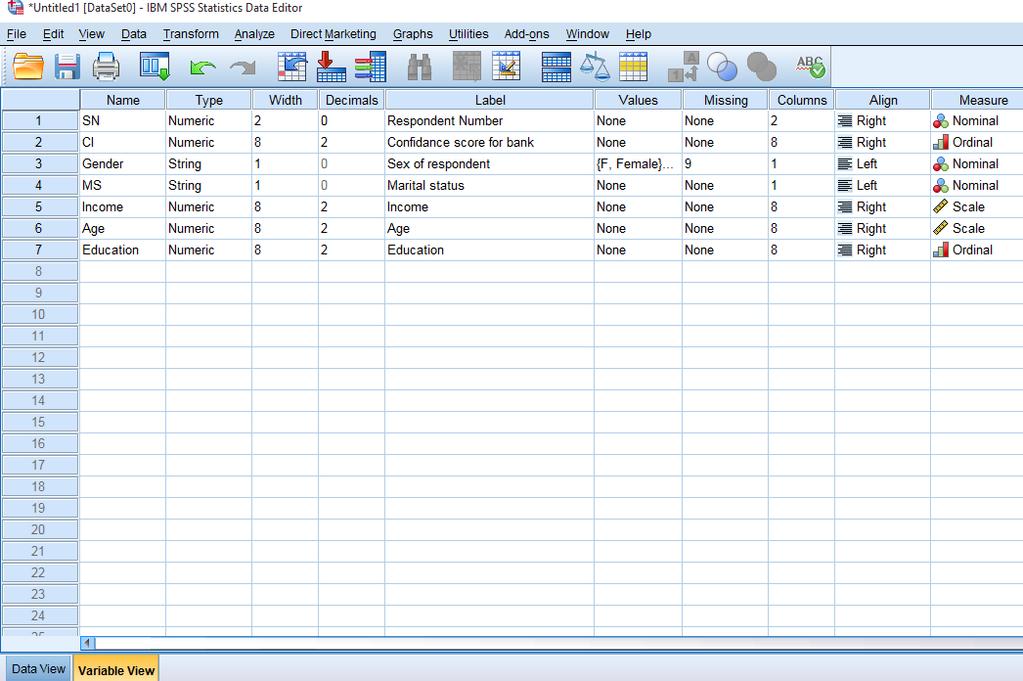
14 Variable descriptions Drop down menus Variable View Action buttons

15 Variable View window: Type Type Click on the type box. The two basic types of variables that you will use are numeric and string. This column enables you to specify the type of variable.
16 Variable View window: Width Width Width allows you to determine the number of characters SPSS will allow to be entered for the variable

17 Variable View window: Decimals Decimals Number of decimals It has to be less than or equal to
18 Variable View window: Label Label You can specify the details of the variable You can write characters with spaces up to 256 characters
19 Variable View window: Values Values This is used and to suggest which numbers represent which categories when the variable represents a category


20 Defining the value labels Click the cell in the values column as shown below For the value, and the label, you can put up to 60 characters. After defining the values click add and then click OK. Click

21 Measure scale?? Nominal Ordinal Scale

22 Nominal Gender Caste Marital status

23 Ordinal? First Second Third..

24 Scale Scale
25 Scales of Measure Scale Basic Characteristics Nominal Numbers identify & classify objects Ordinal Scale Nos. indicate the relative positions of objects but not the magnitude of differences between them Zero point is fixed, ratios of scale values can be compared Examples Examples Social Security nos., numbering of football players Quality rankings, rankings of teams in a tournament Length, weight Brand nos., store types Preference rankings, market position, social class Age, sales, income, costs Permissible Statistics Descriptive Inferential Percentages, mode Percentile, median quartile deviation Arithmatic, Geometric harmonic mean range MD SD Chi-square, binomial test Rank-order correlation, Friedman ANOVA Z test, t-test, ANOVA test all other tests

26 Data Editor Action buttons

27 SPSS output viewer Drop down menus Action buttons Navigation window

28 SPSS Viewer export results

29 Syntax Editor Drop down menus Action buttons Navigation window
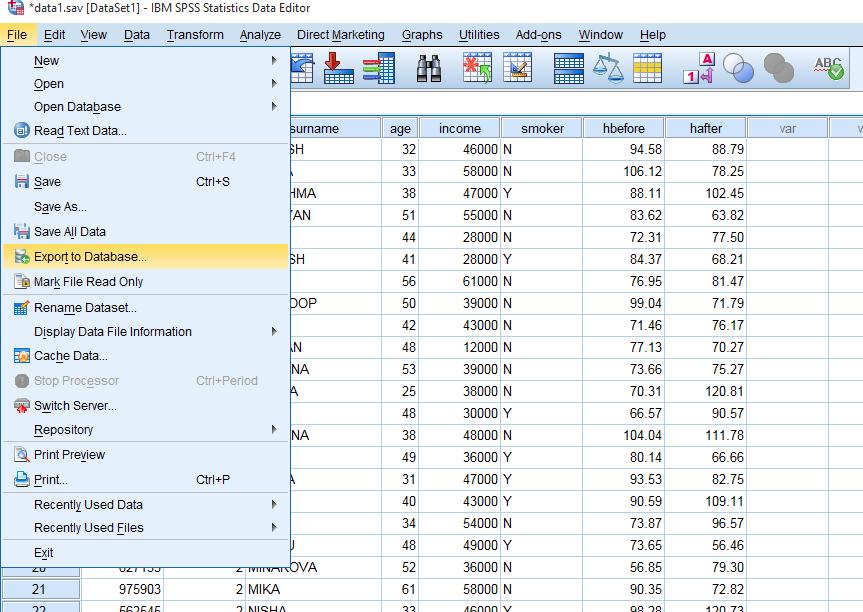
30 Export
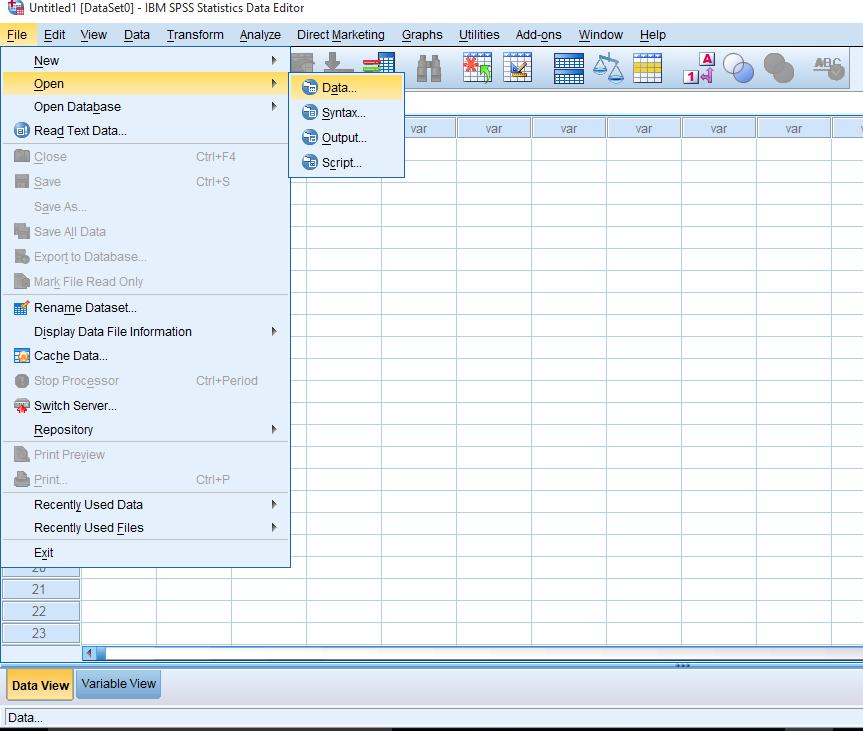
31 Import
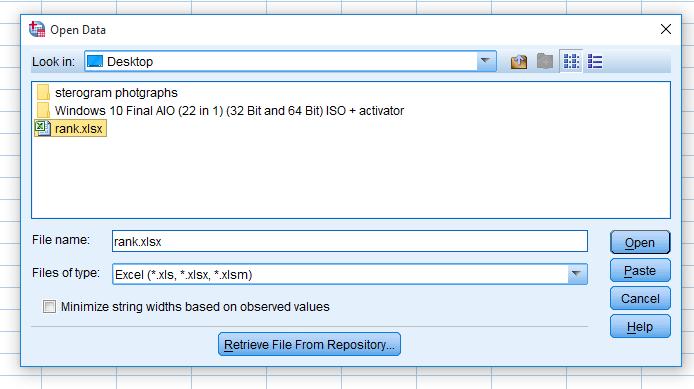
32 Import
33 Data management with SPSS
34 Practice 1 Construct the following variables in the variable view on the basis of following information A study was conducted to know the attitude of a bank s customer towards the bank. The question asked to the customer was: Do you feel safe in your transactions with the bank? The respondents were to answer the question on a seven-point scale (1 = Strongly Disagree, 7 = Strongly Agree). There were other variables mentioned below on which data was collected. Strongly disagree 1 No difference 4 Little agree 5 Moderately disagree 2 Moderately agree 6 Little disagree 3 Strongly agree 7
35 Other variable 1. Sex of the respondent Male - M Female - F 2. Marital status Married - M Single - S 3. Income of the respondent (in rupees) 4. Age of the respondent (in years) 5. Educational background of the respondent Below higher secondary - 1 Higher secondary - 2 Graduation - 3 Post graduation - 4

36 Click
37 Entering Data Copy paste can be done to copy it from word to SPSS. First copy paste in to MS Excel and then to SPSS. Save the data in Excel and import to SPSS Or save in CSV format then to SPSS
38 Variable/Case in and out Entering new variable Deleting the existing variable Entering new case Deleting the existing cases

39 Saving the data To save the data file you created simply click file and click save as. You can save the file in different forms by clicking Save as type. Click

40 Sorting the data Click Data and then click Sort Cases
")


41 Sorting the data (cont d) Double Click Name of the students. Then click ok. Click Click

42 Transforming data Click Transform and then click Compute Variable

43 Transforming data (cont d) Example: Adding a new variable named corrected_ci which is corrected confidence interval Type in corrected_ci in the Target Variable box. Then type in 8-CI in the Numeric Expression box. Click OK Click
44 Transforming data (cont d) In the same way find the log(income) Type in ln_income in the Target Variable box. Then type in lnincome in the Numeric Expression box. Click OK In the similar manner Create a new variable named sqrtage which is the square root of age.
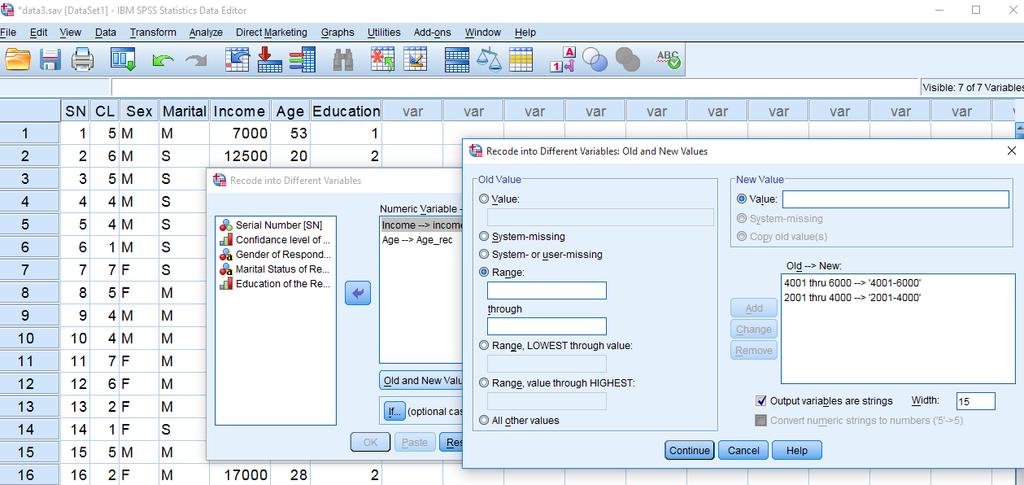
45 Visual Binning Visual Binning is the process of arranging data in a suitable class. So that we can tabulate data and can be drawn conclusion from the scale type of data.
46 The basic analysis using SPSS

47 Scopes & Limitations of Data Analysis Collection Organization Presentation Analysis Reporting If the data were collected from a random sample drawn from a well-defined population in such a way that every unit in the population has a known non-zero probability of being included in the sample, then the information derived from such sample can be generalized to the population (inferential statistics). If the data were collected from a non-random sample, then the information derived from sample cannot be generalized (descriptive statistics). If data and variables are not properly organized in a computer, then computer software fail to provide meaningful results.
48 Condensation of Data Summarizing data in tables and graphs (stem and leaf display, line graph, bar graph, pie chart and Histogram, measure of central tendency and measure of dispersion. 1. small tables (frequency tables) 2. graphs or diagrams (histogram, bar graph, pie chart etc.) 3. summary statistics (percentage, mean, standard deviation etc.)
49 The basic analysis of SPSS that will be introduced in this class Frequencies This analysis produces frequency tables showing frequency counts and percentages of the values of individual variables. Graphical Presentation Pie chart, Bar chart, Histogram, Area chart, Line chart, Scatter plot Descriptive Statistics This analysis shows the maximum, minimum, mean, and standard deviation of the variables
50 Descriptive & Inferential Statistics Statistics Descriptive Inferential Estimation Hypothesis Testing Tabular Graphical Numerical Point Interval Parametric Non-Parametric The methods of inferential statistics are applicable when results are obtained from a random. Uncertainty always remains while generalizing results from a sample to a population. The degree of uncertainty is measured in terms of probability in inferential statistics.
51 Univariate Data Analysis Analysis of data of a single variable at a time is univariate analysis. The suitable univariate data analysis methods by scale of variables are listed below Nominal or Ordinal What type of data? Scale data 1. Prepare frequency table 2. Compute mode 3. Compute median (ordinal) 4. Draw graphs Bar diagram Pie-chart 5. Chi-square test 1. Prepare frequency table (discrete) 2. Compute mean. Median and mode 3. Compute positional statistics 4. Compute SD, range etc. 5. Draw graphs. Steam-and-leaf plot (discrete). Box-Whisker plot. Histogram (continuous). Bar diagram (discrete). 6. Z, t, F & 2 tests 7. Transform into categorical.
52 Bivariate Data Analysis Analysis of data of two variables at a time. The kinds of data analysis are listed below. Nominal Ordinal 1. Prepare two-way frequency tables 2. Compute row or column percentages 3. Draw charts and diagrams 4. Test hypotheses (chi-square test of independence) 1. Prepare two-way frequency tables Scale 2. Draw Scatter diagram 3. Test hypotheses (chi-square, z, t, F tests) 4. Carry out correlation & simple regression analysis


53 Frequency Distribution Frequency distribution of a nominal/ordinal data
54 Frequency Distribution

55 Frequency table of scale data
56 Frequency distribution
")
57 Stem Leaf Display Income of the Respondent Stem-and-Leaf Plot Frequency Stem & Leaf Stem width: Each leaf: 1 case(s)
58 Diagrammatic Presentation Bar diagram Line graphs Pie diagram Scatter diagram Histogram
59 Descriptive measures Measure of Central Tendency Mean Arithmetic, Geometric, Harmonic Median Mode Measure of dispersion range QD SD

60 Mean value for ungrouped data

61 Next method for mean

62 Mean Value for Grouped Data Height Mid value frequency Go to: Data>weight cases Select weight cases by frequency and select ok Then find out mean using mid value as variable


63 Changing Report Row-Column
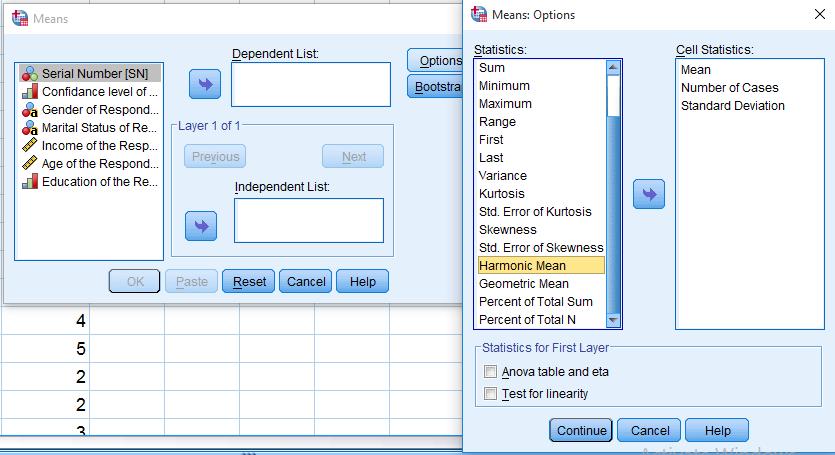
64 Skewness - Kurtosis Use compare mean and find out skewness and kurtosis of the data
65 Bivariate Data Analysis Analysis of data of two variables at a time. The kinds of data analysis are listed below. Nominal Ordinal 1. Prepare two-way frequency tables 2. Compute row or column percentages 3. Draw charts and diagrams 4. Test hypotheses (chi-square test of independence) 1. Prepare two-way frequency tables Scale 2. Draw Scatter diagram 3. Test hypotheses (chi-square, z, t, F tests) 4. Carry out correlation & simple regression analysis
66 Estimation Point Estimation Interval estimation Confidence Interval (Analyse>descriptive statistics>explore>estimation)
67 Fundamental of Hypothesis Testing There two types of statistical inferences, Estimation and Hypothesis Testing Hypothesis Testing: A hypothesis is a claim (assumption) about one or more population parameters. Average price of a lunch in hetauda is μ = Rs 200 The population mean monthly cell phone bill of this city is: μ = Rs 125 The average number of TV sets in Homes is equal to three; μ = 2
68 It Is always about a population parameter, not about a sample statistic Sample evidence is used to assess the probability that the claim about the population parameter is true A. It starts with Null Hypothesis, H 0 H:μ 0 3 and X=2.79 We begin with the assumption that H 0 is true and any difference between the sample statistic and true population parameter is due to chance and not a real (systematic) difference. Always contains =, or sign May or may not be rejected
69 B. Next we state the Alternative Hypothesis, H 1 Is the opposite of the null hypothesis e.g., The average number of TV sets in homes is not equal to 2 ( H 1 : μ 2 ) Never contains the =, or sign May or may not be proven Is generally the hypothesis that the researcher is trying to prove. Evidence is always examined with respect to H 1, never with respect to H 0. We never accept H 0, we either reject or not reject it
70 A. Rejection Region Method: Divide the distribution into rejection and non-rejection regions Defines the unlikely values of the sample statistic if the null hypothesis is true, the critical value(s) Defines rejection region of the sampling distribution Rejection region(s) is designated by, (level of significance) Typical values are.01,.05, or.10 is selected by the researcher at the beginning provides the critical value(s) of the test
71 Rejection Region or Critical Value Approach: Level of significance = H 0 : μ = 12 H 1 : μ 12 a/2 Non-rejection region a /2 Represents critical value H 0 : μ 12 H 1 : μ > 12 H 0 : μ 12 H 1 : μ < 12 Two-tail test Upper-tail test Lower-tail test a a Rejection region is shaded
72 P-Value Approach P-value=Max. Probability of (Type I Error), calculated from the sample. Given the sample information what is the size of blue are? H 0 : μ = 12 H 1 : μ 12 Two-tail test 0 H 0 : μ 12 H 1 : μ > 12 Upper-tail test 0 H 0 : μ 12 H 1 : μ < 12 0
73 Type I and II Errors: The size of, the rejection region, affects the risk of making different types of incorrect decisions. Type I Error Rejecting a true null hypothesis when it should NOT be rejected Considered a serious type of error The probability of Type I Error is It is also called level of significance of the test Type II Error Fail to reject a false null hypothesis that should have been rejected The probability of Type II Error is β
74 Two types of decision errors: Type I error = erroneous rejection of true H 0 Type II error = erroneous retention of false H 0 Truth Decision H 0 true H 0 false Retain H 0 Correct retention Type II error Reject H 0 Type I error Correct rejection α probability of a Type I error β Probability of a Type II error
75 P-Value approach to Hypothesis Testing: That is to say that P-value is the smallest value of for which H 0 can be rejected based on the sample information Convert Sample Statistic (e.g., sample mean) to Test Statistic (e.g., Z statistic ) Obtain the p-value from a table or computer Compare the p-value with If p-value <, reject H 0 If p-value, do not reject H 0
76 P-value (Observed Significance Level) P-value - Measure of the strength of evidence the sample data provides against the null hypothesis: P(Evidence This strong or stronger against H 0 H 0 is true) P val : p P( Z zobs)
77 Test of Hypothesis for the Mean σ known The test statistic is: σ Unknown The test statistic is: Z X μ σ n t n-1 X μ S n
78 Steps to Hypothesis Testing 1. State the H 0 and H 1 clearly 2. Identify the test statistic (two-tail, one-tail, and type of test to be used) 3. Depending on the type of risk you are willing to take, specify the level of significance, 4. Find the decision rule, critical values, and rejection regions. If CV<actual value (sample statistic) <+CV, then do not reject the H 0 5. Collect the data and do the calculation for the actual values of the test statistic from the sample
79 Steps to Hypothesis testing, continued Make statistical decision Do not Reject H 0 Reject H 0 Conclude H 0 may be true Conclude H 1 is true (There is sufficient evidence of H1) Make management/business/admi nistrative decision
80 When do we use a two-tail test? when do we use a one-tail test? The answer depends on the question you are trying to answer. A two-tail is used when the researcher has no idea which direction the study will go, interested in both direction. (example: testing a new technique, a new product, a new theory and we don t know the direction) A new machine is producing 12 fluid once can of soft drink. The quality control manager is concern with cans containing too much or too little. Then, the test is a two-tailed test. That is the two rejection regions in tails is most likely (higher probability) to provide evidence of H 1. H H 1 0 : 12 oz : 12 oz 12
81 One-tail test is used when the researcher is interested in the direction. Example: The soft-drink company puts a label on cans claiming they contain 12 oz. A consumer advocate desires to test this statement. She would assume that each can contains at least 12 oz and tries to find evidence to the contrary. That is, she examines the evidence for less than 12 0z. What tail of the distribution is the most logical (higher probability) to find that evidence? The only way to reject the claim is to get evidence of less than 12 oz, left tail. H H 1 0 : 12 oz : 12 oz
82 Type of Hypothesis What to test Significance of means Single mean test Double mean test Dependent pairs Independent pairs More than two mean test
83 Correlation and Regression
84 How do we measure association between two variables? 1. For ordinal and nominal variable Odds Ratio (OR) Chi square test of independence of attributes 2. For scale variables Correlation Coefficient R Coefficient of Determination (R-Square)
85 Example A researcher believes that there is a linear relationship between BMI (Kg/m 2 ) of pregnant mothers and the birth-weight (BW in Kg) of their newborn The following data set provide information on 15 pregnant mothers who were contacted for this study
86 BMI (Kg/m 2 ) Birth-weight (Kg)
87 Scatter Diagram Scatter diagram is a graphical method to display the relationship between two variables Scatter diagram plots pairs of bivariate observations (x, y) on the X-Y plane Y is called the dependent variable X is called an independent variable
88 Scatter diagram of BMI and Birthweight
89 Is there a linear relationship between BMI and BW? Scatter diagrams are important for initial exploration of the relationship between two quantitative variables In the above example, we may wish to summarize this relationship by a straight line drawn through the scatter of points
90 Simple Linear Regression Although we could fit a line "by eye" e.g. using a transparent ruler, this would be a subjective approach and therefore unsatisfactory. An objective, and therefore better, way of determining the position of a straight line is to use the method of least squares. Using this method, we choose a line such that the sum of squares of vertical distances of all points from the line is minimized.
91 Least-squares or regression line These vertical distances, i.e., the distance between y values and their corresponding estimated values on the line are called residuals The line which fits the best is called the regression line or, sometimes, the leastsquares line The line always passes through the point defined by the mean of Y and the mean of X
92 Linear Regression Model The method of least-squares is available in most of the statistical packages (and also on some calculators) and is usually referred to as linear regression Y is also known as an outcome variable X is also called as a predictor
93 Estimated Regression Line y ˆ = ˆ + ˆ x = x ˆ is. called. y int ercept ˆ is. called. the. slope
94 Application of Regression Line This equation allows you to estimate BW of other newborns when the BMI is given. e.g., for a mother who has BMI=40, i.e. X = 40 we predict BW to be y ˆ = ˆ ˆ + x = (40) 3.096
95 Correlation Coefficient, R R is a measure of strength of the linear association between two variables, x and y. Most statistical packages and some hand calculators can calculate R For the data in our Example R=0.94 R has some unique characteristics
96 Correlation Coefficient, R R takes values between -1 and +1 R=0 represents no linear relationship between the two variables R>0 implies a direct linear relationship R<0 implies an inverse linear relationship The closer R comes to either +1 or -1, the stronger is the linear relationship
97 Coefficient of Determination R 2 is another important measure of linear association between x and y (0 R 2 1) R 2 measures the proportion of the total variation in y which is explained by x For example r 2 = , indicates that 87.51% of the variation in BW is explained by the independent variable x (BMI).
98 Difference between Correlation and Regression Correlation Coefficient, R, measures the strength of bivariate association The regression line is a prediction equation that estimates the values of y for any given x
99 Limitations of the correlation coefficient Though R measures how closely the two variables approximate a straight line, it does not validly measures the strength of nonlinear relationship When the sample size, n, is small we also have to be careful with the reliability of the correlation Outliers could have a marked effect on R Causal Linear Relationship

100 Regression Analysis Click Analyze, Regression, then click Linear from the main menu.


101 Regression Analysis For example let s analyze the model salbegin 0 1edu Put Beginning Salary as Dependent and Educational Level as Independent. Click Click
102 Regression Analysis Clicking OK gives the result

103 Plotting the regression line Click Graphs, Legacy Dialogs, Interactive, and Scatterplot from the main menu.


104 Plotting the regression line Drag Current Salary into the vertical axis box and Beginning Salary in the horizontal axis box. Click Fit bar. Make sure the Method is regression in the Fit box. Then click OK. Click Set this to Regression!

105
106 Is the model significant? r 2 is the proportion of the variance in y that is explained by our regression model SE is also another measure check significance through complicated F-statistic: F (dfŷ,df er ) = s ŷ 2 rearranging =...= r2 (n - 2) 2 1 r 2 s er 2 And we should know the significance of reg. coeff. t = byx S.E. If all these satisfies than we can say model is
107
108 For further Questions:
Chapter Fifteen. Frequency Distribution, Cross-Tabulation, and Hypothesis Testing
 Chapter Fifteen Frequency Distribution, Cross-Tabulation, and Hypothesis Testing Copyright 2010 Pearson Education, Inc. publishing as Prentice Hall 15-1 Internet Usage Data Table 15.1 Respondent Sex Familiarity
Glossary. The ISI glossary of statistical terms provides definitions in a number of different languages:
 Glossary The ISI glossary of statistical terms provides definitions in a number of different languages: http://isi.cbs.nl/glossary/index.htm Adjusted r 2 Adjusted R squared measures the proportion of the
What is Statistics? Statistics is the science of understanding data and of making decisions in the face of variability and uncertainty.
 What is Statistics? Statistics is the science of understanding data and of making decisions in the face of variability and uncertainty. Statistics is a field of study concerned with the data collection,
MIDTERM EXAMINATION (Spring 2011) STA301- Statistics and Probability
 STA301- Statistics and Probability") STA301- Statistics and Probability Solved MCQS From Midterm Papers March 19,2012 MC100401285 Moaaz.pk@gmail.com Mc100401285@gmail.com PSMD01 MIDTERM EXAMINATION (Spring 2011) STA301- Statistics and Probability
STA301- Statistics and Probability Solved MCQS From Midterm Papers March 19,2012 MC100401285 Moaaz.pk@gmail.com Mc100401285@gmail.com PSMD01 MIDTERM EXAMINATION (Spring 2011) STA301- Statistics and Probability
Contents. Acknowledgments. xix
 Table of Preface Acknowledgments page xv xix 1 Introduction 1 The Role of the Computer in Data Analysis 1 Statistics: Descriptive and Inferential 2 Variables and Constants 3 The Measurement of Variables
LAB 3 INSTRUCTIONS SIMPLE LINEAR REGRESSION
 LAB 3 INSTRUCTIONS SIMPLE LINEAR REGRESSION In this lab you will first learn how to display the relationship between two quantitative variables with a scatterplot and also how to measure the strength of
1 Introduction to Minitab
 1 Introduction to Minitab Minitab is a statistical analysis software package. The software is freely available to all students and is downloadable through the Technology Tab at my.calpoly.edu. When you
Chapter 2: Tools for Exploring Univariate Data
 Stats 11 (Fall 2004) Lecture Note Introduction to Statistical Methods for Business and Economics Instructor: Hongquan Xu Chapter 2: Tools for Exploring Univariate Data Section 2.1: Introduction What is
Using SPSS for One Way Analysis of Variance
 Using SPSS for One Way Analysis of Variance This tutorial will show you how to use SPSS version 12 to perform a one-way, between- subjects analysis of variance and related post-hoc tests. This tutorial
DETAILED CONTENTS PART I INTRODUCTION AND DESCRIPTIVE STATISTICS. 1. Introduction to Statistics
 DETAILED CONTENTS About the Author Preface to the Instructor To the Student How to Use SPSS With This Book PART I INTRODUCTION AND DESCRIPTIVE STATISTICS 1. Introduction to Statistics 1.1 Descriptive and
Introduction and Descriptive Statistics p. 1 Introduction to Statistics p. 3 Statistics, Science, and Observations p. 5 Populations and Samples p.
 Preface p. xi Introduction and Descriptive Statistics p. 1 Introduction to Statistics p. 3 Statistics, Science, and Observations p. 5 Populations and Samples p. 6 The Scientific Method and the Design of
AP Final Review II Exploring Data (20% 30%)
") AP Final Review II Exploring Data (20% 30%) Quantitative vs Categorical Variables Quantitative variables are numerical values for which arithmetic operations such as means make sense. It is usually a measure
AP Final Review II Exploring Data (20% 30%) Quantitative vs Categorical Variables Quantitative variables are numerical values for which arithmetic operations such as means make sense. It is usually a measure
Trendlines Simple Linear Regression Multiple Linear Regression Systematic Model Building Practical Issues
 Trendlines Simple Linear Regression Multiple Linear Regression Systematic Model Building Practical Issues Overfitting Categorical Variables Interaction Terms Non-linear Terms Linear Logarithmic y = a +
Review of Statistics 101
 Review of Statistics 101 We review some important themes from the course 1. Introduction Statistics- Set of methods for collecting/analyzing data (the art and science of learning from data). Provides methods
CIVL 7012/8012. Collection and Analysis of Information
 CIVL 7012/8012 Collection and Analysis of Information Uncertainty in Engineering Statistics deals with the collection and analysis of data to solve real-world problems. Uncertainty is inherent in all real
LAB 5 INSTRUCTIONS LINEAR REGRESSION AND CORRELATION
 LAB 5 INSTRUCTIONS LINEAR REGRESSION AND CORRELATION In this lab you will learn how to use Excel to display the relationship between two quantitative variables, measure the strength and direction of the
CHAPTER 10. Regression and Correlation
 CHAPTER 10 Regression and Correlation In this Chapter we assess the strength of the linear relationship between two continuous variables. If a significant linear relationship is found, the next step would
Business Statistics: Lecture 8: Introduction to Estimation & Hypothesis Testing
 Business Statistics: Lecture 8: Introduction to Estimation & Hypothesis Testing Agenda Introduction to Estimation Point estimation Interval estimation Introduction to Hypothesis Testing Concepts en terminology
Overview. Overview. Overview. Specific Examples. General Examples. Bivariate Regression & Correlation
 Bivariate Regression & Correlation Overview The Scatter Diagram Two Examples: Education & Prestige Correlation Coefficient Bivariate Linear Regression Line SPSS Output Interpretation Covariance ou already
MATH 1150 Chapter 2 Notation and Terminology
 MATH 1150 Chapter 2 Notation and Terminology Categorical Data The following is a dataset for 30 randomly selected adults in the U.S., showing the values of two categorical variables: whether or not the
y response variable x 1, x 2,, x k -- a set of explanatory variables
 11. Multiple Regression and Correlation y response variable x 1, x 2,, x k -- a set of explanatory variables In this chapter, all variables are assumed to be quantitative. Chapters 12-14 show how to incorporate
Review of Multiple Regression
 Ronald H. Heck 1 Let s begin with a little review of multiple regression this week. Linear models [e.g., correlation, t-tests, analysis of variance (ANOVA), multiple regression, path analysis, multivariate
Glossary for the Triola Statistics Series
 Glossary for the Triola Statistics Series Absolute deviation The measure of variation equal to the sum of the deviations of each value from the mean, divided by the number of values Acceptance sampling
Chapter 3 Multiple Regression Complete Example
 Department of Quantitative Methods & Information Systems ECON 504 Chapter 3 Multiple Regression Complete Example Spring 2013 Dr. Mohammad Zainal Review Goals After completing this lecture, you should be
Scales of Measuement Dr. Sudip Chaudhuri
 Scales of Measuement Dr. Sudip Chaudhuri M. Sc., M. Tech., Ph.D., M. Ed. Assistant Professor, G.C.B.T. College, Habra, India, Honorary Researcher, Saha Institute of Nuclear Physics, Life Member, Indian
Frequency Distribution Cross-Tabulation
 Frequency Distribution Cross-Tabulation 1) Overview 2) Frequency Distribution 3) Statistics Associated with Frequency Distribution i. Measures of Location ii. Measures of Variability iii. Measures of Shape
Module 8: Linear Regression. The Applied Research Center
 Module 8: Linear Regression The Applied Research Center Module 8 Overview } Purpose of Linear Regression } Scatter Diagrams } Regression Equation } Regression Results } Example Purpose } To predict scores
Do not copy, post, or distribute. Independent-Samples t Test and Mann- C h a p t e r 13
 C h a p t e r 13 Independent-Samples t Test and Mann- Whitney U Test 13.1 Introduction and Objectives This chapter continues the theme of hypothesis testing as an inferential statistical procedure. In
What is a Hypothesis?
 What is a Hypothesis? A hypothesis is a claim (assumption) about a population parameter: population mean Example: The mean monthly cell phone bill in this city is μ = $42 population proportion Example:
The entire data set consists of n = 32 widgets, 8 of which were made from each of q = 4 different materials.
 One-Way ANOVA Summary The One-Way ANOVA procedure is designed to construct a statistical model describing the impact of a single categorical factor X on a dependent variable Y. Tests are run to determine
Stat 101 Exam 1 Important Formulas and Concepts 1
 1 Chapter 1 1.1 Definitions Stat 101 Exam 1 Important Formulas and Concepts 1 1. Data Any collection of numbers, characters, images, or other items that provide information about something. 2. Categorical/Qualitative
BIOS 6222: Biostatistics II. Outline. Course Presentation. Course Presentation. Review of Basic Concepts. Why Nonparametrics.
 BIOS 6222: Biostatistics II Instructors: Qingzhao Yu Don Mercante Cruz Velasco 1 Outline Course Presentation Review of Basic Concepts Why Nonparametrics The sign test 2 Course Presentation Contents Justification
EDF 7405 Advanced Quantitative Methods in Educational Research MULTR.SAS
 EDF 7405 Advanced Quantitative Methods in Educational Research MULTR.SAS The data used in this example describe teacher and student behavior in 8 classrooms. The variables are: Y percentage of interventions
Descriptive Univariate Statistics and Bivariate Correlation
 ESC 100 Exploring Engineering Descriptive Univariate Statistics and Bivariate Correlation Instructor: Sudhir Khetan, Ph.D. Wednesday/Friday, October 17/19, 2012 The Central Dogma of Statistics used to
One-Way ANOVA. Some examples of when ANOVA would be appropriate include:
 One-Way ANOVA 1. Purpose Analysis of variance (ANOVA) is used when one wishes to determine whether two or more groups (e.g., classes A, B, and C) differ on some outcome of interest (e.g., an achievement
SPSS LAB FILE 1
 SPSS LAB FILE www.mcdtu.wordpress.com 1 www.mcdtu.wordpress.com 2 www.mcdtu.wordpress.com 3 OBJECTIVE 1: Transporation of Data Set to SPSS Editor INPUTS: Files: group1.xlsx, group1.txt PROCEDURE FOLLOWED:
Answer keys for Assignment 10: Measurement of study variables (The correct answer is underlined in bold text)
") Answer keys for Assignment 10: Measurement of study variables (The correct answer is underlined in bold text) 1. A quick and easy indicator of dispersion is a. Arithmetic mean b. Variance c. Standard deviation
Answer keys for Assignment 10: Measurement of study variables (The correct answer is underlined in bold text) 1. A quick and easy indicator of dispersion is a. Arithmetic mean b. Variance c. Standard deviation
Last Lecture. Distinguish Populations from Samples. Knowing different Sampling Techniques. Distinguish Parameters from Statistics
 Last Lecture Distinguish Populations from Samples Importance of identifying a population and well chosen sample Knowing different Sampling Techniques Distinguish Parameters from Statistics Knowing different
(quantitative or categorical variables) Numerical descriptions of center, variability, position (quantitative variables)
 Numerical descriptions of center, variability, position (quantitative variables)") 3. Descriptive Statistics Describing data with tables and graphs (quantitative or categorical variables) Numerical descriptions of center, variability, position (quantitative variables) Bivariate descriptions
3. Descriptive Statistics Describing data with tables and graphs (quantitative or categorical variables) Numerical descriptions of center, variability, position (quantitative variables) Bivariate descriptions
104 Business Research Methods - MCQs
 104 Business Research Methods - MCQs 1) Process of obtaining a numerical description of the extent to which a person or object possesses some characteristics a) Measurement b) Scaling c) Questionnaire
Statistics for Managers using Microsoft Excel 6 th Edition
 Statistics for Managers using Microsoft Excel 6 th Edition Chapter 3 Numerical Descriptive Measures 3-1 Learning Objectives In this chapter, you learn: To describe the properties of central tendency, variation,
The simple linear regression model discussed in Chapter 13 was written as
 1519T_c14 03/27/2006 07:28 AM Page 614 Chapter Jose Luis Pelaez Inc/Blend Images/Getty Images, Inc./Getty Images, Inc. 14 Multiple Regression 14.1 Multiple Regression Analysis 14.2 Assumptions of the Multiple
Ø Set of mutually exclusive categories. Ø Classify or categorize subject. Ø No meaningful order to categorization.
 Statistical Tools in Evaluation HPS 41 Fall 213 Dr. Joe G. Schmalfeldt Types of Scores Continuous Scores scores with a potentially infinite number of values. Discrete Scores scores limited to a specific
Bivariate Relationships Between Variables
 Bivariate Relationships Between Variables BUS 735: Business Decision Making and Research 1 Goals Specific goals: Detect relationships between variables. Be able to prescribe appropriate statistical methods
Mathematical Notation Math Introduction to Applied Statistics
 Mathematical Notation Math 113 - Introduction to Applied Statistics Name : Use Word or WordPerfect to recreate the following documents. Each article is worth 10 points and should be emailed to the instructor
Regression Analysis. BUS 735: Business Decision Making and Research
 Regression Analysis BUS 735: Business Decision Making and Research 1 Goals and Agenda Goals of this section Specific goals Learn how to detect relationships between ordinal and categorical variables. Learn
Ø Set of mutually exclusive categories. Ø Classify or categorize subject. Ø No meaningful order to categorization.
 Statistical Tools in Evaluation HPS 41 Dr. Joe G. Schmalfeldt Types of Scores Continuous Scores scores with a potentially infinite number of values. Discrete Scores scores limited to a specific number
1-1. Chapter 1. Sampling and Descriptive Statistics by The McGraw-Hill Companies, Inc. All rights reserved.
 1-1 Chapter 1 Sampling and Descriptive Statistics 1-2 Why Statistics? Deal with uncertainty in repeated scientific measurements Draw conclusions from data Design valid experiments and draw reliable conclusions
Introduction to Statistics
 Introduction to Statistics Data and Statistics Data consists of information coming from observations, counts, measurements, or responses. Statistics is the science of collecting, organizing, analyzing,
BIOL 51A - Biostatistics 1 1. Lecture 1: Intro to Biostatistics. Smoking: hazardous? FEV (l) Smoke
 Smoke") BIOL 51A - Biostatistics 1 1 Lecture 1: Intro to Biostatistics Smoking: hazardous? FEV (l) 1 2 3 4 5 No Yes Smoke BIOL 51A - Biostatistics 1 2 Box Plot a.k.a box-and-whisker diagram or candlestick chart
BIOL 51A - Biostatistics 1 1 Lecture 1: Intro to Biostatistics Smoking: hazardous? FEV (l) 1 2 3 4 5 No Yes Smoke BIOL 51A - Biostatistics 1 2 Box Plot a.k.a box-and-whisker diagram or candlestick chart
The science of learning from data.
 STATISTICS (PART 1) The science of learning from data. Numerical facts Collection of methods for planning experiments, obtaining data and organizing, analyzing, interpreting and drawing the conclusions
Regression analysis is a tool for building mathematical and statistical models that characterize relationships between variables Finds a linear
 Regression analysis is a tool for building mathematical and statistical models that characterize relationships between variables Finds a linear relationship between: - one independent variable X and -
LOOKING FOR RELATIONSHIPS
 LOOKING FOR RELATIONSHIPS One of most common types of investigation we do is to look for relationships between variables. Variables may be nominal (categorical), for example looking at the effect of an
20 Hypothesis Testing, Part I
 20 Hypothesis Testing, Part I Bob has told Alice that the average hourly rate for a lawyer in Virginia is $200 with a standard deviation of $50, but Alice wants to test this claim. If Bob is right, she
CHAPTER 5 LINEAR REGRESSION AND CORRELATION
 CHAPTER 5 LINEAR REGRESSION AND CORRELATION Expected Outcomes Able to use simple and multiple linear regression analysis, and correlation. Able to conduct hypothesis testing for simple and multiple linear
1 A Review of Correlation and Regression
 1 A Review of Correlation and Regression SW, Chapter 12 Suppose we select n = 10 persons from the population of college seniors who plan to take the MCAT exam. Each takes the test, is coached, and then
ECLT 5810 Data Preprocessing. Prof. Wai Lam
 ECLT 5810 Data Preprocessing Prof. Wai Lam Why Data Preprocessing? Data in the real world is imperfect incomplete: lacking attribute values, lacking certain attributes of interest, or containing only aggregate
A is one of the categories into which qualitative data can be classified.
 Chapter 2 Methods for Describing Sets of Data 2.1 Describing qualitative data Recall qualitative data: non-numerical or categorical data Basic definitions: A is one of the categories into which qualitative
Introduction to Basic Statistics Version 2
 Introduction to Basic Statistics Version 2 Pat Hammett, Ph.D. University of Michigan 2014 Instructor Comments: This document contains a brief overview of basic statistics and core terminology/concepts
Tastitsticsss? What s that? Principles of Biostatistics and Informatics. Variables, outcomes. Tastitsticsss? What s that?
 Tastitsticsss? What s that? Statistics describes random mass phanomenons. Principles of Biostatistics and Informatics nd Lecture: Descriptive Statistics 3 th September Dániel VERES Data Collecting (Sampling)
SESSION 5 Descriptive Statistics
 SESSION 5 Descriptive Statistics Descriptive statistics are used to describe the basic features of the data in a study. They provide simple summaries about the sample and the measures. Together with simple
Inferences About the Difference Between Two Means
 7 Inferences About the Difference Between Two Means Chapter Outline 7.1 New Concepts 7.1.1 Independent Versus Dependent Samples 7.1. Hypotheses 7. Inferences About Two Independent Means 7..1 Independent
Business Statistics. Lecture 10: Correlation and Linear Regression
 Business Statistics Lecture 10: Correlation and Linear Regression Scatterplot A scatterplot shows the relationship between two quantitative variables measured on the same individuals. It displays the Form
Statistics Boot Camp. Dr. Stephanie Lane Institute for Defense Analyses DATAWorks 2018
 Statistics Boot Camp Dr. Stephanie Lane Institute for Defense Analyses DATAWorks 2018 March 21, 2018 Outline of boot camp Summarizing and simplifying data Point and interval estimation Foundations of statistical
Unit 2. Describing Data: Numerical
 Unit 2 Describing Data: Numerical Describing Data Numerically Describing Data Numerically Central Tendency Arithmetic Mean Median Mode Variation Range Interquartile Range Variance Standard Deviation Coefficient
Retrieve and Open the Data
 Retrieve and Open the Data 1. To download the data, click on the link on the class website for the SPSS syntax file for lab 1. 2. Open the file that you downloaded. 3. In the SPSS Syntax Editor, click
Marquette University Executive MBA Program Statistics Review Class Notes Summer 2018
 Marquette University Executive MBA Program Statistics Review Class Notes Summer 2018 Chapter One: Data and Statistics Statistics A collection of procedures and principles
Units. Exploratory Data Analysis. Variables. Student Data
 Units Exploratory Data Analysis Bret Larget Departments of Botany and of Statistics University of Wisconsin Madison Statistics 371 13th September 2005 A unit is an object that can be measured, such as
Descriptive Statistics-I. Dr Mahmoud Alhussami
 Descriptive Statistics-I Dr Mahmoud Alhussami Biostatistics What is the biostatistics? A branch of applied math. that deals with collecting, organizing and interpreting data using well-defined procedures.
Statistics for Managers Using Microsoft Excel/SPSS Chapter 8 Fundamentals of Hypothesis Testing: One-Sample Tests
 Statistics for Managers Using Microsoft Excel/SPSS Chapter 8 Fundamentals of Hypothesis Testing: One-Sample Tests 1999 Prentice-Hall, Inc. Chap. 8-1 Chapter Topics Hypothesis Testing Methodology Z Test
Fundamentals to Biostatistics. Prof. Chandan Chakraborty Associate Professor School of Medical Science & Technology IIT Kharagpur
 Fundamentals to Biostatistics Prof. Chandan Chakraborty Associate Professor School of Medical Science & Technology IIT Kharagpur Statistics collection, analysis, interpretation of data development of new
The Empirical Rule, z-scores, and the Rare Event Approach
 Overview The Empirical Rule, z-scores, and the Rare Event Approach Look at Chebyshev s Rule and the Empirical Rule Explore some applications of the Empirical Rule How to calculate and use z-scores Introducing
Hypothesis testing. Data to decisions
 Hypothesis testing Data to decisions The idea Null hypothesis: H 0 : the DGP/population has property P Under the null, a sample statistic has a known distribution If, under that that distribution, the
9/2/2010. Wildlife Management is a very quantitative field of study. throughout this course and throughout your career.
 Introduction to Data and Analysis Wildlife Management is a very quantitative field of study Results from studies will be used throughout this course and throughout your career. Sampling design influences
Analytical Graphing. lets start with the best graph ever made
 Analytical Graphing lets start with the best graph ever made Probably the best statistical graphic ever drawn, this map by Charles Joseph Minard portrays the losses suffered by Napoleon's army in the Russian
Correlation and Regression (Excel 2007)
") Correlation and Regression (Excel 2007) (See Also Scatterplots, Regression Lines, and Time Series Charts With Excel 2007 for instructions on making a scatterplot of the data and an alternate method of
Correlation and Regression (Excel 2007) (See Also Scatterplots, Regression Lines, and Time Series Charts With Excel 2007 for instructions on making a scatterplot of the data and an alternate method of
CHAPTER 1. Introduction
 CHAPTER 1 Introduction Engineers and scientists are constantly exposed to collections of facts, or data. The discipline of statistics provides methods for organizing and summarizing data, and for drawing
AP Statistics Cumulative AP Exam Study Guide
 AP Statistics Cumulative AP Eam Study Guide Chapters & 3 - Graphs Statistics the science of collecting, analyzing, and drawing conclusions from data. Descriptive methods of organizing and summarizing statistics
Econ 325: Introduction to Empirical Economics
 Econ 325: Introduction to Empirical Economics Chapter 9 Hypothesis Testing: Single Population Ch. 9-1 9.1 What is a Hypothesis? A hypothesis is a claim (assumption) about a population parameter: population
401 Review. 6. Power analysis for one/two-sample hypothesis tests and for correlation analysis.
 401 Review Major topics of the course 1. Univariate analysis 2. Bivariate analysis 3. Simple linear regression 4. Linear algebra 5. Multiple regression analysis Major analysis methods 1. Graphical analysis
Introduction to ArcMap
 Introduction to ArcMap ArcMap ArcMap is a Map-centric GUI tool used to perform map-based tasks Mapping Create maps by working geographically and interactively Display and present Export or print Publish
Introduction to Statistical Analysis using IBM SPSS Statistics (v24)
") to Statistical Analysis using IBM SPSS Statistics (v24) to Statistical Analysis Using IBM SPSS Statistics is a two day instructor-led classroom course that provides an application-oriented introduction
to Statistical Analysis using IBM SPSS Statistics (v24) to Statistical Analysis Using IBM SPSS Statistics is a two day instructor-led classroom course that provides an application-oriented introduction
Review for Final. Chapter 1 Type of studies: anecdotal, observational, experimental Random sampling
 Review for Final For a detailed review of Chapters 1 7, please see the review sheets for exam 1 and. The following only briefly covers these sections. The final exam could contain problems that are included
Class 11 Maths Chapter 15. Statistics
 1 P a g e Class 11 Maths Chapter 15. Statistics Statistics is the Science of collection, organization, presentation, analysis and interpretation of the numerical data. Useful Terms 1. Limit of the Class
Announcements. Lecture 1 - Data and Data Summaries. Data. Numerical Data. all variables. continuous discrete. Homework 1 - Out 1/15, due 1/22
 Announcements Announcements Lecture 1 - Data and Data Summaries Statistics 102 Colin Rundel January 13, 2013 Homework 1 - Out 1/15, due 1/22 Lab 1 - Tomorrow RStudio accounts created this evening Try logging
4 Multicategory Logistic Regression
 4 Multicategory Logistic Regression 4.1 Baseline Model for nominal response Response variable Y has J > 2 categories, i = 1,, J π 1,..., π J are the probabilities that observations fall into the categories
psychological statistics
 psychological statistics B Sc. Counselling Psychology 011 Admission onwards III SEMESTER COMPLEMENTARY COURSE UNIVERSITY OF CALICUT SCHOOL OF DISTANCE EDUCATION CALICUT UNIVERSITY.P.O., MALAPPURAM, KERALA,
Lab 1 Uniform Motion - Graphing and Analyzing Motion
 Lab 1 Uniform Motion - Graphing and Analyzing Motion Objectives: < To observe the distance-time relation for motion at constant velocity. < To make a straight line fit to the distance-time data. < To interpret
Dover- Sherborn High School Mathematics Curriculum Probability and Statistics
 Mathematics Curriculum A. DESCRIPTION This is a full year courses designed to introduce students to the basic elements of statistics and probability. Emphasis is placed on understanding terminology and
Statistical Methods. by Robert W. Lindeman WPI, Dept. of Computer Science
 Statistical Methods by Robert W. Lindeman WPI, Dept. of Computer Science gogo@wpi.edu Descriptive Methods Frequency distributions How many people were similar in the sense that according to the dependent
Further Mathematics 2018 CORE: Data analysis Chapter 2 Summarising numerical data
 Chapter 2: Summarising numerical data Further Mathematics 2018 CORE: Data analysis Chapter 2 Summarising numerical data Extract from Study Design Key knowledge Types of data: categorical (nominal and ordinal)
9. Linear Regression and Correlation
 9. Linear Regression and Correlation Data: y a quantitative response variable x a quantitative explanatory variable (Chap. 8: Recall that both variables were categorical) For example, y = annual income,
375 PU M Sc Statistics
 375 PU M Sc Statistics 1 of 100 193 PU_2016_375_E For the following 2x2 contingency table for two attributes the value of chi-square is:- 20/36 10/38 100/21 10/18 2 of 100 120 PU_2016_375_E If the values
CS 5014: Research Methods in Computer Science. Statistics: The Basic Idea. Statistics Questions (1) Statistics Questions (2) Clifford A.
 Statistics Questions (2) Clifford A.") Department of Computer Science Virginia Tech Blacksburg, Virginia Copyright c 2015 by Clifford A. Shaffer Computer Science Title page Computer Science Clifford A. Shaffer Fall 2015 Clifford A. Shaffer
Department of Computer Science Virginia Tech Blacksburg, Virginia Copyright c 2015 by Clifford A. Shaffer Computer Science Title page Computer Science Clifford A. Shaffer Fall 2015 Clifford A. Shaffer
STP 420 INTRODUCTION TO APPLIED STATISTICS NOTES
 INTRODUCTION TO APPLIED STATISTICS NOTES PART - DATA CHAPTER LOOKING AT DATA - DISTRIBUTIONS Individuals objects described by a set of data (people, animals, things) - all the data for one individual make
STAT 350 Final (new Material) Review Problems Key Spring 2016
 Review Problems Key Spring 2016") 1. The editor of a statistics textbook would like to plan for the next edition. A key variable is the number of pages that will be in the final version. Text files are prepared by the authors using LaTeX,
1. The editor of a statistics textbook would like to plan for the next edition. A key variable is the number of pages that will be in the final version. Text files are prepared by the authors using LaTeX,
Analysis of Covariance (ANCOVA) with Two Groups
 with Two Groups") Chapter 226 Analysis of Covariance (ANCOVA) with Two Groups Introduction This procedure performs analysis of covariance (ANCOVA) for a grouping variable with 2 groups and one covariate variable. This procedure
Chapter 226 Analysis of Covariance (ANCOVA) with Two Groups Introduction This procedure performs analysis of covariance (ANCOVA) for a grouping variable with 2 groups and one covariate variable. This procedure
Overview of Dispersion. Standard. Deviation
 15.30 STATISTICS UNIT II: DISPERSION After reading this chapter, students will be able to understand: LEARNING OBJECTIVES To understand different measures of Dispersion i.e Range, Quartile Deviation, Mean
After completing this chapter, you should be able to:
 Chapter 2 Descriptive Statistics Chapter Goals After completing this chapter, you should be able to: Compute and interpret the mean, median, and mode for a set of data Find the range, variance, standard
A SHORT INTRODUCTION TO PROBABILITY
 A Lecture for B.Sc. 2 nd Semester, Statistics (General) A SHORT INTRODUCTION TO PROBABILITY By Dr. Ajit Goswami Dept. of Statistics MDKG College, Dibrugarh 19-Apr-18 1 Terminology The possible outcomes