Fundamentals to Biostatistics. Prof. Chandan Chakraborty Associate Professor School of Medical Science & Technology IIT Kharagpur
|
|
|
- Beryl Roberts
- 5 years ago
- Views:
Transcription
1 Fundamentals to Biostatistics Prof. Chandan Chakraborty Associate Professor School of Medical Science & Technology IIT Kharagpur
2 Statistics collection, analysis, interpretation of data development of new statistical theory & inference Math. Statistics Applied Statistics Biostatistics statistical methods are applied to medical, health and biological data application of the methods derived from math. statistics to subject specific areas like psychology, economics and public health Areas of application of Biostatistics: Environmental Health, Genetics, Pharmaceutical research, Nutrition, Epidemiology and Health surveys etc
3 Some Statistical Tools for Medical Data Analysis Data collection and Variables under study Descriptive Statistics & Sampling Distribution Statistical Inference Estimation, Hypothesis Testing, Conf. Interval Association Continuous: Correlation and Regression Categorical: Chi-square test Multivariate Analysis PCA, Clustering Techniques, Discriminantion & Classification Time Series Analysis AR, MA, ARMA, ARIMA

4 Population vs. Sample Parameter vs. Statistics
5 Variable Definition: characteristic of interest in a study that has different values for different individuals. Two types of variable Continuous: values form continuum Discrete: assume discrete set of values Examples Continuous: blood pressure Discrete: case/control, drug/placebo
6 Univariate Data Measurements on a single variable X Consider a continuous (numerical) variable Summarizing X Numerically Center Spread Graphically Boxplot Histogram 6
7 Measures of center: Mean The mean value of a variable is obtained by computing the total of the values divided by the number of values Appropriate for distributions that are fairly symmetrical It is sensitive to presence of outliers, since all values contribute equally 7
8 Measures of center: Median The median value of a variable is the number having 50% (half) of the values smaller than it (and the other half bigger) It is NOT sensitive to presence of outliers, since it ignores almost all of the data values The median is thus usually a more appropriate summary for skewed distributions 8
9 Measures of spread: SD The standard deviation (SD) of a variable is the square root of the average* of squared deviations from the mean (*for uninteresting technical reasons, instead of dividing by the number of values n, you usually divide by n-1) The SD is an appropriate measure of spread when center is measured with the mean 9
10 Quantiles The p th quantile is the number that has the proportion p of the data values smaller than it 30% 5.53 = 30 th percentile 10
11 Measures of spread: IQR The 25 th (Q 1 ), 50 th (median), and 75 th (Q 3 ) percentiles divide the data into 4 equal parts; these special percentiles are called quartiles The interquartile range (IQR) of a variable is the distance between Q 1 and Q 3 : IQR = Q 3 Q 1 The IQR is one way to measure spread when center is measured with the median 11
12 Five-number summary and boxplot An overall summary of the distribution of variable values is given by the five values: Min, Q 1, Median, Q 3, and Max A boxplot provides a visual summary of this fivenumber summary Display boxplots side-by-side to compare distributions of different data sets 12
13 Boxplot suspected outliers Q 3 median `whiskers Q 1 13
14 Histogram A histogram is a special kind of bar plot It allows you to visualize the distribution of values for a numerical variable When drawn with a density scale: the AREA (NOT height) of each bar is the proportion of observations in the interval the TOTAL AREA is 100% (or 1) 14
15 Bivariate Data Bivariate data are just what they sound like data with measurements on two variables; let s call them X and Y Here, we are looking at two continuous variables Want to explore the relationship between the two variables 15
16 Scatter plot We can graphically summarize a bivariate data set with a scatter plot (also sometimes called a scatter diagram) Plots values of one variable on the horizontal axis and values of the other on the vertical axis Can be used to see how values of 2 variables tend to move with each other (i.e. how the variables are associated) 16
17 Scatter plot: positive association 17
18 Scatter plot: negative association 18
19 Scatter plot: real data example 19
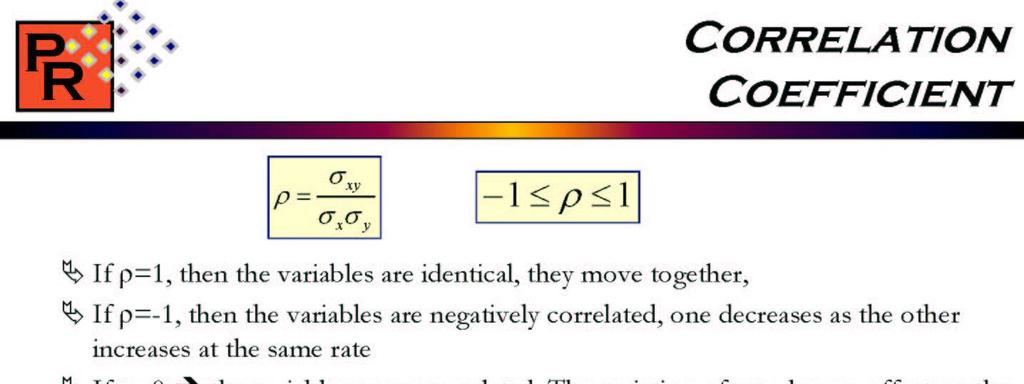
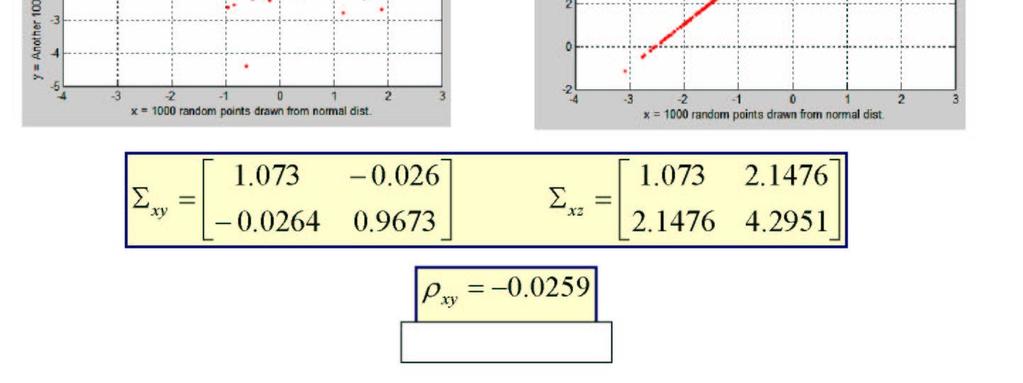
20 Correlation Coefficient r is a unitless quantity -1 r 1 r is a measure of LINEAR ASSOCIATION When r = 0, the points are not LINEARLY ASSOCIATED this does NOT mean there is NO ASSOCIATION 20
21 Breast cancer example Study on whether age at first child birth is an important risk factor for breast cancer (BC)
 in women paired samples Blood Pressure")
22 How does taking Oral Conceptive (OC) affect Blood Pressure (BP) in women paired samples Blood Pressure Example

23 Birthweight Example Determine the effectiveness of drug A on preventing premature birth. Independent samples.
24
25
26
27
28
29
30
31
32
33
34 Statistic Parameter Mean: X estimates _ Standard deviation: s estimates _ Proportion: p estimates _ from sample from entire population

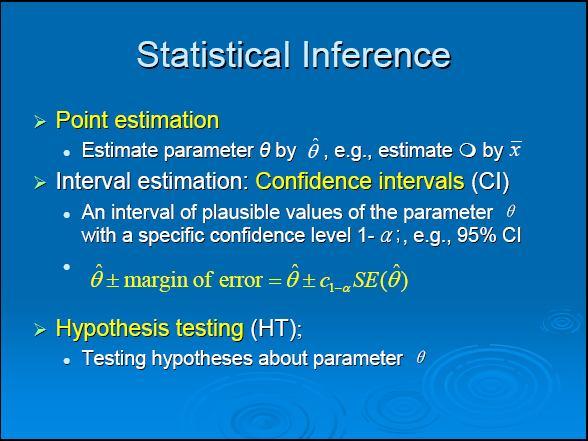
35 Population Mean,, is unknown Sampl e Point estimate Mean X = 50 Interval estimate I am 95% confident that is between 40 & 60

36 Parameter = Statistic ± Its Error
37 Sampling Distribution X or P X or P X or P
38 Standard Error Quantitative Variable SE (Mean) = S n Qualitative Variable SE (p) = p(1-p) n
39 Confidence Interval α/2 SE 1 - α SE Z-axis α/2 _ X 95% Samples X SE X SE
40 Confidence Interval α/2 1 - α α/2 SE SE Z-axis p 95% Samples p SE p SE
41 Interpretation of CI Probabilistic Practical In repeated sampling 100(1- )% of all intervals around sample means will in the long run include We are 100(1- )% confident that the single computed CI contains
42 Example (Sample size 30) An epidemiologist studied the blood glucose level of a random sample of 100 patients. The mean was 170, with a SD of 10. = X + Z SE SE = 10/10 = 1 95% Then CI: =
43 Example (Proportion) In a survey of 140 asthmatics, 35% had allergy to house dust. Construct the 95% CI for the population proportion. = p + Z P(1-p) SE = 0.35(1- n 0.35) % 43% = 0.04
44 Hypothesis testing A statistical method that uses sample data to evaluate a hypothesis about a population parameter. It is intended to help researchers differentiate between real and random patterns in the data.
45 Null & Alternative Hypotheses H 0 Null Hypothesis states the Assumption to be tested e.g. SBP of participants = 120 (H 0 : = 120). H 1 Alternative Hypothesis is the opposite of the null hypothesis (SBP of participants 120 (H 1 : 120). It may or may not be accepted and it is the hypothesis that is believed to be true by the researcher
46 Level of Significance, a Defines unlikely values of sample statistic if null hypothesis is true. Called rejection region of sampling distribution Typical values are 0.01, 0.05 Selected by the Researcher at the Start Provides the Critical Value(s) of the Test
47 Level of Significance, a and the Rejection Region a Critical Value(s) Rejection Regions 0
48 Result Possibilities H 0 : Innocent Jury Trial Actual Situation Hypothesis Test Actual Situation Verdict Innocent Guilty Decision H 0 True H 0 False Innocent Correct Error Accept H Type II Error ( b ) Guilty Error Correct Reject H 0 Type I Error ( ) Power (1 - b ) False Positive False Negative
49 β Factors Increasing Type II Error True Value of Population Parameter Increases When Difference Between Hypothesized Parameter & True Value Decreases Significance Level Increases When Decreases Population Standard Deviation Increases When Increases Sample Size n Increases When n Decreases b b b b d n
50 p Value Test Probability of Obtaining a Test Statistic More Extreme or ) than Actual Sample Value Given H 0 Is True Called Observed Level of Significance Used to Make Rejection Decision If p value Do Not Reject H 0 If p value <, Reject H 0
51 Hypothesis Testing: Steps Test the Assumption that the true mean SBP of participants is 120 mmhg. State H 0 H 0 : m = 120 State H 1 H 1 : m 120 Choose = 0.05 Choose n n = 100 Choose Test: Z, t, X 2 Test (or p Value)
52 Hypothesis Testing: Steps Compute Test Statistic (or compute P value) Search for Critical Value Make Statistical Decision rule Express Decision
53 One sample-mean Test Assumptions Population is normally distributed t test statistic sample mean null value standard error x s n 0 t
54 Example Normal Body Temperature What is normal body temperature? Is it actually 37.6 o C (on average)? State the null and alternative hypotheses H 0 : = 37.6 o C H a : 37.6 o C
55 Example Normal Body Temp (cont) Data: random sample of n = 18 normal body temps Summarize data with a test statistic Variable n Mean SD SE t P Temperature samplemean nullvalue standarderror x s n 0 t
56 STUDENT S t DISTRIBUTION TABLE Degrees of freedom Probability (p value)
57 Example Normal Body Temp (cont) Find the p-value Df = n 1 = 18 1 = 17 From SPSS: p-value = From t Table: p-value is between 0.05 and t Area to left of t = equals area to right of t = The value t = 2.38 is between column headings 2.110& in table, and for df =17, the p- values are 0.05 and 0.01.
58 Example Normal Body Temp (cont) Decide whether or not the result is statistically significant based on the p- value Using a = 0.05 as the level of significance criterion, the results are statistically significant because is less than In other words, we can reject the null hypothesis. Report the Conclusion We can conclude, based on these data, that the mean temperature in the human population does not equal 37.6.
59 One-sample test for proportion Involves categorical variables Fraction or % of population in a category Sample proportion (p) Test is called Z test where: Z is computed value π is proportion in population (null hypothesis value) p X n Z number of successes sample size p ( 1 ) n Critical Values: 1.96 at α= at α=0.01
60 Example In a survey of diabetics in a large city, it was found that 100 out of 400 have diabetic foot. Can we conclude that 20 percent of diabetics in the sampled population have diabetic foot. Test at the =0.05 significance level.
61 Solution H o : π = 0.20 H 1 : π 0.20 Z = (1-0.20) 400 = 2.50 Critical Value: 1.96 Decision: Reject Reject Z We have sufficient evidence to reject the Ho value of 20% We conclude that in the population of diabetic the proportion who have diabetic foot does not equal 0.20
62
63
64
65
66
67
68
69
70
71
72
73
74
75
76
77
78
79
80
81
82


83

84
85


86

87


88

89

90
91
92

93

94

95


96
97 Example 3. It is known that 1% of population suffers from a particular disease. A blood test has a 97% chance to identify the disease for a diseased individual, by also has a 6% chance of falsely indicating that a healthy person has a disease. a. What is the probability that a random person has a positive blood test. b. If a blood test is positive, what s the probability that the person has the disease? c. If a blood test is negative, what s the probability that the person does not have the disease?
98 A is the event that a person has a disease. P(A) = 0.01; P(A ) = B is the event that the test result is positive. P(B A) = 0.97; P(B A) = 0.03; P(B A ) = 0.06; P(B A ) = 0.94; (a) P(B) = P(A) P(B A) + P(A )P(B A ) = 0.01* * 0.06 = (b) P(A B)=P(B A)*P(A)/P(B) = 0.97* 0.01/ = (c) P(A B ) = P(B A )P(A )/P(B )= P(B A )P(A )/(1- P(B))= 0.94*0.99/( )=0.9997

99
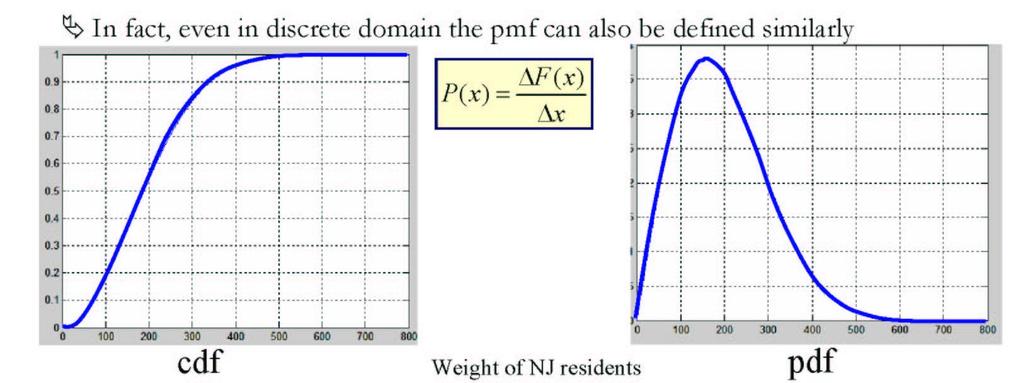
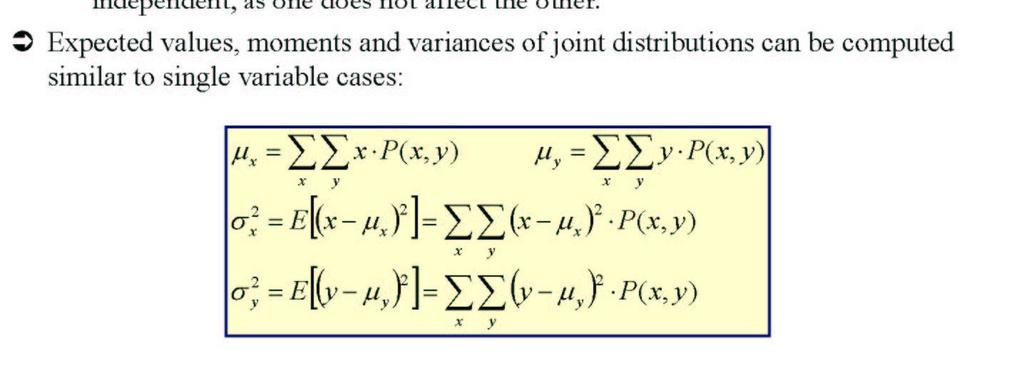
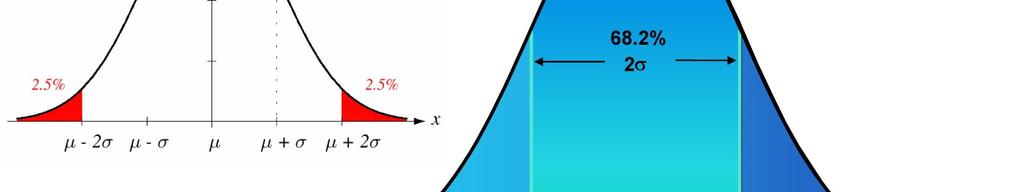
100 Normal Distributions Gaussian distribution Mean p ( x ) 2 / 2 2 ( x) N(, ) e x x x E( x) x x 1 2 x Variance E[( x ) 2 ] x x 2 Central Limit Theorem says sums of random variables tend toward a Normal distribution. Mahalanobis Distance: r x x x


101
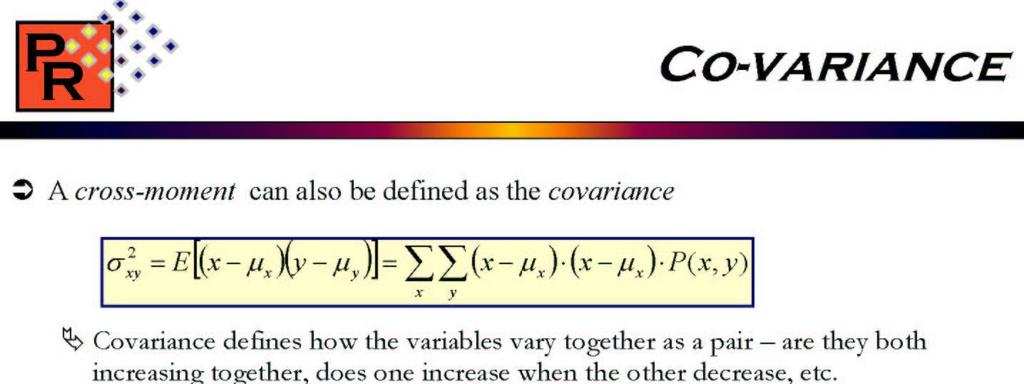
102 Multivariate Normal Density x is a vector of d Gaussian variables Mahalanobis Distance All conditionals and marginals are also Gaussian dx x p x x x x E dx x xp x E x T x e d N x p T T ) ( ) )( ( ] ) )( [( ) ( ] [ ) ( 1 ) ( / 2 / 2 1 ), ( ) ( ) ( ) ( 1 2 x x r T
103
104 Bayesian Decision Making Classification problem in probabilistic terms Create models for how features are distributed for objects of different classes We will use probability calculus to make classification decisions 104
105 Lets Look at Just One Feature Each object can be associated with multiple features We will look at the case of just one feature for now Y RBC X We are going to define two key concepts. 105
106 The First Key Concept Features for each class drawn from class-conditional probability distributions (CCPD) P(X Class1) P(X Class2) X Our first goal will be to model these distributions 106
107 The Second Key Concept We model prior probabilities to quantify the expected a priori chance of seeing a class P(Class2) & P(Class1) 107
108 But How Do We Classify? So we have priors defining the a priori probability of a class P(Class1), P(Class2) We also have models for the probability of a feature given each class P(X Class1), P(X Class2) But we want the probability of the class given a feature How do we get P(Class1 X)? 108
 An essay towards solving a problem in the doctrine of chances.")
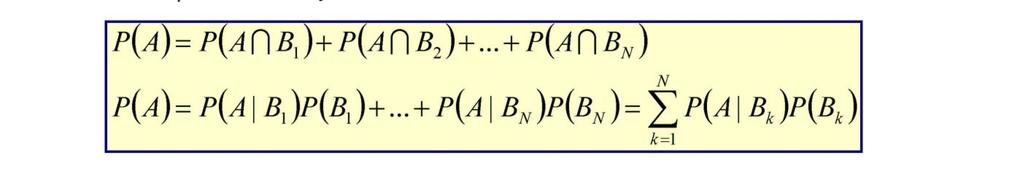
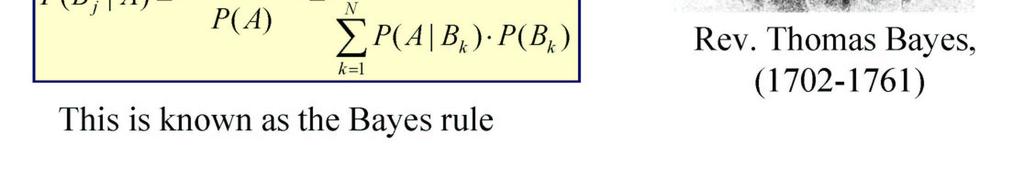
109 Bayes Rule Belief before evidence Evaluate evidence Likelihood Prior P( Class Feature) P( Feature Class) P( Class) P( Feature) Belief after evidence Posterior Evidence Bayes, Thomas (1763) An essay towards solving a problem in the doctrine of chances. Philosophical Transactions of the Royal Society of London, 53:
110 Bayes Decision Rule If we observe an object with feature X, how do decide if the object is from Class 1? The Bayes Decision Rule is simply choose Class1 if: P( Class1 X ) P( Class2 X ) P( X Class1) P( L1) P( X Class2) P( L2) P( X ) P( X ) P( X This Class is the 1) same P( Class number 1) on Pboth ( X sides! Class2) P( Class2) Copyright@SMST 110
111 Discriminant Function We can create a convenient representation of the Bayes Decision Rule P( X Class1) P( Class1) P( X Class2) P( Class2) P( X Class1) P( Class1) P( X Class2) P( Class2) 1 P( X Class1) P( Class1) G( X ) log 0 P( X Class2) P( Class2) If G(X) > 0, we classify as Class 1 111
112 Stepping back What do we have so far? We have defined the two components, class-conditional distributions and priors P(X Class1), P(X Class2) P(Class1), P(Class2) We have used Bayes Rule to create a discriminant function for classification from these components P( X Class1) P( Class1) G( X ) log 0 P( X Class2) P( Class2) Given a new feature, X, we plug it into this equation and if G(X)> 0 we classify as Class1 112
113 Getting P(X Class) from Training Set P(X Class1) One Simple Approach There are 13 data points Divide X values into bins And then we simply count frequencies X 7/13 0 2/13 3/13 1/13 < >7 113
 Variance : x E[( x ) 2 ] x x 2 Mahalanobis Distance : r x x x")
114 Class conditional from Univariate Normal Distribution p ( x ) 2 / 2 2 ( x) N(, ) e x x x x 1 2 x Mean : E( x) Variance : x E[( x ) 2 ] x x 2 Mahalanobis Distance : r x x x 114
115 We Are Just About There. We have created the class-conditional distributions and priors P(X Class1), P(X Class2) P(Class1), P(Class2) And we are ready to plug these into our discriminant function P( X Class1) P( Class1) G( X ) log 0 P( X Class2) P( Class2) But there is one more little complication.. 115
 become P(X1,X2,X3,,X8 Class) and")
 P( Class1) P( X, X,.")
116 Multidimensional feature space? G X So P(X Class) become P(X1,X2,X3,,X8 Class) and our discriminant function becomes P( X, X,..., X Class1) P( Class1) P( X, X,..., X Class2) P( Class2) ( ) log
117 Naïve Bayes Classifier We are going to make the following assumption: All features are independent given the class P( X, X,..., X Class) P( X Class) P( X Class)... P( X Class) 1 2 n 1 2 n P( X i Class) i 1 n We can thus estimate individual distributions for each feature and just multiply them together! 117
118 Naïve Bayes Discriminant Function Thus, with the Naïve Bayes assumption, we can now rewrite, this: G X P( X, X,..., X Class1) P( Class1) ( 1,..., X 7) log 0 P( X1, X 2,..., X 7 Class2) P( Class2) As this: P( X i Class1) P( Class1) G( X1,..., X 7) log 0 P( X Class2) P( Class2) i 118
119 Classifying Parasitic RBC Intensity Hu s moments Fractal dimension Entropy Homogeneity Correlation Chromatin dots X i P(X i Malaria) P(X i ~Malaria) Plug these and priors into the discriminant function P( X i Mito) P( Mito) G( X1,..., X 7 ) log 0 P( X ~ Mito) P(~ Mito) IF G>0, we predict that the parasite is from class Malaria i 119
120 How Good is the Classifier? The Rule We must test our classifier on a different set from the training set: the labeled test set The Task We will classify each object in the test set and count the number of each type of error 120
121 Binary Classification Errors True (Mito) False (~Mito) Predicted True TP FP Predicted False FN TN Sensitivity = TP/(TP+FN) Specificity = TN/(TN+FP) Sensitivity Fraction of all Class1 (True) that we correctly predicted at Class 1 How good are we at finding what we are looking for Specificity Fraction of all Class 2 (False) called Class 2 How many of the Class 2 do we filter out of our Class 1 predictions In both cases, the higher the better 121
122 Thank you
AP Statistics Cumulative AP Exam Study Guide
 AP Statistics Cumulative AP Eam Study Guide Chapters & 3 - Graphs Statistics the science of collecting, analyzing, and drawing conclusions from data. Descriptive methods of organizing and summarizing statistics
What is Statistics? Statistics is the science of understanding data and of making decisions in the face of variability and uncertainty.
 What is Statistics? Statistics is the science of understanding data and of making decisions in the face of variability and uncertainty. Statistics is a field of study concerned with the data collection,
Descriptive Univariate Statistics and Bivariate Correlation
 ESC 100 Exploring Engineering Descriptive Univariate Statistics and Bivariate Correlation Instructor: Sudhir Khetan, Ph.D. Wednesday/Friday, October 17/19, 2012 The Central Dogma of Statistics used to
Probabilistic classification CE-717: Machine Learning Sharif University of Technology. M. Soleymani Fall 2016
 Probabilistic classification CE-717: Machine Learning Sharif University of Technology M. Soleymani Fall 2016 Topics Probabilistic approach Bayes decision theory Generative models Gaussian Bayes classifier
Review of Statistics 101
 Review of Statistics 101 We review some important themes from the course 1. Introduction Statistics- Set of methods for collecting/analyzing data (the art and science of learning from data). Provides methods
Probability and Statistics. Joyeeta Dutta-Moscato June 29, 2015
 Probability and Statistics Joyeeta Dutta-Moscato June 29, 2015 Terms and concepts Sample vs population Central tendency: Mean, median, mode Variance, standard deviation Normal distribution Cumulative distribution
Glossary. The ISI glossary of statistical terms provides definitions in a number of different languages:
 Glossary The ISI glossary of statistical terms provides definitions in a number of different languages: http://isi.cbs.nl/glossary/index.htm Adjusted r 2 Adjusted R squared measures the proportion of the
Units. Exploratory Data Analysis. Variables. Student Data
 Units Exploratory Data Analysis Bret Larget Departments of Botany and of Statistics University of Wisconsin Madison Statistics 371 13th September 2005 A unit is an object that can be measured, such as
Business Statistics. Lecture 10: Course Review
 Business Statistics Lecture 10: Course Review 1 Descriptive Statistics for Continuous Data Numerical Summaries Location: mean, median Spread or variability: variance, standard deviation, range, percentiles,
Prentice Hall Stats: Modeling the World 2004 (Bock) Correlated to: National Advanced Placement (AP) Statistics Course Outline (Grades 9-12)
 Correlated to: National Advanced Placement (AP) Statistics Course Outline (Grades 9-12)") National Advanced Placement (AP) Statistics Course Outline (Grades 9-12) Following is an outline of the major topics covered by the AP Statistics Examination. The ordering here is intended to define the
National Advanced Placement (AP) Statistics Course Outline (Grades 9-12) Following is an outline of the major topics covered by the AP Statistics Examination. The ordering here is intended to define the
Statistics in medicine
 Statistics in medicine Lecture 1- part 1: Describing variation, and graphical presentation Outline Sources of variation Types of variables Fatma Shebl, MD, MS, MPH, PhD Assistant Professor Chronic Disease
MATH4427 Notebook 4 Fall Semester 2017/2018
 MATH4427 Notebook 4 Fall Semester 2017/2018 prepared by Professor Jenny Baglivo c Copyright 2009-2018 by Jenny A. Baglivo. All Rights Reserved. 4 MATH4427 Notebook 4 3 4.1 K th Order Statistics and Their
STAT 200 Chapter 1 Looking at Data - Distributions
 STAT 200 Chapter 1 Looking at Data - Distributions What is Statistics? Statistics is a science that involves the design of studies, data collection, summarizing and analyzing the data, interpreting the
First we look at some terms to be used in this section.
 8 Hypothesis Testing 8.1 Introduction MATH1015 Biostatistics Week 8 In Chapter 7, we ve studied the estimation of parameters, point or interval estimates. The construction of CI relies on the sampling
Discrete Multivariate Statistics
 Discrete Multivariate Statistics Univariate Discrete Random variables Let X be a discrete random variable which, in this module, will be assumed to take a finite number of t different values which are
Dover- Sherborn High School Mathematics Curriculum Probability and Statistics
 Mathematics Curriculum A. DESCRIPTION This is a full year courses designed to introduce students to the basic elements of statistics and probability. Emphasis is placed on understanding terminology and
Probability and Statistics. Terms and concepts
 Probability and Statistics Joyeeta Dutta Moscato June 30, 2014 Terms and concepts Sample vs population Central tendency: Mean, median, mode Variance, standard deviation Normal distribution Cumulative distribution
Generative classifiers: The Gaussian classifier. Ata Kaban School of Computer Science University of Birmingham
 Generative classifiers: The Gaussian classifier Ata Kaban School of Computer Science University of Birmingham Outline We have already seen how Bayes rule can be turned into a classifier In all our examples
ISyE 6416: Computational Statistics Spring Lecture 5: Discriminant analysis and classification
 ISyE 6416: Computational Statistics Spring 2017 Lecture 5: Discriminant analysis and classification Prof. Yao Xie H. Milton Stewart School of Industrial and Systems Engineering Georgia Institute of Technology
BNG 495 Capstone Design. Descriptive Statistics
 BNG 495 Capstone Design Descriptive Statistics Overview The overall goal of this short course in statistics is to provide an introduction to descriptive and inferential statistical methods, with a focus
Sociology 6Z03 Review II
 Sociology 6Z03 Review II John Fox McMaster University Fall 2016 John Fox (McMaster University) Sociology 6Z03 Review II Fall 2016 1 / 35 Outline: Review II Probability Part I Sampling Distributions Probability
Biostatistics for biomedical profession. BIMM34 Karin Källen & Linda Hartman November-December 2015
 Biostatistics for biomedical profession BIMM34 Karin Källen & Linda Hartman November-December 2015 12015-11-02 Who needs a course in biostatistics? - Anyone who uses quntitative methods to interpret biological
Machine Learning Linear Classification. Prof. Matteo Matteucci
 Machine Learning Linear Classification Prof. Matteo Matteucci Recall from the first lecture 2 X R p Regression Y R Continuous Output X R p Y {Ω 0, Ω 1,, Ω K } Classification Discrete Output X R p Y (X)
Statistics I Chapter 2: Univariate data analysis
 Statistics I Chapter 2: Univariate data analysis Chapter 2: Univariate data analysis Contents Graphical displays for categorical data (barchart, piechart) Graphical displays for numerical data data (histogram,
BIOL 51A - Biostatistics 1 1. Lecture 1: Intro to Biostatistics. Smoking: hazardous? FEV (l) Smoke
 Smoke") BIOL 51A - Biostatistics 1 1 Lecture 1: Intro to Biostatistics Smoking: hazardous? FEV (l) 1 2 3 4 5 No Yes Smoke BIOL 51A - Biostatistics 1 2 Box Plot a.k.a box-and-whisker diagram or candlestick chart
BIOL 51A - Biostatistics 1 1 Lecture 1: Intro to Biostatistics Smoking: hazardous? FEV (l) 1 2 3 4 5 No Yes Smoke BIOL 51A - Biostatistics 1 2 Box Plot a.k.a box-and-whisker diagram or candlestick chart
Nicole Dalzell. July 2, 2014
 UNIT 1: INTRODUCTION TO DATA LECTURE 3: EDA (CONT.) AND INTRODUCTION TO STATISTICAL INFERENCE VIA SIMULATION STATISTICS 101 Nicole Dalzell July 2, 2014 Teams and Announcements Team1 = Houdan Sai Cui Huanqi
Answer keys for Assignment 10: Measurement of study variables (The correct answer is underlined in bold text)
") Answer keys for Assignment 10: Measurement of study variables (The correct answer is underlined in bold text) 1. A quick and easy indicator of dispersion is a. Arithmetic mean b. Variance c. Standard deviation
Answer keys for Assignment 10: Measurement of study variables (The correct answer is underlined in bold text) 1. A quick and easy indicator of dispersion is a. Arithmetic mean b. Variance c. Standard deviation
Tastitsticsss? What s that? Principles of Biostatistics and Informatics. Variables, outcomes. Tastitsticsss? What s that?
 Tastitsticsss? What s that? Statistics describes random mass phanomenons. Principles of Biostatistics and Informatics nd Lecture: Descriptive Statistics 3 th September Dániel VERES Data Collecting (Sampling)
SUPERVISED LEARNING: INTRODUCTION TO CLASSIFICATION
 SUPERVISED LEARNING: INTRODUCTION TO CLASSIFICATION 1 Outline Basic terminology Features Training and validation Model selection Error and loss measures Statistical comparison Evaluation measures 2 Terminology
Statistics I Chapter 2: Univariate data analysis
 Statistics I Chapter 2: Univariate data analysis Chapter 2: Univariate data analysis Contents Graphical displays for categorical data (barchart, piechart) Graphical displays for numerical data data (histogram,
Describing distributions with numbers
 Describing distributions with numbers A large number or numerical methods are available for describing quantitative data sets. Most of these methods measure one of two data characteristics: The central
Interpret Standard Deviation. Outlier Rule. Describe the Distribution OR Compare the Distributions. Linear Transformations SOCS. Interpret a z score
 Interpret Standard Deviation Outlier Rule Linear Transformations Describe the Distribution OR Compare the Distributions SOCS Using Normalcdf and Invnorm (Calculator Tips) Interpret a z score What is an
MARGINAL HOMOGENEITY MODEL FOR ORDERED CATEGORIES WITH OPEN ENDS IN SQUARE CONTINGENCY TABLES
 REVSTAT Statistical Journal Volume 13, Number 3, November 2015, 233 243 MARGINAL HOMOGENEITY MODEL FOR ORDERED CATEGORIES WITH OPEN ENDS IN SQUARE CONTINGENCY TABLES Authors: Serpil Aktas Department of
P8130: Biostatistical Methods I
 P8130: Biostatistical Methods I Lecture 2: Descriptive Statistics Cody Chiuzan, PhD Department of Biostatistics Mailman School of Public Health (MSPH) Lecture 1: Recap Intro to Biostatistics Types of Data
Computational Genomics
 Computational Genomics http://www.cs.cmu.edu/~02710 Introduction to probability, statistics and algorithms (brief) intro to probability Basic notations Random variable - referring to an element / event
Descriptive Data Summarization
 Descriptive Data Summarization Descriptive data summarization gives the general characteristics of the data and identify the presence of noise or outliers, which is useful for successful data cleaning
Clinical Research Module: Biostatistics
 Clinical Research Module: Biostatistics Lecture 1 Alberto Nettel-Aguirre, PhD, PStat These lecture notes based on others developed by Drs. Peter Faris, Sarah Rose Luz Palacios-Derflingher and myself Who
Probability and Probability Distributions. Dr. Mohammed Alahmed
 Probability and Probability Distributions 1 Probability and Probability Distributions Usually we want to do more with data than just describing them! We might want to test certain specific inferences about
Bayesian Decision Theory
 Introduction to Pattern Recognition [ Part 4 ] Mahdi Vasighi Remarks It is quite common to assume that the data in each class are adequately described by a Gaussian distribution. Bayesian classifier is
REVIEW: Midterm Exam. Spring 2012
 REVIEW: Midterm Exam Spring 2012 Introduction Important Definitions: - Data - Statistics - A Population - A census - A sample Types of Data Parameter (Describing a characteristic of the Population) Statistic
Bayesian Learning (II)
") Universität Potsdam Institut für Informatik Lehrstuhl Maschinelles Lernen Bayesian Learning (II) Niels Landwehr Overview Probabilities, expected values, variance Basic concepts of Bayesian learning MAP
Universität Potsdam Institut für Informatik Lehrstuhl Maschinelles Lernen Bayesian Learning (II) Niels Landwehr Overview Probabilities, expected values, variance Basic concepts of Bayesian learning MAP
Glossary for the Triola Statistics Series
 Glossary for the Triola Statistics Series Absolute deviation The measure of variation equal to the sum of the deviations of each value from the mean, divided by the number of values Acceptance sampling
Statistical Modeling and Analysis of Scientific Inquiry: The Basics of Hypothesis Testing
 Statistical Modeling and Analysis of Scientific Inquiry: The Basics of Hypothesis Testing So, What is Statistics? Theory and techniques for learning from data How to collect How to analyze How to interpret
AIM HIGH SCHOOL. Curriculum Map W. 12 Mile Road Farmington Hills, MI (248)
") AIM HIGH SCHOOL Curriculum Map 2923 W. 12 Mile Road Farmington Hills, MI 48334 (248) 702-6922 www.aimhighschool.com COURSE TITLE: Statistics DESCRIPTION OF COURSE: PREREQUISITES: Algebra 2 Students will
AIM HIGH SCHOOL Curriculum Map 2923 W. 12 Mile Road Farmington Hills, MI 48334 (248) 702-6922 www.aimhighschool.com COURSE TITLE: Statistics DESCRIPTION OF COURSE: PREREQUISITES: Algebra 2 Students will
Sampling Distributions
 Sampling Distributions Sampling Distribution of the Mean & Hypothesis Testing Remember sampling? Sampling Part 1 of definition Selecting a subset of the population to create a sample Generally random sampling
20 Hypothesis Testing, Part I
 20 Hypothesis Testing, Part I Bob has told Alice that the average hourly rate for a lawyer in Virginia is $200 with a standard deviation of $50, but Alice wants to test this claim. If Bob is right, she
1-1. Chapter 1. Sampling and Descriptive Statistics by The McGraw-Hill Companies, Inc. All rights reserved.
 1-1 Chapter 1 Sampling and Descriptive Statistics 1-2 Why Statistics? Deal with uncertainty in repeated scientific measurements Draw conclusions from data Design valid experiments and draw reliable conclusions
Chapter 2 Class Notes Sample & Population Descriptions Classifying variables
 Chapter 2 Class Notes Sample & Population Descriptions Classifying variables Random Variables (RVs) are discrete quantitative continuous nominal qualitative ordinal Notation and Definitions: a Sample is
Descriptive Statistics-I. Dr Mahmoud Alhussami
 Descriptive Statistics-I Dr Mahmoud Alhussami Biostatistics What is the biostatistics? A branch of applied math. that deals with collecting, organizing and interpreting data using well-defined procedures.
Elementary Statistics
 Elementary Statistics Q: What is data? Q: What does the data look like? Q: What conclusions can we draw from the data? Q: Where is the middle of the data? Q: Why is the spread of the data important? Q:
Further Mathematics 2018 CORE: Data analysis Chapter 2 Summarising numerical data
 Chapter 2: Summarising numerical data Further Mathematics 2018 CORE: Data analysis Chapter 2 Summarising numerical data Extract from Study Design Key knowledge Types of data: categorical (nominal and ordinal)
Subject CS1 Actuarial Statistics 1 Core Principles
 Institute of Actuaries of India Subject CS1 Actuarial Statistics 1 Core Principles For 2019 Examinations Aim The aim of the Actuarial Statistics 1 subject is to provide a grounding in mathematical and
ECE521 week 3: 23/26 January 2017
 ECE521 week 3: 23/26 January 2017 Outline Probabilistic interpretation of linear regression - Maximum likelihood estimation (MLE) - Maximum a posteriori (MAP) estimation Bias-variance trade-off Linear
Chapter2 Description of samples and populations. 2.1 Introduction.
 Chapter2 Description of samples and populations. 2.1 Introduction. Statistics=science of analyzing data. Information collected (data) is gathered in terms of variables (characteristics of a subject that
Medical statistics part I, autumn 2010: One sample test of hypothesis
 Medical statistics part I, autumn 2010: One sample test of hypothesis Eirik Skogvoll Consultant/ Professor Faculty of Medicine Dept. of Anaesthesiology and Emergency Medicine 1 What is a hypothesis test?
Ch. 1: Data and Distributions
 Ch. 1: Data and Distributions Populations vs. Samples How to graphically display data Histograms, dot plots, stem plots, etc Helps to show how samples are distributed Distributions of both continuous and
Chapter 2: Tools for Exploring Univariate Data
 Stats 11 (Fall 2004) Lecture Note Introduction to Statistical Methods for Business and Economics Instructor: Hongquan Xu Chapter 2: Tools for Exploring Univariate Data Section 2.1: Introduction What is
Part I. Linear Discriminant Analysis. Discriminant analysis. Discriminant analysis
 Week 5 Based in part on slides from textbook, slides of Susan Holmes Part I Linear Discriminant Analysis October 29, 2012 1 / 1 2 / 1 Nearest centroid rule Suppose we break down our data matrix as by the
Naïve Bayes classification
 Naïve Bayes classification 1 Probability theory Random variable: a variable whose possible values are numerical outcomes of a random phenomenon. Examples: A person s height, the outcome of a coin toss
Introduction: MLE, MAP, Bayesian reasoning (28/8/13)
") STA561: Probabilistic machine learning Introduction: MLE, MAP, Bayesian reasoning (28/8/13) Lecturer: Barbara Engelhardt Scribes: K. Ulrich, J. Subramanian, N. Raval, J. O Hollaren 1 Classifiers In this
STA561: Probabilistic machine learning Introduction: MLE, MAP, Bayesian reasoning (28/8/13) Lecturer: Barbara Engelhardt Scribes: K. Ulrich, J. Subramanian, N. Raval, J. O Hollaren 1 Classifiers In this
1. Exploratory Data Analysis
 1. Exploratory Data Analysis 1.1 Methods of Displaying Data A visual display aids understanding and can highlight features which may be worth exploring more formally. Displays should have impact and be
Describing distributions with numbers
 Describing distributions with numbers A large number or numerical methods are available for describing quantitative data sets. Most of these methods measure one of two data characteristics: The central
Harvard University. Rigorous Research in Engineering Education
 Statistical Inference Kari Lock Harvard University Department of Statistics Rigorous Research in Engineering Education 12/3/09 Statistical Inference You have a sample and want to use the data collected
Nemours Biomedical Research Statistics Course. Li Xie Nemours Biostatistics Core October 14, 2014
 Nemours Biomedical Research Statistics Course Li Xie Nemours Biostatistics Core October 14, 2014 Outline Recap Introduction to Logistic Regression Recap Descriptive statistics Variable type Example of
STATISTICS 141 Final Review
 STATISTICS 141 Final Review Bin Zou bzou@ualberta.ca Department of Mathematical & Statistical Sciences University of Alberta Winter 2015 Bin Zou (bzou@ualberta.ca) STAT 141 Final Review Winter 2015 1 /
Module 1. Identify parts of an expression using vocabulary such as term, equation, inequality
 Common Core Standards Major Topic Key Skills Chapters Key Vocabulary Essential Questions Module 1 Pre- Requisites Skills: Students need to know how to add, subtract, multiply and divide. Students need
Review for Final. Chapter 1 Type of studies: anecdotal, observational, experimental Random sampling
 Review for Final For a detailed review of Chapters 1 7, please see the review sheets for exam 1 and. The following only briefly covers these sections. The final exam could contain problems that are included
SF2935: MODERN METHODS OF STATISTICAL LECTURE 3 SUPERVISED CLASSIFICATION, LINEAR DISCRIMINANT ANALYSIS LEARNING. Tatjana Pavlenko.
 SF2935: MODERN METHODS OF STATISTICAL LEARNING LECTURE 3 SUPERVISED CLASSIFICATION, LINEAR DISCRIMINANT ANALYSIS Tatjana Pavlenko 5 November 2015 SUPERVISED LEARNING (REP.) Starting point: we have an outcome
Performance Evaluation and Comparison
 Outline Hong Chang Institute of Computing Technology, Chinese Academy of Sciences Machine Learning Methods (Fall 2012) Outline Outline I 1 Introduction 2 Cross Validation and Resampling 3 Interval Estimation
LECTURE 5. Introduction to Econometrics. Hypothesis testing
 LECTURE 5 Introduction to Econometrics Hypothesis testing October 18, 2016 1 / 26 ON TODAY S LECTURE We are going to discuss how hypotheses about coefficients can be tested in regression models We will
Introduction to Statistics with GraphPad Prism 7
 Introduction to Statistics with GraphPad Prism 7 Outline of the course Power analysis with G*Power Basic structure of a GraphPad Prism project Analysis of qualitative data Chi-square test Analysis of quantitative
MATH 1150 Chapter 2 Notation and Terminology
 MATH 1150 Chapter 2 Notation and Terminology Categorical Data The following is a dataset for 30 randomly selected adults in the U.S., showing the values of two categorical variables: whether or not the
Descriptive statistics
 Patrick Breheny February 6 Patrick Breheny to Biostatistics (171:161) 1/25 Tables and figures Human beings are not good at sifting through large streams of data; we understand data much better when it
Classification CE-717: Machine Learning Sharif University of Technology. M. Soleymani Fall 2012
 Classification CE-717: Machine Learning Sharif University of Technology M. Soleymani Fall 2012 Topics Discriminant functions Logistic regression Perceptron Generative models Generative vs. discriminative
Rigorous Evaluation R.I.T. Analysis and Reporting. Structure is from A Practical Guide to Usability Testing by J. Dumas, J. Redish
 Rigorous Evaluation Analysis and Reporting Structure is from A Practical Guide to Usability Testing by J. Dumas, J. Redish S. Ludi/R. Kuehl p. 1 Summarize and Analyze Test Data Qualitative data - comments,
Inference for Distributions Inference for the Mean of a Population
 Inference for Distributions Inference for the Mean of a Population PBS Chapter 7.1 009 W.H Freeman and Company Objectives (PBS Chapter 7.1) Inference for the mean of a population The t distributions The
T.I.H.E. IT 233 Statistics and Probability: Sem. 1: 2013 ESTIMATION AND HYPOTHESIS TESTING OF TWO POPULATIONS
 ESTIMATION AND HYPOTHESIS TESTING OF TWO POPULATIONS In our work on hypothesis testing, we used the value of a sample statistic to challenge an accepted value of a population parameter. We focused only
CHAPTER 2 Description of Samples and Populations
 Chapter 2 27 CHAPTER 2 Description of Samples and Populations 2.1.1 (a) i) Molar width ii) Continuous variable iii) A molar iv) 36 (b) i) Birthweight, date of birth, and race ii) Birthweight is continuous,
EEL 851: Biometrics. An Overview of Statistical Pattern Recognition EEL 851 1
 EEL 851: Biometrics An Overview of Statistical Pattern Recognition EEL 851 1 Outline Introduction Pattern Feature Noise Example Problem Analysis Segmentation Feature Extraction Classification Design Cycle
AP Final Review II Exploring Data (20% 30%)
") AP Final Review II Exploring Data (20% 30%) Quantitative vs Categorical Variables Quantitative variables are numerical values for which arithmetic operations such as means make sense. It is usually a measure
AP Final Review II Exploring Data (20% 30%) Quantitative vs Categorical Variables Quantitative variables are numerical values for which arithmetic operations such as means make sense. It is usually a measure
What is statistics? Statistics is the science of: Collecting information. Organizing and summarizing the information collected
 What is statistics? Statistics is the science of: Collecting information Organizing and summarizing the information collected Analyzing the information collected in order to draw conclusions Two types
AMS7: WEEK 7. CLASS 1. More on Hypothesis Testing Monday May 11th, 2015
 AMS7: WEEK 7. CLASS 1 More on Hypothesis Testing Monday May 11th, 2015 Testing a Claim about a Standard Deviation or a Variance We want to test claims about or 2 Example: Newborn babies from mothers taking
Statistics. Nicodème Paul Faculté de médecine, Université de Strasbourg. 9/5/2018 Statistics
 Statistics Nicodème Paul Faculté de médecine, Université de Strasbourg file:///users/home/npaul/enseignement/esbs/2018-2019/cours/01/index.html#21 1/62 Course logistics Statistics Course website: http://statnipa.appspot.com/
BIOS 2041: Introduction to Statistical Methods
 BIOS 2041: Introduction to Statistical Methods Abdus S Wahed* *Some of the materials in this chapter has been adapted from Dr. John Wilson s lecture notes for the same course. Chapter 0 2 Chapter 1 Introduction
An introduction to biostatistics: part 1
 An introduction to biostatistics: part 1 Cavan Reilly September 6, 2017 Table of contents Introduction to data analysis Uncertainty Probability Conditional probability Random variables Discrete random
LECTURE NOTE #3 PROF. ALAN YUILLE
 LECTURE NOTE #3 PROF. ALAN YUILLE 1. Three Topics (1) Precision and Recall Curves. Receiver Operating Characteristic Curves (ROC). What to do if we do not fix the loss function? (2) The Curse of Dimensionality.
Salt Lake Community College MATH 1040 Final Exam Fall Semester 2011 Form E
 Salt Lake Community College MATH 1040 Final Exam Fall Semester 011 Form E Name Instructor Time Limit: 10 minutes Any hand-held calculator may be used. Computers, cell phones, or other communication devices
Statistical Methods for Particle Physics Lecture 1: parameter estimation, statistical tests
 Statistical Methods for Particle Physics Lecture 1: parameter estimation, statistical tests http://benasque.org/2018tae/cgi-bin/talks/allprint.pl TAE 2018 Benasque, Spain 3-15 Sept 2018 Glen Cowan Physics
Lecture 1: Descriptive Statistics
 Lecture 1: Descriptive Statistics MSU-STT-351-Sum 15 (P. Vellaisamy: MSU-STT-351-Sum 15) Probability & Statistics for Engineers 1 / 56 Contents 1 Introduction 2 Branches of Statistics Descriptive Statistics
y ˆ i = ˆ " T u i ( i th fitted value or i th fit)
") 1 2 INFERENCE FOR MULTIPLE LINEAR REGRESSION Recall Terminology: p predictors x 1, x 2,, x p Some might be indicator variables for categorical variables) k-1 non-constant terms u 1, u 2,, u k-1 Each u
1 2 INFERENCE FOR MULTIPLE LINEAR REGRESSION Recall Terminology: p predictors x 1, x 2,, x p Some might be indicator variables for categorical variables) k-1 non-constant terms u 1, u 2,, u k-1 Each u
Diagnostics. Gad Kimmel
 Diagnostics Gad Kimmel Outline Introduction. Bootstrap method. Cross validation. ROC plot. Introduction Motivation Estimating properties of an estimator. Given data samples say the average. x 1, x 2,...,
HYPOTHESIS TESTING. Hypothesis Testing
 MBA 605 Business Analytics Don Conant, PhD. HYPOTHESIS TESTING Hypothesis testing involves making inferences about the nature of the population on the basis of observations of a sample drawn from the population.
Bayesian Models in Machine Learning
 Bayesian Models in Machine Learning Lukáš Burget Escuela de Ciencias Informáticas 2017 Buenos Aires, July 24-29 2017 Frequentist vs. Bayesian Frequentist point of view: Probability is the frequency of
11: Comparing Group Variances. Review of Variance
 11: Comparing Group Variances Review of Variance Parametric measures of variability are often based on sum of squares (SS) around e mean: (1) For e data set {3, 4, 5, 8}, = 5 and SS = (3 5) + (4 5) + (5
Math Review Sheet, Fall 2008
 1 Descriptive Statistics Math 3070-5 Review Sheet, Fall 2008 First we need to know about the relationship among Population Samples Objects The distribution of the population can be given in one of the
Statistical Data Analysis Stat 3: p-values, parameter estimation
 Statistical Data Analysis Stat 3: p-values, parameter estimation London Postgraduate Lectures on Particle Physics; University of London MSci course PH4515 Glen Cowan Physics Department Royal Holloway,
Naïve Bayes classification. p ij 11/15/16. Probability theory. Probability theory. Probability theory. X P (X = x i )=1 i. Marginal Probability
=1 i. Marginal Probability") Probability theory Naïve Bayes classification Random variable: a variable whose possible values are numerical outcomes of a random phenomenon. s: A person s height, the outcome of a coin toss Distinguish
Probability theory Naïve Bayes classification Random variable: a variable whose possible values are numerical outcomes of a random phenomenon. s: A person s height, the outcome of a coin toss Distinguish
Describing Distributions With Numbers Chapter 12
 Describing Distributions With Numbers Chapter 12 May 1, 2013 What Do We Usually Summarize? Measures of Center. Percentiles. Measures of Spread. A Summary. 1.0 What Do We Usually Summarize? source: Prof.
University of Jordan Fall 2009/2010 Department of Mathematics
 handouts Part 1 (Chapter 1 - Chapter 5) University of Jordan Fall 009/010 Department of Mathematics Chapter 1 Introduction to Introduction; Some Basic Concepts Statistics is a science related to making
Bayesian Decision Theory
 Bayesian Decision Theory Selim Aksoy Department of Computer Engineering Bilkent University saksoy@cs.bilkent.edu.tr CS 551, Fall 2017 CS 551, Fall 2017 c 2017, Selim Aksoy (Bilkent University) 1 / 46 Bayesian