Introduction to Statistics with GraphPad Prism 7
|
|
|
- Noel Mitchell
- 6 years ago
- Views:
Transcription


1 Introduction to Statistics with GraphPad Prism 7
2 Outline of the course Power analysis with G*Power Basic structure of a GraphPad Prism project Analysis of qualitative data Chi-square test Analysis of quantitative data t-test, ANOVA, correlation and curve fitting

3 Power analysis Definition of power: probability that a statistical test will reject a false null hypothesis (H 0 ) when the alternative hypothesis (H 1 ) is true. Translation: statistical power is the likelihood that a test will detect an effect when there is an effect to be detected. Main output of a power analysis: Estimation of an appropriate sample size Too big: waste of resources, Too small: may miss the effect (p>0.05)+ waste of resources, Grants: justification of sample size, Publications: reviewers ask for power calculation evidence, Home office: the 3 R: Replacement, Reduction and Refinement.
4 Hypothesis Experimental design Choice of a Statistical test Power analysis: Sample size Experiment(s) Data exploration Statistical analysis of the results
5 Experimental design Think stats!! Translate the hypothesis into statistical questions: What type of data? What statistical test? What sample size? Very important: Difference between technical and biological replicates. Technical Biological n=1 n=3
6 Power Analysis The power analysis depends on the relationship between 6 variables: the difference of biological interest the standard deviation Effect size the significance level the desired power of the experiment the sample size the alternative hypothesis (ie one or two-sided test)
7 1 The difference of biological interest This is to be determined scientifically, not statistically. minimum meaningful effect of biological relevance the larger the effect size, the smaller the experiment will need to be to detect it. How to determine it? Substantive knowledge, previous research, pilot study 2 The Standard Deviation (SD) Variability of the data How to determine it? Substantive knowledge, previous research, pilot study In power context : effect size: combination of both: e.g.: Cohen s d = (Mean 1 Mean 2)/Pooled SD
8 3 The significance level usually 5% (p<0.05) p-value is the probability that a difference as big as the one observed could be found even if there is no effect. Don t throw away a p-value=0.051! 4 The desired power of the experiment: 80% 5 The sample size: That s (often) the all point! 6 The alternative: One or two-sided test?
9 Fix any five of the variables and a mathematical relationship can be used to estimate the sixth. e.g. What sample size do I need to have a 80% probability (power) to detect this particular effect (difference and standard deviation) at a 5% significance level using a 2-sided test? Difference Standard deviation Sample size Significance level Power 2-sided test ( )
10 Good news: there are packages that can do the power analysis for you... providing you have some prior knowledge of the key parameters! difference + standard deviation = effect size Free packages: G*Power and InVivoStat Russ Lenth's power and sample-size page: Cheap package: StatMate (~ 30) Not so cheap package: MedCalc (~ 275)
11 Qualitative data = not numerical = values taken = usually names (also nominal) e.g. causes of death in hospital Values can be numbers but not numerical e.g. group number = numerical label but not unit of measurement Qualitative variable with intrinsic order in their categories = ordinal Particular case: qualitative variable with 2 categories: binary or dichotomous e.g. alive/dead or male/female
: Cats and dogs trained to line dance 2 different rewards: food or affection Is there a difference between the")

12 Analysis of qualitative data Example of data (cats and dogs.xlsx): Cats and dogs trained to line dance 2 different rewards: food or affection Is there a difference between the rewards? Is there a significant relationship between the 2 variables? are the animals rewarded by food more likely to line dance than the one rewarded by affection? To answer this question: Contingency table Fisher s exact test Food Affection Dance?? No dance?? But first: how large do your samples need to be?

13 G*Power A priori Power Analysis Example case: Preliminary results from a pilot study on cats: 25% line-danced after having received affection as a reward vs. 70% after having received food. Power analysis with G*Power = 4 steps Step1: choice of Test family

14 G*Power Step 2 : choice of Statistical test Fisher s exact test or Chi-square for 2x2 tables

15 G*Power Step 3: Type of power analysis

16 G*Power Step 4: Choice of Parameters Tricky bit: need information on the size of the difference and the variability.

17 G*Power Output: If the values from the pilot study are good predictors and if you use a sample of n=23 for each group, you will achieve a power of 81%.
18 The Null hypothesis and the error types The null hypothesis (H 0 ): H 0 = no effect e.g.: the animals rewarded by food are as likely to line dance as the one rewarded by affection The aim of a statistical test is to reject or not H 0. Statistical decision True state of H 0 Reject H 0 Do not reject H 0 H 0 True (no effect) Type I error α False Positive Correct True Negative H 0 False (effect) Correct True Positive Type II error β False Negative Traditionally, a test or a difference are said to be significant if the probability of type I error is: α =< 0.05 High specificity = low False Positives = low Type I error High sensitivity = low False Negatives = low Type II error
19 Chi-square test In a chi-square test, the observed frequencies for two or more groups are compared with expected frequencies by chance. With observed frequency = collected data Example with the cats and dogs.xlsx
20 Chi-square test (2) Animal Cat Dog Did they dance? Total Did they dance? Total Did they dance? * Type of Training * Animal Crosstabulation Yes No Yes No Count % within Did they dance? Count % within Did they dance? Count % within Did they dance? Count % within Did they dance? Count % within Did they dance? Count % within Did they dance? Type of Training Food as Af fection as Reward Reward Total % 18.8% 100.0% % 83.3% 100.0% % 52.9% 100.0% % 51.1% 100.0% % 52.6% 100.0% % 51.5% 100.0% Example: expected frequency of cats line dancing after having received food as a reward: Direct counts approach: Expected frequency=(row total)*(column total)/grand total = 32*32/68 = 15.1 Probability approach: Probability of line dancing: 32/68 Probability of receiving food: 32/68 Animal Cat Dog Did they dance? * Type of Training * Animal Crosstabulation Did they dance? Total Did they dance? Total Yes No Yes No Count Expected Count Count Expected Count Count Expected Count Count Expected Count Count Expected Count Count Expected Count Type of Training Food as Af fection as Reward Reward Total Expected frequency:(32/68)*(32/68)= % of 68 = 15.1 For the cats: Chi 2 = ( ) 2 / (6-16.9) 2 / (6-16.9) 2 / ( ) 2 /19.1 = 28.4 Is 28.4 big enough for the test to be significant?
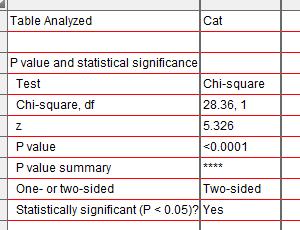
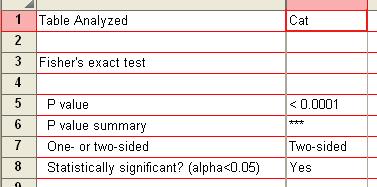
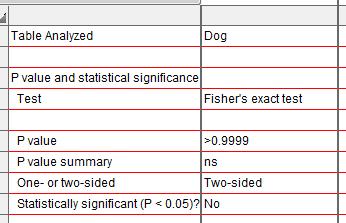
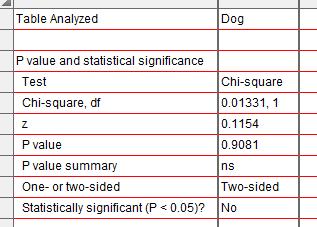
21
22 C o u n ts C o u n ts Chi-square test: results D o g C a t D a n c e Y e s D a n c e N o D a n c e Y e s D a n c e N o F o o d Af f e c t io n 0 F o o d Af f e c t io n In our example: cats are more likely to line dance if they are given food as reward than affection (p<0.0001) whereas dogs don t mind (p>0.99).
23 Quantitative data They take numerical values (units of measurement) Discrete: obtained by counting Example: number of students in a class values vary by finite specific steps or continuous: obtained by measuring Example: height of students in a class any values They can be described by a series of parameters: Mean, variance, standard deviation, standard error and confidence interval
24 The mean Definition: average of all values in a column It can be considered as a model because it summaries the data Example: a group of 5 persons: number of friends of each members of the group: 1, 2, 3, 3 and 4 Mean: ( )/5 = 2.6 friends per person Clearly an hypothetical value How can we know that it is an accurate model? Difference between the real data and the model created
25 The mean (2) Calculate the magnitude of the differences between each data and the mean: Total error = sum of difference From Field, 2000 No errors! = 0 Positive and negative: they cancel each other out.
26 Sum of Squared errors (SS) To avoid the problem of the direction of the error: we square them Instead of sum of errors: sum of squared errors (SS): SS gives a good measure of the accuracy of the model But: dependent upon the amount of data: the more data, the higher the SS. Solution: to divide the SS by the number of observations (N) As we are interested in measuring the error in the sample to estimate the one in the population we divide the SS by N-1 instead of N and we get the variance (S 2 ) = SS/N-1
27 Variance and standard deviation Problem with variance: measure in squared units For more convenience, the square root of the variance is taken to obtain a measure in the same unit as the original measure: the standard deviation S.D. = (SS/N-1) = (s 2 ) = s The standard deviation is a measure of how well the mean represents the data
28 Standard deviation Small S.D: data close to the mean: mean is a good fit of the data Large S.D.: data distant from the mean: mean is not an accurate representation
29 SD and SEM (SEM = SD/ N) What are they about? The SD quantifies how much the values vary from one another: scatter or spread The SD does not change predictably as you acquire more data. The SEM quantifies how accurately you know the true mean of the population. Why? Because it takes into account: SD + sample size The SEM gets smaller as your sample gets larger Why? Because the mean of a large sample is likely to be closer to the true mean than is the mean of a small sample.
30 SD and SEM The SD quantifies the scatter of the data. The SEM quantifies how much we expect sample means to vary.
31 SD or SEM? If the scatter is caused by biological variability, it is important to show the variation. Report the SD rather than the SEM. Better even: show a graph of all data points. If you are using an in vitro system with no biological variability, the scatter is about experimental imprecision (no biological meaning). Report the SEM to show how well you have determined the mean.
 Error bars Type Description Standard deviation Descriptive Typical or average difference between the data points and their mean.")
32 Confidence interval Range of values that we can be 95% confident contains the true mean of the population. - So limits of 95% CI: [Mean SEM; Mean SEM] (SEM = SD/ N) Error bars Type Description Standard deviation Descriptive Typical or average difference between the data points and their mean. Standard error Inferential A measure of how variable the mean will be, if you repeat the whole study many times. Confidence interval usually 95% CI Inferential A range of values you can be 95% confident contains the true mean.
33 Analysis of quantitative data Choose the correct statistical test to answer your question: They are 2 types of statistical tests: Parametric tests with 4 assumptions to be met by the data, Non-parametric tests with no or few assumptions (e.g. Mann-Whitney test) and/or for qualitative data (e.g. Fisher s exact and χ 2 tests).
 Normally distributed data Normal shape, bell shape, Gaussian shape Transformations can be made to make data suitable for")
34 Assumptions of Parametric Data All parametric tests have 4 basic assumptions that must be met for the test to be accurate. 1) Normally distributed data Normal shape, bell shape, Gaussian shape Transformations can be made to make data suitable for parametric analysis

35 Assumptions of Parametric Data (2) Frequent departure from normality: Skewness: lack of symmetry of a distribution Skewness < 0 Skewness = 0 Skewness > 0 Kurtosis: measure of the degree of peakedness in the distribution The two distributions below have the same variance approximately the same skew, but differ markedly in kurtosis. More peaked distribution: kurtosis > 0 Flatter distribution: kurtosis < 0
36 Assumptions of Parametric Data (3) 2) Homogeneity in variance The variance should not change systematically throughout the data 3) Interval data The distance between points of the scale should be equal at all parts along the scale 4) Independence Data from different subjects are independent Values corresponding to one subjects do not influence the values corresponding to another subject. Important in repeated measures experiments
37 Analysis of quantitative data Is there a difference between my groups regarding the variable I am measuring? e.g.: are the mice in the group A heavier than the one in group B? Tests with 2 groups: Parametric: t-test Non parametric: Mann-Whitney/Wilcoxon rank sum test Tests with more than 2 groups: Parametric: Analysis of variance (one-way ANOVA) Non parametric: Kruskal Wallis Is there a relationship between my 2 (continuous) variables? e.g.: is there a relationship between the daily intake in calories and an increase in body weight? Test: Correlation (parametric or non-parametric)
38 Remember: Stats are all about understanding and controlling variation. signal noise signal noise If the noise is low then the signal is detectable = statistical significance but if the noise (i.e. interindividual variation) is large then the same signal will not be detected = no statistical significance In a statistical test, the ratio of signal to noise determines the significance.

39 Comparison between 2 groups: Basic idea: t-test When we are looking at the differences between scores for 2 groups, we have to judge the difference between their means relative to the spread or variability of their scores Ex: comparison of 2 groups control and treatment
")
40 t-test (2)
41 t-test (3)
42 13 SE gap ~ 2 n=3 16 SE gap ~ 4.5 n=3 Dependent variable ~ 2 x SE: p~0.05 Dependent variable ~ 4.5 x SE: p~ A B 9 A B Dependent variable SE gap ~ 1 n>=10 Dependent variable SE gap ~ 2 n>=10 ~ 1 x SE: p~0.05 ~ 2 x SE: p~ A B 9.5 A B
43 CI overlap ~ 1 n=3 CI overlap ~ 0.5 n=3 14 Dependent variable ~ 1 x CI: p~0.05 Dependent variable ~ 0.5 x CI: p~ A CI overlap ~ 0.5 n>=10 B A B CI overlap ~ 0 n>= Dependent variable ~ 0.5 x CI: p~0.05 Dependent variable ~ 0 x CI: p~ A B 9 A B
44 3 types: t-test (4) Independent t-test it compares means for two independent groups of cases. Paired t-test it looks at the difference between two variables for a single group: the second sample is the same as the first after some treatment has been applied One-Sample t-test it tests whether the mean of a single variable differs from a specified constant (often 0)

45 Example: coyote.xlsx Question: is there a difference in size between males and females coyotes? 1 Power Analysis 2 Plot the data 3 Check the assumptions for parametric test 4 Statistical analysis: Independent t-test
 You expect a 5% difference between genders with a similar variability in the")
46 G*Power Independent t-test A priori Power analysis Example case: You don t have data from a pilot study but you have found some information in the literature. In a study run in similar conditions as in the one you intend to run, male coyotes were found to measure: 92cm+/- 7cm (SD) You expect a 5% difference between genders with a similar variability in the female sample. You need a sample size of n=76 (2*38)
47 Coyote 110 Maximum 100 Upper Quartile (Q3) 75 th percentile Length (cm) Median Interquartile Range (IQR) Lower Quartile (Q1) 25 th percentile Smallest data value > lower cutoff Cutoff = Q1 1.5*IQR 70 Outlier 60 Male Female
48
49 Assumptions for parametric tests Histogram of Coyote:Freq. dist. (histogram) 10 8 Counts OK here but if several groups of different sizes, go for percentages Female Male Counts Bin Center Female Male 10 Counts 5 Normality Bin Center Female Male 10 Counts Bin Center
50 L e n g th (c m ) B o d y M a s s B o d y M a s s Independent t-test: example Standard error coyote.xlsx C o y o te s 8 0 F e m a le M a le Standard deviation F e m a le M a le Length (cm) Confidence interval Male Female F e m a le M a le
.")
51 Independent t-test: results coyote.xlsx Males tend to be longer than females but not significantly so (p=0.1045). Homogeneity in variance What about the power of the analysis?
? Another example of t-test: working memory.")
52 Power analysis You would need a sample 3 times bigger to reach the accepted power of 80%. But is a 2.3 cm difference between genders biologically relevant (<3%)? Another example of t-test: working memory.xlsx

53 The sample size: the bigger the better? It takes huge samples to detect tiny differences but tiny samples to detect huge differences. What if the tiny difference is meaningless? Beware of overpower Nothing wrong with the stats: it is all about interpretation of the results of the test. Remember the important first step of power analysis What is the effect size of biological interest?


54 working memory.xlsx Normality

55 Paired t-test: Results working memory.xlsx No test for homogeneity of variances
56 Comparison of more than 2 means Why can t we do several t-tests? Because it increases the familywise error rate. What is the familywise error rate? The error rate across tests conducted on the same experimental data.
57 Familywise error rate Example: if you want to compare 3 groups and you carry out 3 t- tests, each with a 5% level of significance The probability of not making the type I error is 95% (=1 0.05) the overall probability of no type I errors is: 0.95 * 0.95 * 0.95 = So the probability of making at least one type I error is = or 14.3% The probability has increased from 5% to 14.3%! If you compare 5 groups instead of 3, the familywise error rate is 40%!!!!! (=1-(0.95) n ) Solution for multiple comparisons: Analysis of variance
58 Analysis of variance Extension of the 2 groups comparison of a t-test but with a slightly different logic: t-test = mean1 mean2 Pooled SD Pooled SD ANOVA = variance between means Pooled SD Pooled SD ANOVA compares variances: If variance between the several means > variance within the groups (random error) then the means must be more spread out than it would have been by chance.
59 Analysis of variance The statistic for ANOVA is the F ratio. F = Variance between the groups Variance within the groups (individual variability) F = Variation explained by the model (= systematic) Variation explained by unsystematic factors (= random variation) If the variance amongst sample means is greater than the error/random variance, then F>1 In an ANOVA, you test whether F is significantly higher than 1 or not.
60 Analysis of variance Source of variation Sum of Squares df Mean Square F p-value Between Groups < Within Groups Total Variance (= SS / N-1) is the mean square df: degree of freedom with df = N-1 In Power Analysis: Pooled SD= MS(Residual) Hypothetical model Between groups variability Total sum of squares Within groups variability
61 Example: protein expression.xlsx Question: is there a difference in protein expression between the 5 cell lines? 1 Plot the data 2 Check the assumptions for parametric test 3 Statistical analysis: ANOVA
62 10 Protein expression A B C D E Cell groups A B C D E Cell groups

63 Parametric tests assumptions
64 1.5 Protein expression (Log) A B C D E 1.5 Protein expression (Log) A B C D E Cell groups

65 Parametric tests assumptions Normality
66 Analysis of variance: Post hoc tests The ANOVA is an omnibus test: it tells you that there is (or not) a difference between your means but not exactly which means are significantly different from which other ones. To find out, you need to apply post hoc tests. These post hoc tests should only be used when the ANOVA finds a significant effect.

67 Analysis of variance


68 Analysis of variance Results Homogeneity of variance F=0.6727/ =8.13 Post hoc tests

69 Correlation A correlation coefficient is an index number that measures: The magnitude and the direction of the relation between 2 variables It is designed to range in value between -1 and +1
70 Correlation Most widely-used correlation coefficient: Pearson product-moment correlation coefficient r The 2 variables do not have to be measured in the same units but they have to be proportional (meaning linearly related) Coefficient of determination: r is the correlation between X and Y r 2 is the coefficient of determination: It gives you the proportion of variance in Y that can be explained by X, in percentage.

71 B o d y M a s s Correlation: example roe deer.xlsx Is there a relationship between parasite burden and body mass in roe deer? M a le F e m a le P a ra s ite s b u rd e n


72 Correlation: example roe deer.slsx There is a negative correlation between parasite load and fitness but this relationship is only significant for the males (p= vs. females: p=0.2940).
73 Curve fitting Dose-response curves Nonlinear regression Dose-response experiments typically use around 5-10 doses of agonist, equally spaced on a logarithmic scale. Y values are responses. The aim is often to determine the IC50 or the EC50 IC50 (I=Inhibition): concentration of an agonist that provokes a response half way between the maximal (Top) response and the maximally inhibited (Bottom) response EC50 (E=Effective): concentration that gives half-maximal response Stimulation: Y=Bottom + (Top-Bottom)/(1+10^((LogEC50-X)*HillSlope)) Inhibition: Y=Bottom + (Top-Bottom)/(1+10^((X-LogIC50)))
74 Curve fitting: example Inhibition data.xlsx N o in hib itor In h ib ito r Step by step analysis and considerations: lo g (A g o n is t], M 1- Choose a Fit: not necessary to normalize should choose it when values defining 0 and 100 are precise variable slope better if plenty of data points (variable slope or 4 parameters) 2- Compare different conditions: Diff in parameters Diff between conditions for one or more parameters Constraint vs no constraint Diff between conditions for one or more parameters 3- Constrain: depends on your experiment depends if your data don t define the top or the bottom of the curve 4- Weights: important if you have unequal scatter among replicates
75 Curve fitting: example Inhibition data.xlsx N o in hib itor In h ib ito r lo g (A g o n is t], M Step by step analysis and considerations: 5- Initial values: defaults usually OK unless the fit looks funny 6- Range: defaults usually OK unless you are not interested in the x-variable full range (ie time) 7- Output: summary table presents same results in a summarized way. 8- Diagnostics: check for normality (weights) and outliers (but keep them in the analysis) check Replicates test


 0-5 0-9.")

 0-1 0. 0-9. 0 lo g (A g o n is t)")
76 R e s p o n s e (% ) R e s p o n s e R e s p o n s e Curve fitting: example Inhibition data.xlsx N o n - n o rm a liz e d d a ta 4 p a ra m e te rs N o n - n o rm a liz e d d a ta 3 p a ra m e te rs E C E C N o in h ib ito r In h ib ito r N o in h ib ito r In h ib ito r lo g (A g o n is t) lo g (A g o n is t) N o rm a liz e d d a ta 3 p a ra m e te rs N o rm a liz e d d a ta 4 p a ra m e te rs E C N o in h ib ito r In h ib ito r 3 0 N o in h ib ito r In h ib ito r lo g (A g o n is t) lo g (A g o n is t)
77 R e s p o n s e (% ) R e s p o n s e R e s p o n s e Curve fitting: example Inhibition data.xlsx N o n - n o rm a liz e d d a ta 4 p a ra m e te rs No inhibitor Inhibitor No inhibitor Inhibitor Replicates test for lack of fit SD replicates SD lack of fit Discrepancy (F) P value Evidence of inadequate model? Yes No E C 5 0 N o in h ib ito r In h ib ito r lo g (A g o n is t) N o n - n o rm a liz e d d a ta 3 p a ra m e te rs Replicates test for lack of fit SD replicates SD lack of fit Discrepancy (F) P value Evidence of inadequate model? Yes No E C 5 0 N o in h ib ito r In h ib ito r lo g (A g o n is t) N o rm a liz e d d a ta 4 p a ra m e te rs Replicates test for lack of fit SD replicates SD lack of fit Discrepancy (F) P value Evidence of inadequate model? Yes No E C N o in h ib ito r 4 0 In h ib ito r lo g (A g o n is t) N o rm a liz e d d a ta 3 p a ra m e te rs Replicates test for lack of fit SD replicates SD lack of fit Discrepancy (F) P value Evidence of inadequate model? Yes No N o in h ib ito r 2 0 In h ib ito r lo g (A g o n is t)
78
79 My address if you need some help with GraphPad:
Glossary. The ISI glossary of statistical terms provides definitions in a number of different languages:
 Glossary The ISI glossary of statistical terms provides definitions in a number of different languages: http://isi.cbs.nl/glossary/index.htm Adjusted r 2 Adjusted R squared measures the proportion of the
Contents. Acknowledgments. xix
 Table of Preface Acknowledgments page xv xix 1 Introduction 1 The Role of the Computer in Data Analysis 1 Statistics: Descriptive and Inferential 2 Variables and Constants 3 The Measurement of Variables
CHAPTER 17 CHI-SQUARE AND OTHER NONPARAMETRIC TESTS FROM: PAGANO, R. R. (2007)
") FROM: PAGANO, R. R. (007) I. INTRODUCTION: DISTINCTION BETWEEN PARAMETRIC AND NON-PARAMETRIC TESTS Statistical inference tests are often classified as to whether they are parametric or nonparametric Parameter
FROM: PAGANO, R. R. (007) I. INTRODUCTION: DISTINCTION BETWEEN PARAMETRIC AND NON-PARAMETRIC TESTS Statistical inference tests are often classified as to whether they are parametric or nonparametric Parameter
DETAILED CONTENTS PART I INTRODUCTION AND DESCRIPTIVE STATISTICS. 1. Introduction to Statistics
 DETAILED CONTENTS About the Author Preface to the Instructor To the Student How to Use SPSS With This Book PART I INTRODUCTION AND DESCRIPTIVE STATISTICS 1. Introduction to Statistics 1.1 Descriptive and
4/6/16. Non-parametric Test. Overview. Stephen Opiyo. Distinguish Parametric and Nonparametric Test Procedures
 Non-parametric Test Stephen Opiyo Overview Distinguish Parametric and Nonparametric Test Procedures Explain commonly used Nonparametric Test Procedures Perform Hypothesis Tests Using Nonparametric Procedures
Frequency Distribution Cross-Tabulation
 Frequency Distribution Cross-Tabulation 1) Overview 2) Frequency Distribution 3) Statistics Associated with Frequency Distribution i. Measures of Location ii. Measures of Variability iii. Measures of Shape
Review of Statistics 101
 Review of Statistics 101 We review some important themes from the course 1. Introduction Statistics- Set of methods for collecting/analyzing data (the art and science of learning from data). Provides methods
Introduction and Descriptive Statistics p. 1 Introduction to Statistics p. 3 Statistics, Science, and Observations p. 5 Populations and Samples p.
 Preface p. xi Introduction and Descriptive Statistics p. 1 Introduction to Statistics p. 3 Statistics, Science, and Observations p. 5 Populations and Samples p. 6 The Scientific Method and the Design of
Intuitive Biostatistics: Choosing a statistical test
 pagina 1 van 5 < BACK Intuitive Biostatistics: Choosing a statistical This is chapter 37 of Intuitive Biostatistics (ISBN 0-19-508607-4) by Harvey Motulsky. Copyright 1995 by Oxfd University Press Inc.
Inferences About the Difference Between Two Means
 7 Inferences About the Difference Between Two Means Chapter Outline 7.1 New Concepts 7.1.1 Independent Versus Dependent Samples 7.1. Hypotheses 7. Inferences About Two Independent Means 7..1 Independent
Degrees of freedom df=1. Limitations OR in SPSS LIM: Knowing σ and µ is unlikely in large
 Z Test Comparing a group mean to a hypothesis T test (about 1 mean) T test (about 2 means) Comparing mean to sample mean. Similar means = will have same response to treatment Two unknown means are different
Basic Statistical Analysis
 indexerrt.qxd 8/21/2002 9:47 AM Page 1 Corrected index pages for Sprinthall Basic Statistical Analysis Seventh Edition indexerrt.qxd 8/21/2002 9:47 AM Page 656 Index Abscissa, 24 AB-STAT, vii ADD-OR rule,
Business Statistics. Lecture 10: Course Review
 Business Statistics Lecture 10: Course Review 1 Descriptive Statistics for Continuous Data Numerical Summaries Location: mean, median Spread or variability: variance, standard deviation, range, percentiles,
Chapter Fifteen. Frequency Distribution, Cross-Tabulation, and Hypothesis Testing
 Chapter Fifteen Frequency Distribution, Cross-Tabulation, and Hypothesis Testing Copyright 2010 Pearson Education, Inc. publishing as Prentice Hall 15-1 Internet Usage Data Table 15.1 Respondent Sex Familiarity
Parametric versus Nonparametric Statistics-when to use them and which is more powerful? Dr Mahmoud Alhussami
 Parametric versus Nonparametric Statistics-when to use them and which is more powerful? Dr Mahmoud Alhussami Parametric Assumptions The observations must be independent. Dependent variable should be continuous
Statistics: revision
 NST 1B Experimental Psychology Statistics practical 5 Statistics: revision Rudolf Cardinal & Mike Aitken 29 / 30 April 2004 Department of Experimental Psychology University of Cambridge Handouts: Answers
Multiple Comparisons
 Multiple Comparisons Error Rates, A Priori Tests, and Post-Hoc Tests Multiple Comparisons: A Rationale Multiple comparison tests function to tease apart differences between the groups within our IV when
Review for Final. Chapter 1 Type of studies: anecdotal, observational, experimental Random sampling
 Review for Final For a detailed review of Chapters 1 7, please see the review sheets for exam 1 and. The following only briefly covers these sections. The final exam could contain problems that are included
Course Review. Kin 304W Week 14: April 9, 2013
 Course Review Kin 304W Week 14: April 9, 2013 1 Today s Outline Format of Kin 304W Final Exam Course Review Hand back marked Project Part II 2 Kin 304W Final Exam Saturday, Thursday, April 18, 3:30-6:30
Background to Statistics
 FACT SHEET Background to Statistics Introduction Statistics include a broad range of methods for manipulating, presenting and interpreting data. Professional scientists of all kinds need to be proficient
Bio 183 Statistics in Research. B. Cleaning up your data: getting rid of problems
 Bio 183 Statistics in Research A. Research designs B. Cleaning up your data: getting rid of problems C. Basic descriptive statistics D. What test should you use? What is science?: Science is a way of knowing.(anon.?)
Glossary for the Triola Statistics Series
 Glossary for the Triola Statistics Series Absolute deviation The measure of variation equal to the sum of the deviations of each value from the mean, divided by the number of values Acceptance sampling
Fundamentals to Biostatistics. Prof. Chandan Chakraborty Associate Professor School of Medical Science & Technology IIT Kharagpur
 Fundamentals to Biostatistics Prof. Chandan Chakraborty Associate Professor School of Medical Science & Technology IIT Kharagpur Statistics collection, analysis, interpretation of data development of new
Statistics Boot Camp. Dr. Stephanie Lane Institute for Defense Analyses DATAWorks 2018
 Statistics Boot Camp Dr. Stephanie Lane Institute for Defense Analyses DATAWorks 2018 March 21, 2018 Outline of boot camp Summarizing and simplifying data Point and interval estimation Foundations of statistical
Psych 230. Psychological Measurement and Statistics
 Psych 230 Psychological Measurement and Statistics Pedro Wolf December 9, 2009 This Time. Non-Parametric statistics Chi-Square test One-way Two-way Statistical Testing 1. Decide which test to use 2. State
Hypothesis testing, part 2. With some material from Howard Seltman, Blase Ur, Bilge Mutlu, Vibha Sazawal
 Hypothesis testing, part 2 With some material from Howard Seltman, Blase Ur, Bilge Mutlu, Vibha Sazawal 1 CATEGORICAL IV, NUMERIC DV 2 Independent samples, one IV # Conditions Normal/Parametric Non-parametric
ESP 178 Applied Research Methods. 2/23: Quantitative Analysis
 ESP 178 Applied Research Methods 2/23: Quantitative Analysis Data Preparation Data coding create codebook that defines each variable, its response scale, how it was coded Data entry for mail surveys and
Introduction to hypothesis testing
 Introduction to hypothesis testing Review: Logic of Hypothesis Tests Usually, we test (attempt to falsify) a null hypothesis (H 0 ): includes all possibilities except prediction in hypothesis (H A ) If
Last Lecture. Distinguish Populations from Samples. Knowing different Sampling Techniques. Distinguish Parameters from Statistics
 Last Lecture Distinguish Populations from Samples Importance of identifying a population and well chosen sample Knowing different Sampling Techniques Distinguish Parameters from Statistics Knowing different
Review. Number of variables. Standard Scores. Anecdotal / Clinical. Bivariate relationships. Ch. 3: Correlation & Linear Regression
 Ch. 3: Correlation & Relationships between variables Scatterplots Exercise Correlation Race / DNA Review Why numbers? Distribution & Graphs : Histogram Central Tendency Mean (SD) The Central Limit Theorem
Turning a research question into a statistical question.
 Turning a research question into a statistical question. IGINAL QUESTION: Concept Concept Concept ABOUT ONE CONCEPT ABOUT RELATIONSHIPS BETWEEN CONCEPTS TYPE OF QUESTION: DESCRIBE what s going on? DECIDE
STATISTICS 141 Final Review
 STATISTICS 141 Final Review Bin Zou bzou@ualberta.ca Department of Mathematical & Statistical Sciences University of Alberta Winter 2015 Bin Zou (bzou@ualberta.ca) STAT 141 Final Review Winter 2015 1 /
Rama Nada. -Ensherah Mokheemer. 1 P a g e
 - 9 - Rama Nada -Ensherah Mokheemer - 1 P a g e Quick revision: Remember from the last lecture that chi square is an example of nonparametric test, other examples include Kruskal Wallis, Mann Whitney and
AP Statistics Cumulative AP Exam Study Guide
 AP Statistics Cumulative AP Eam Study Guide Chapters & 3 - Graphs Statistics the science of collecting, analyzing, and drawing conclusions from data. Descriptive methods of organizing and summarizing statistics
Review of Multiple Regression
 Ronald H. Heck 1 Let s begin with a little review of multiple regression this week. Linear models [e.g., correlation, t-tests, analysis of variance (ANOVA), multiple regression, path analysis, multivariate
Readings Howitt & Cramer (2014) Overview
 Overview") Readings Howitt & Cramer (4) Ch 7: Relationships between two or more variables: Diagrams and tables Ch 8: Correlation coefficients: Pearson correlation and Spearman s rho Ch : Statistical significance
Readings Howitt & Cramer (4) Ch 7: Relationships between two or more variables: Diagrams and tables Ch 8: Correlation coefficients: Pearson correlation and Spearman s rho Ch : Statistical significance
The t-statistic. Student s t Test
 The t-statistic 1 Student s t Test When the population standard deviation is not known, you cannot use a z score hypothesis test Use Student s t test instead Student s t, or t test is, conceptually, very
Correlation and Regression
 Correlation and Regression Dr. Bob Gee Dean Scott Bonney Professor William G. Journigan American Meridian University 1 Learning Objectives Upon successful completion of this module, the student should
MATH 1150 Chapter 2 Notation and Terminology
 MATH 1150 Chapter 2 Notation and Terminology Categorical Data The following is a dataset for 30 randomly selected adults in the U.S., showing the values of two categorical variables: whether or not the
What is Statistics? Statistics is the science of understanding data and of making decisions in the face of variability and uncertainty.
 What is Statistics? Statistics is the science of understanding data and of making decisions in the face of variability and uncertainty. Statistics is a field of study concerned with the data collection,
Non-parametric (Distribution-free) approaches p188 CN
 approaches p188 CN") Week 1: Introduction to some nonparametric and computer intensive (re-sampling) approaches: the sign test, Wilcoxon tests and multi-sample extensions, Spearman s rank correlation; the Bootstrap. (ch14
Week 1: Introduction to some nonparametric and computer intensive (re-sampling) approaches: the sign test, Wilcoxon tests and multi-sample extensions, Spearman s rank correlation; the Bootstrap. (ch14
Preliminary Statistics course. Lecture 1: Descriptive Statistics
 Preliminary Statistics course Lecture 1: Descriptive Statistics Rory Macqueen (rm43@soas.ac.uk), September 2015 Organisational Sessions: 16-21 Sep. 10.00-13.00, V111 22-23 Sep. 15.00-18.00, V111 24 Sep.
PSY 307 Statistics for the Behavioral Sciences. Chapter 20 Tests for Ranked Data, Choosing Statistical Tests
 PSY 307 Statistics for the Behavioral Sciences Chapter 20 Tests for Ranked Data, Choosing Statistical Tests What To Do with Non-normal Distributions Tranformations (pg 382): The shape of the distribution
Lecture 5: ANOVA and Correlation
 Lecture 5: ANOVA and Correlation Ani Manichaikul amanicha@jhsph.edu 23 April 2007 1 / 62 Comparing Multiple Groups Continous data: comparing means Analysis of variance Binary data: comparing proportions
Introduction to Statistics with R v
 Introduction to Statistics with R v. 2018-05 Out line of the course Short introduction to power analysis Analysis of qualitative data Chi-square test Analysis of quantitative data t-test, ANOVA and correlation
Introduction to inferential statistics. Alissa Melinger IGK summer school 2006 Edinburgh
 Introduction to inferential statistics Alissa Melinger IGK summer school 2006 Edinburgh Short description Prereqs: I assume no prior knowledge of stats This half day tutorial on statistical analysis will
Exam details. Final Review Session. Things to Review
 Exam details Final Review Session Short answer, similar to book problems Formulae and tables will be given You CAN use a calculator Date and Time: Dec. 7, 006, 1-1:30 pm Location: Osborne Centre, Unit
Statistics Handbook. All statistical tables were computed by the author.
 Statistics Handbook Contents Page Wilcoxon rank-sum test (Mann-Whitney equivalent) Wilcoxon matched-pairs test 3 Normal Distribution 4 Z-test Related samples t-test 5 Unrelated samples t-test 6 Variance
Chapter 26: Comparing Counts (Chi Square)
") Chapter 6: Comparing Counts (Chi Square) We ve seen that you can turn a qualitative variable into a quantitative one (by counting the number of successes and failures), but that s a compromise it forces
Chapter 6: Comparing Counts (Chi Square) We ve seen that you can turn a qualitative variable into a quantitative one (by counting the number of successes and failures), but that s a compromise it forces
Experimental Design and Data Analysis for Biologists
 Experimental Design and Data Analysis for Biologists Gerry P. Quinn Monash University Michael J. Keough University of Melbourne CAMBRIDGE UNIVERSITY PRESS Contents Preface page xv I I Introduction 1 1.1
Intro to Parametric & Nonparametric Statistics
 Kinds of variable The classics & some others Intro to Parametric & Nonparametric Statistics Kinds of variables & why we care Kinds & definitions of nonparametric statistics Where parametric stats come
Readings Howitt & Cramer (2014)
") Readings Howitt & Cramer (014) Ch 7: Relationships between two or more variables: Diagrams and tables Ch 8: Correlation coefficients: Pearson correlation and Spearman s rho Ch 11: Statistical significance
Readings Howitt & Cramer (014) Ch 7: Relationships between two or more variables: Diagrams and tables Ch 8: Correlation coefficients: Pearson correlation and Spearman s rho Ch 11: Statistical significance
Analysis of variance (ANOVA) Comparing the means of more than two groups
 Comparing the means of more than two groups") Analysis of variance (ANOVA) Comparing the means of more than two groups Example: Cost of mating in male fruit flies Drosophila Treatments: place males with and without unmated (virgin) females Five treatments
Analysis of variance (ANOVA) Comparing the means of more than two groups Example: Cost of mating in male fruit flies Drosophila Treatments: place males with and without unmated (virgin) females Five treatments
Chapter 23. Inferences About Means. Monday, May 6, 13. Copyright 2009 Pearson Education, Inc.
 Chapter 23 Inferences About Means Sampling Distributions of Means Now that we know how to create confidence intervals and test hypotheses about proportions, we do the same for means. Just as we did before,
9/2/2010. Wildlife Management is a very quantitative field of study. throughout this course and throughout your career.
 Introduction to Data and Analysis Wildlife Management is a very quantitative field of study Results from studies will be used throughout this course and throughout your career. Sampling design influences
An inferential procedure to use sample data to understand a population Procedures
 Hypothesis Test An inferential procedure to use sample data to understand a population Procedures Hypotheses, the alpha value, the critical region (z-scores), statistics, conclusion Two types of errors
Using SPSS for One Way Analysis of Variance
 Using SPSS for One Way Analysis of Variance This tutorial will show you how to use SPSS version 12 to perform a one-way, between- subjects analysis of variance and related post-hoc tests. This tutorial
GROUPED DATA E.G. FOR SAMPLE OF RAW DATA (E.G. 4, 12, 7, 5, MEAN G x / n STANDARD DEVIATION MEDIAN AND QUARTILES STANDARD DEVIATION
 FOR SAMPLE OF RAW DATA (E.G. 4, 1, 7, 5, 11, 6, 9, 7, 11, 5, 4, 7) BE ABLE TO COMPUTE MEAN G / STANDARD DEVIATION MEDIAN AND QUARTILES Σ ( Σ) / 1 GROUPED DATA E.G. AGE FREQ. 0-9 53 10-19 4...... 80-89
The entire data set consists of n = 32 widgets, 8 of which were made from each of q = 4 different materials.
 One-Way ANOVA Summary The One-Way ANOVA procedure is designed to construct a statistical model describing the impact of a single categorical factor X on a dependent variable Y. Tests are run to determine
Exploratory Data Analysis
 CS448B :: 30 Sep 2010 Exploratory Data Analysis Last Time: Visualization Re-Design Jeffrey Heer Stanford University In-Class Design Exercise Mackinlay s Ranking Task: Analyze and Re-design visualization
Introduction to the Analysis of Variance (ANOVA) Computing One-Way Independent Measures (Between Subjects) ANOVAs
 Computing One-Way Independent Measures (Between Subjects) ANOVAs") Introduction to the Analysis of Variance (ANOVA) Computing One-Way Independent Measures (Between Subjects) ANOVAs The Analysis of Variance (ANOVA) The analysis of variance (ANOVA) is a statistical technique
Introduction to the Analysis of Variance (ANOVA) Computing One-Way Independent Measures (Between Subjects) ANOVAs The Analysis of Variance (ANOVA) The analysis of variance (ANOVA) is a statistical technique
Binary Logistic Regression
 The coefficients of the multiple regression model are estimated using sample data with k independent variables Estimated (or predicted) value of Y Estimated intercept Estimated slope coefficients Ŷ = b
STAT 200 Chapter 1 Looking at Data - Distributions
 STAT 200 Chapter 1 Looking at Data - Distributions What is Statistics? Statistics is a science that involves the design of studies, data collection, summarizing and analyzing the data, interpreting the
Permutation Tests. Noa Haas Statistics M.Sc. Seminar, Spring 2017 Bootstrap and Resampling Methods
 Permutation Tests Noa Haas Statistics M.Sc. Seminar, Spring 2017 Bootstrap and Resampling Methods The Two-Sample Problem We observe two independent random samples: F z = z 1, z 2,, z n independently of
Types of Statistical Tests DR. MIKE MARRAPODI
 Types of Statistical Tests DR. MIKE MARRAPODI Tests t tests ANOVA Correlation Regression Multivariate Techniques Non-parametric t tests One sample t test Independent t test Paired sample t test One sample
COMPARING SEVERAL MEANS: ANOVA
 LAST UPDATED: November 15, 2012 COMPARING SEVERAL MEANS: ANOVA Objectives 2 Basic principles of ANOVA Equations underlying one-way ANOVA Doing a one-way ANOVA in R Following up an ANOVA: Planned contrasts/comparisons
Introduction to Statistical Analysis
 Introduction to Statistical Analysis Changyu Shen Richard A. and Susan F. Smith Center for Outcomes Research in Cardiology Beth Israel Deaconess Medical Center Harvard Medical School Objectives Descriptive
Stat 101 Exam 1 Important Formulas and Concepts 1
 1 Chapter 1 1.1 Definitions Stat 101 Exam 1 Important Formulas and Concepts 1 1. Data Any collection of numbers, characters, images, or other items that provide information about something. 2. Categorical/Qualitative
Sampling Distributions: Central Limit Theorem
 Review for Exam 2 Sampling Distributions: Central Limit Theorem Conceptually, we can break up the theorem into three parts: 1. The mean (µ M ) of a population of sample means (M) is equal to the mean (µ)
Comparing Several Means: ANOVA
 Comparing Several Means: ANOVA Understand the basic principles of ANOVA Why it is done? What it tells us? Theory of one way independent ANOVA Following up an ANOVA: Planned contrasts/comparisons Choosing
sphericity, 5-29, 5-32 residuals, 7-1 spread and level, 2-17 t test, 1-13 transformations, 2-15 violations, 1-19
 additive tree structure, 10-28 ADDTREE, 10-51, 10-53 EXTREE, 10-31 four point condition, 10-29 ADDTREE, 10-28, 10-51, 10-53 adjusted R 2, 8-7 ALSCAL, 10-49 ANCOVA, 9-1 assumptions, 9-5 example, 9-7 MANOVA
Vocabulary: Samples and Populations
 Vocabulary: Samples and Populations Concept Different types of data Categorical data results when the question asked in a survey or sample can be answered with a nonnumerical answer. For example if we
Hypothesis testing: Steps
 Review for Exam 2 Hypothesis testing: Steps Exam 2 Review 1. Determine appropriate test and hypotheses 2. Use distribution table to find critical statistic value(s) representing rejection region 3. Compute
Nonparametric statistic methods. Waraphon Phimpraphai DVM, PhD Department of Veterinary Public Health
 Nonparametric statistic methods Waraphon Phimpraphai DVM, PhD Department of Veterinary Public Health Measurement What are the 4 levels of measurement discussed? 1. Nominal or Classificatory Scale Gender,
SPSS Guide For MMI 409
 SPSS Guide For MMI 409 by John Wong March 2012 Preface Hopefully, this document can provide some guidance to MMI 409 students on how to use SPSS to solve many of the problems covered in the D Agostino
CIVL 7012/8012. Collection and Analysis of Information
 CIVL 7012/8012 Collection and Analysis of Information Uncertainty in Engineering Statistics deals with the collection and analysis of data to solve real-world problems. Uncertainty is inherent in all real
Chapter 7 Comparison of two independent samples
 Chapter 7 Comparison of two independent samples 7.1 Introduction Population 1 µ σ 1 1 N 1 Sample 1 y s 1 1 n 1 Population µ σ N Sample y s n 1, : population means 1, : population standard deviations N
Psych Jan. 5, 2005
 Psych 124 1 Wee 1: Introductory Notes on Variables and Probability Distributions (1/5/05) (Reading: Aron & Aron, Chaps. 1, 14, and this Handout.) All handouts are available outside Mija s office. Lecture
Power and nonparametric methods Basic statistics for experimental researchersrs 2017
 Faculty of Health Sciences Outline Power and nonparametric methods Basic statistics for experimental researchersrs 2017 Statistical power Julie Lyng Forman Department of Biostatistics, University of Copenhagen
Stat 427/527: Advanced Data Analysis I
 Stat 427/527: Advanced Data Analysis I Review of Chapters 1-4 Sep, 2017 1 / 18 Concepts you need to know/interpret Numerical summaries: measures of center (mean, median, mode) measures of spread (sample
Tastitsticsss? What s that? Principles of Biostatistics and Informatics. Variables, outcomes. Tastitsticsss? What s that?
 Tastitsticsss? What s that? Statistics describes random mass phanomenons. Principles of Biostatistics and Informatics nd Lecture: Descriptive Statistics 3 th September Dániel VERES Data Collecting (Sampling)
STAT 135 Lab 9 Multiple Testing, One-Way ANOVA and Kruskal-Wallis
 STAT 135 Lab 9 Multiple Testing, One-Way ANOVA and Kruskal-Wallis Rebecca Barter April 6, 2015 Multiple Testing Multiple Testing Recall that when we were doing two sample t-tests, we were testing the equality
Hypothesis testing: Steps
 Review for Exam 2 Hypothesis testing: Steps Repeated-Measures ANOVA 1. Determine appropriate test and hypotheses 2. Use distribution table to find critical statistic value(s) representing rejection region
z and t tests for the mean of a normal distribution Confidence intervals for the mean Binomial tests
 z and t tests for the mean of a normal distribution Confidence intervals for the mean Binomial tests Chapters 3.5.1 3.5.2, 3.3.2 Prof. Tesler Math 283 Fall 2018 Prof. Tesler z and t tests for mean Math
Introduction to the Analysis of Variance (ANOVA)
") Introduction to the Analysis of Variance (ANOVA) The Analysis of Variance (ANOVA) The analysis of variance (ANOVA) is a statistical technique for testing for differences between the means of multiple (more
Introduction to the Analysis of Variance (ANOVA) The Analysis of Variance (ANOVA) The analysis of variance (ANOVA) is a statistical technique for testing for differences between the means of multiple (more
16.400/453J Human Factors Engineering. Design of Experiments II
 J Human Factors Engineering Design of Experiments II Review Experiment Design and Descriptive Statistics Research question, independent and dependent variables, histograms, box plots, etc. Inferential
LOOKING FOR RELATIONSHIPS
 LOOKING FOR RELATIONSHIPS One of most common types of investigation we do is to look for relationships between variables. Variables may be nominal (categorical), for example looking at the effect of an
The One-Way Repeated-Measures ANOVA. (For Within-Subjects Designs)
") The One-Way Repeated-Measures ANOVA (For Within-Subjects Designs) Logic of the Repeated-Measures ANOVA The repeated-measures ANOVA extends the analysis of variance to research situations using repeated-measures
The One-Way Repeated-Measures ANOVA (For Within-Subjects Designs) Logic of the Repeated-Measures ANOVA The repeated-measures ANOVA extends the analysis of variance to research situations using repeated-measures
Lecture 7: Hypothesis Testing and ANOVA
 Lecture 7: Hypothesis Testing and ANOVA Goals Overview of key elements of hypothesis testing Review of common one and two sample tests Introduction to ANOVA Hypothesis Testing The intent of hypothesis
SPSS LAB FILE 1
 SPSS LAB FILE www.mcdtu.wordpress.com 1 www.mcdtu.wordpress.com 2 www.mcdtu.wordpress.com 3 OBJECTIVE 1: Transporation of Data Set to SPSS Editor INPUTS: Files: group1.xlsx, group1.txt PROCEDURE FOLLOWED:
CHI SQUARE ANALYSIS 8/18/2011 HYPOTHESIS TESTS SO FAR PARAMETRIC VS. NON-PARAMETRIC
 CHI SQUARE ANALYSIS I N T R O D U C T I O N T O N O N - P A R A M E T R I C A N A L Y S E S HYPOTHESIS TESTS SO FAR We ve discussed One-sample t-test Dependent Sample t-tests Independent Samples t-tests
SEVERAL μs AND MEDIANS: MORE ISSUES. Business Statistics
 SEVERAL μs AND MEDIANS: MORE ISSUES Business Statistics CONTENTS Post-hoc analysis ANOVA for 2 groups The equal variances assumption The Kruskal-Wallis test Old exam question Further study POST-HOC ANALYSIS
Dover- Sherborn High School Mathematics Curriculum Probability and Statistics
 Mathematics Curriculum A. DESCRIPTION This is a full year courses designed to introduce students to the basic elements of statistics and probability. Emphasis is placed on understanding terminology and
Unit 2. Describing Data: Numerical
 Unit 2 Describing Data: Numerical Describing Data Numerically Describing Data Numerically Central Tendency Arithmetic Mean Median Mode Variation Range Interquartile Range Variance Standard Deviation Coefficient
psychological statistics
 psychological statistics B Sc. Counselling Psychology 011 Admission onwards III SEMESTER COMPLEMENTARY COURSE UNIVERSITY OF CALICUT SCHOOL OF DISTANCE EDUCATION CALICUT UNIVERSITY.P.O., MALAPPURAM, KERALA,
Many natural processes can be fit to a Poisson distribution
 BE.104 Spring Biostatistics: Poisson Analyses and Power J. L. Sherley Outline 1) Poisson analyses 2) Power What is a Poisson process? Rare events Values are observational (yes or no) Random distributed
Non-parametric tests, part A:
 Two types of statistical test: Non-parametric tests, part A: Parametric tests: Based on assumption that the data have certain characteristics or "parameters": Results are only valid if (a) the data are
 http://www.statsoft.it/out.php?loc=http://www.statsoft.com/textbook/ Group comparison test for independent samples The purpose of the Analysis of Variance (ANOVA) is to test for significant differences
AP Final Review II Exploring Data (20% 30%)
") AP Final Review II Exploring Data (20% 30%) Quantitative vs Categorical Variables Quantitative variables are numerical values for which arithmetic operations such as means make sense. It is usually a measure
AP Final Review II Exploring Data (20% 30%) Quantitative vs Categorical Variables Quantitative variables are numerical values for which arithmetic operations such as means make sense. It is usually a measure
Nonparametric Statistics
 Nonparametric Statistics Nonparametric or Distribution-free statistics: used when data are ordinal (i.e., rankings) used when ratio/interval data are not normally distributed (data are converted to ranks)