COMPARING SEVERAL MEANS: ANOVA
|
|
|
- Jonah Pitts
- 6 years ago
- Views:
Transcription
1 LAST UPDATED: November 15, 2012 COMPARING SEVERAL MEANS: ANOVA
2 Objectives 2 Basic principles of ANOVA Equations underlying one-way ANOVA Doing a one-way ANOVA in R Following up an ANOVA: Planned contrasts/comparisons n Choosing contrasts n Coding contrasts Post hoc tests ANOVA as regression
3 Objectives 3 Basic principles of ANOVA Equations underlying one-way ANOVA Doing a one-way ANOVA in R Following up an ANOVA: Planned contrasts/comparisons n Choosing contrasts n Coding contrasts Post hoc tests ANOVA as regression
4 When and Why 4 When we want to compare means we can use a t-test. This test has limitations: You can compare only 2 means: often we would like to compare means from 3 or more groups. It can be used only with one predictor/independent variable. ANOVA Compares several means. Can be used when you have manipulated more than one independent variable. It is an extension of regression (the general linear model).
5 Generalizing t-tests 5 t-tests allow us to test hypotheses about differences between two groups or conditions (e.g., treatment and control). What do we do if we wish to compare multiple groups or conditions simultaneously? Examples: Effects of 3 different therapies for autism Effects of 4 different SSRIs on seratonin re-uptake Effects of 5 different body orientations on judgement of induced self-motion.


6 Why Not Use Lots of t-tests? 6 If we want to compare several means why don t we compare pairs of means with t-tests? Inflates the Type I error rate familywise error = n
7 Advantages of ANOVA 7 Avoid inflation in error rate due to multiple comparisons Can detect an effect of the treatment even when no 2 groups are significantly different.

8 What Does ANOVA Tell Us? 8 Null hypothesis: Like a t-test, ANOVA tests the null hypothesis that the means are the same. Experimental hypothesis: The means differ. ANOVA is an omnibus test It test for an overall difference between groups. It tells us that the group means are different. It doesn t tell us exactly which means differ.
9 6-Step Process for ANOVA 9 1. State the hypotheses : µ = µ =... = µ H : i, j [1,..., n] : µ µ A i j 2. Select the statistical test and significance level 3. Select the samples and collect the data 4. Find the region of rejection 5. Calculate the test statistic 6. Make the statistical decision H n
10 Theory of ANOVA 10 We calculate how much variability there is between scores Total sum of squares (SS T ). We then calculate how much of this variability can be explained by the model we fit to the data How much variability is due to the experimental manipulation, model sum of squares (SS M )... and how much cannot be explained How much variability is due to individual differences in performance, residual sum of squares (SS R ).
11 Theory of ANOVA 11 We compare the amount of variability explained by the model (experiment), to the error in the model (individual differences) This ratio is called the F-ratio. If the model explains a lot more variability than it can t explain, then the experimental manipulation has had a significant effect on the outcome (DV).


12 Theory of ANOVA 12 If the experiment is successful, then the model will explain more variance than it can t MS M will be greater than MS R
13 End of Lecture November 8, 2012
14 Objectives 14 Basic principles of ANOVA Equations underlying one-way ANOVA Doing a one-way ANOVA in R Following up an ANOVA: Planned contrasts/comparisons n Choosing contrasts n Coding contrasts Post hoc tests ANOVA as regression
15 Example (Two Means) 15 X 2 1 X X 1 X 2 Mean Std Dev X G s 1 s 2
16 Reinterpreting the 2-Sample t-statistic 16 t 2 = n ( X ) 2 1 X2 2 s 2 p 2 2 The denominator sp is an estimate of the variance σ of the population, derived by averaging the variances within the two samples: sp = ( s1 + s2 ) 2
17 Reinterpreting the 2-Sample t-statistic 17 t 2 = n ( X ) 2 1 X2 2 s 2 p 2 The numerator is also an estimate of the variance σ of the population, derived from the variance betwe en the sample means. s To see this, recall that s X = s = ns n 2 2 X For 2 groups, s 2 X = ((X 1 X G ) 2 + (X 2 X G ) 2 ), where X G = 1 2 (X + X ) 1 2 NB : Only 1 df in calculation of s X. Thus, s 2 X = X (X + X ) 1 2 = 1 2 (X X ) X (X + X ) (X X ) = 1 2 (X 1 X 2 )2
18 The F Distribution 18 F = t 2 = ( n X X 1 2) s p Thus, under the null hypothesis, the numerator and denominator are 2 independent estimates of the same population variance σ. The ratio of 2 independent, unbiased estimates of the same variance foll ows an F distribution F distribution for 2 groups of size n=13 p(f) F
19 Within and Between Variances 19 Recall that the variance is, by definition, the mean squared deviation of scores from their mean. Since the numerator of the F statistic estimates the variance from the deviations of group means, it is sometimes called the mean-square-between estimate. Since this estimate will include the effect of the independent variable (if any), it is also called the model mean-square MS M. Since the denominator of the F statistic estimates the variance from the deviations within groups, it is sometimes called the mean-square-within estimate. Since this deviation should only reflect the unmodeled noise (residual) it is also called the residual mean-square MS R. Thus F = MS M MS R
20 Generalizing to > 2 Groups 20 F = MS M MS R MS M = n i (X i X G ) 2, where X df G = 1 X M N i = 1 n T all scores N i X i T MS R = (n i 1)s i 2 df R
21 Sums of Squares Approach 21 F = MS M MS R MS M = SS M, where SS df M = n i (X i X G ) 2 M MS R = SS R, where SS df R = (n i 1)s i R 2 NB : SS T = SS M + SS R MS T MS M + MS R
22 Degrees of Freedom 22 The sample variance follows a scaled chi-square distribution, parameterized by the degrees of freedom. Thus the F distribution is a ratio of two chi-square distributions, each with different degrees of freedom. df M = k 1, where k = number of groups. df R = N T k, where N T = total number of subjects over all groups. = n i 1 i ( ) df T = df M + df R = N T 1
23 Properties of the F Distribution 23 Domain strictly non-negative Positively skewed k = 3 n=2 n=5 n=10 n=100 µ = df R df R 2 Tail becomes lighter as df R k = 10 n=2 n=5 n=10 n= Distribution Normal as df R,df M
24 The F Statistic 24 When H 0 is true (X 1 = X 2 = = X k ) we expect F 1. What do we expect when H is false? 0 F = MS M MS R MS M = n i (X i X G ) 2, where X df G = 1 X M N i = 1 n T all scores N i X i T MS R = (n i 1)s i 2 df R
25 Testing Hypotheses 25 F = MS M MS R Large values of F suggest that differences between the groups are inflating the MS M estimate of σ 2 reject H F distribution for 3 groups of size n=13 p(f) F crit 3.32 for α =.05
26 Interpreting the F Ratio 26 estimate of treatment effect + between-group estimate of error variance F = within-group estimate of error variance
27 Example 27 Testing the effects of Viagra on libido using three groups: Placebo (sugar pill) Low dose viagra High dose viagra The outcome/dependent variable (DV) was an objective measure of libido.

28 The Data 28
29 29 Summary Table Source SS df MS F Model * Residual Total
30 Objectives 30 Basic principles of ANOVA Equations underlying one-way ANOVA Doing a one-way ANOVA in R Following up an ANOVA: Planned contrasts/comparisons n Choosing contrasts n Coding contrasts Post hoc tests ANOVA as regression
31 One-Way ANOVA using R 31 When the Test Assumptions Are Met: Using lm(): viagramodel<-lm(libido~dose, data = viagradata) Using aov(): viagramodel<-aov(libido ~ dose, data = viagradata) summary(viagramodel)
32 Using lm() for ANOVAs 32 viagramodel<-lm(libido~dose, data = viagradata) Be careful that the independent variable is coded as a factor! If it is interpreted as a number, lm() will do a linear regression. By default we get contrasts of the second to last levels against the first level. For this experiment, this contrasts the low and high doses against the placebo.
33 ANOVA Assumptions 33 Independent random sampling Normal distributions Homogeneity of variance
34 34 Levene s Test for Homogeneity of Variance 1. Replace each score X, X,... with its absolute deviation from the sample mean: d 1i = X 1i X 1 d 2i = X 2i X 2 1i 2i 2. Now run an analysis of variance on d, d,...: F = MS M MS R 1i 2i MS M = SS M, where SS df M = n i (d i d G ) 2 M MS R = SS R 2, where SS df R = (n i 1)s di R
35 When variances are not equal across groups 35 If Levene s test is significant then it is unlikely that variances are homogeneous. Recall that when doing t-tests on a pair of means we applied the Welch-Sattertwhaite approximation to account for unequal variances. We can apply a comparable approximation for ANOVA by executing: oneway.test(libido ~ dose, data = viagradata)
36 Objectives 36 Basic principles of ANOVA Equations underlying one-way ANOVA Doing a one-way ANOVA in R Following up an ANOVA: Planned contrasts/comparisons n Choosing contrasts n Coding contrasts Post hoc tests ANOVA as regression
37 Why Use Follow-Up Tests? 37 The F-ratio tells us only that there is some effect of the IV. i.e. group means were different It does not tell us specifically which group means differ from which. We need additional tests to find out where the group differences lie.
38 How? 38 Orthogonal contrasts/comparisons Hypothesis driven Planned a priori Post hoc tests Not planned (no hypothesis) Compare all pairs of means
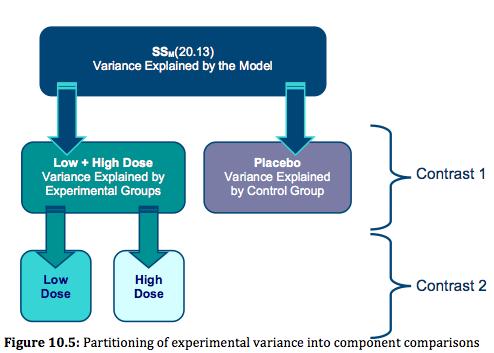
39 Planned Contrasts 39 Basic idea: The variability explained by the model (experimental manipulation, SS M ) is due to participants being assigned to different groups. This variability can be broken down further to test specific hypotheses about which groups might differ. We break down the variance according to hypotheses made a priori (before the experiment).
40 40 Rules When Choosing Contrasts Independent Contrasts must not interfere with each other (they must test unique hypotheses). Only two chunks Each contrast should compare only two chunks of variation. K 1 You should always end up with one less contrast than the number of groups.
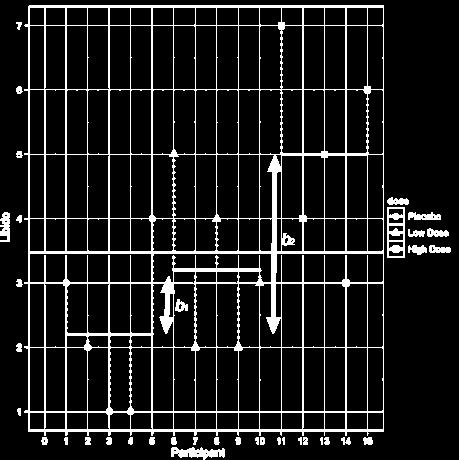
41 Generating Hypotheses 41 Example: Testing the effects of Viagra on libido using three groups: Placebo (sugar pill) Low dose viagra High dose viagra Dependent variable (DV) was an objective measure of libido. Intuitively, what might we expect to happen?
42 Placebo Low Dose High Dose Mean
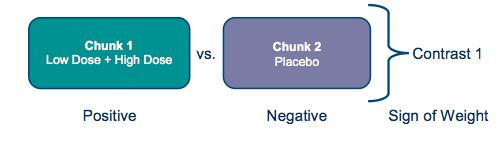
43 How do I Choose Contrasts? 43 Big hint: In most experiments we usually have one or more control groups. The logic of control groups dictates that we expect them to be different from groups that we ve manipulated. The first contrast will typically be to compare any control groups (chunk 1) with any experimental conditions (chunk 2).
44 Hypotheses 44 Hypothesis 1: People who take Viagra will have a higher libido than those who don t. Placebo < (Low, High) Hypothesis 2: People taking a high dose of Viagra will have a greater libido than those taking a low dose. Low < High
45 Planned Comparisons 45

46 Another Example 46
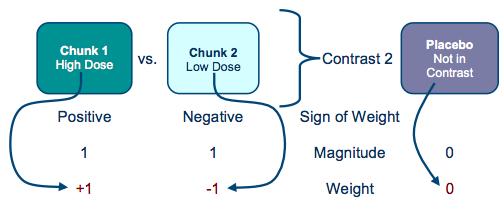
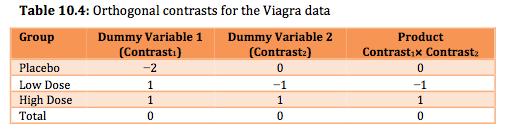
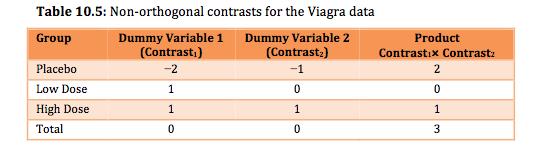
47 Coding Planned Contrasts: Rules 47 Rule 1 Groups coded with positive weights compared to groups coded with negative weights. Rule 2 The sum of the positive weights should equal the sum of the negative weights. Rule 3 If a group is not involved in a comparison, assign it a weight of zero. Rule 4 If a group is singled out in a comparison, then that group should not be used in any subsequent contrasts. Note: Ignore rules in textbook.
48
49
50 Orthogonal Contrasts 50 Two contrasts are said to be orthogonal when the sum of the products of the weights for the two contrasts is 0.
51
52 Orthogonality and Type I Errors 52 If two contrasts are not orthogonal, whether you commit a Type I error on the first may be correlated with whether you commit a Type I error on the second. If the two contrasts are orthogonal, these two events should be uncorrelated. In either case, one still has inflation of experiment-wise Type I error. Despite this, many publications allow reporting of planned orthogonal contrasts without correction for multiple comparisons.
53 Planned Contrasts using R 53 To do planned comparisons in R we have to set the contrast attribute of our grouping variable using the contrast() function and then recreate our ANOVA model using viagramodel <- aov(libido~dose, data=viagradata) summary.lm(viagramodel) or viagramodel <- lm(libido~dose, data=viagradata) summary(viagramodel)
54 Objectives 54 Basic principles of ANOVA Equations underlying one-way ANOVA Doing a one-way ANOVA in R Following up an ANOVA: Planned contrasts/comparisons n Choosing contrasts n Coding contrasts Post hoc tests ANOVA as regression
55 Post Hoc Tests 55 Post-hoc tests are tests you decide to do after the data are collected and examined. Since you have already seen the data, regardless of how many tests you are interested in you must correct as though you are interested in all possible pairwise tests. How you conduct post hoc tests in R depends on which test you d like to do. Bonferroni can be done using the pairwise.t.test() function, which is part of the R base system. Tukey can be done using the glht() function in the multcomp() package.
56 56 Bonferroni-Dunn Test 56 For a given number of comparisons j the experiment-wise alpha will never be more than j times the per-comparison alpha. α jα EW PC set α PC = α EW j Experimentwise alpha j=5 j α PC α 0.7 EW = alpha (per comparison) ( α) j
57 Tukey s Honestly Significant Difference 57 Key Idea: Given k groups, consider the smallest and largest means. Ensure protection against Type I error when comparing these two means. This is guaranteed to protect against Type I error for all pairs. Treatment Group n Mean A B C D
58 Tukey 58 For the Viagra data, we can obtain Tukey post hoc tests by executing: posthocs<-glht(viagramodel, linfct = mcp(dose = "Tukey")) summary(posthocs) confint(posthocs)
59 Output 59
60 Which Posthoc Test To Use 60 When doing a full set of post-hoc tests, Tukey is usually more powerful than Bonferroni. However, when doing a small number of planned comparisons, Bonferroni can be more powerful. Also, Tukey s assumptions can fail if the sample sizes are very different use Bonferroni in this case.
61 Objectives 61 Basic principles of ANOVA Equations underlying one-way ANOVA Doing a one-way ANOVA in R Following up an ANOVA: Planned contrasts/comparisons n Choosing contrasts n Coding contrasts Post hoc tests ANOVA as regression
62 ANOVA as Regression 62 ( ) outcome = model + error i libido = b + b high + blow + ε i 0 2 i 1 i i i

63 The Data 63
64 Placebo Group 64 libido = b + b high + blow + ε ( ) ( ) libido = b + b 0 + b 0 libido X i 0 2 i 1 i i i i = = b b placebo 0
65 High Dose Group 65 libido = b + b high + blow + ε i 0 2 i 1 i i ( ) ( ) libido = b + b 1 + b 0 libido i i = b + b 0 2 libido = b + b i 0 2 X = X + b high placebo 2 b = X X 2 high placebo
66 Low Dose Group 66 libido = b + b high + blow + ε i 0 2 i 1 i i ( ) ( ) libido = b + b 0 + b 1 i libido i = b + b 0 1 libido = b + b i 0 1 X = X + b Low placebo 1 b = X X 1 low placebo

67 Output from Regression 67
68 Experiments vs. Correlation 68 ANOVA in linear regression (continuous IV): Used to assess whether the linear regression model is good at predicting an outcome. Remember that the model assumes that the DV is a linear function of the IV. ANOVA in testing means (discrete IV): Used to see whether different levels of the IV lead to differences in an outcome variable (DV). There is no assumption with regard to linearity of the DV as a function of the IV.
Comparing Several Means: ANOVA
 Comparing Several Means: ANOVA Understand the basic principles of ANOVA Why it is done? What it tells us? Theory of one way independent ANOVA Following up an ANOVA: Planned contrasts/comparisons Choosing
8/23/2018. One-Way ANOVA F-test. 1. Situation/hypotheses. 2. Test statistic. 3.Distribution. 4. Assumptions
 PSY 5101: Advanced Statistics for Psychological and Behavioral Research 1 1. Situation/hypotheses 2. Test statistic One-Way ANOVA F-test One factor J>2 independent samples H o :µ 1 µ 2 µ J F 3.Distribution
Multiple t Tests. Introduction to Analysis of Variance. Experiments with More than 2 Conditions
 Introduction to Analysis of Variance 1 Experiments with More than 2 Conditions Often the research that psychologists perform has more conditions than just the control and experimental conditions You might
Introduction to the Analysis of Variance (ANOVA) Computing One-Way Independent Measures (Between Subjects) ANOVAs
 Computing One-Way Independent Measures (Between Subjects) ANOVAs") Introduction to the Analysis of Variance (ANOVA) Computing One-Way Independent Measures (Between Subjects) ANOVAs The Analysis of Variance (ANOVA) The analysis of variance (ANOVA) is a statistical technique
Introduction to the Analysis of Variance (ANOVA) Computing One-Way Independent Measures (Between Subjects) ANOVAs The Analysis of Variance (ANOVA) The analysis of variance (ANOVA) is a statistical technique
The One-Way Independent-Samples ANOVA. (For Between-Subjects Designs)
") The One-Way Independent-Samples ANOVA (For Between-Subjects Designs) Computations for the ANOVA In computing the terms required for the F-statistic, we won t explicitly compute any sample variances or
The One-Way Independent-Samples ANOVA (For Between-Subjects Designs) Computations for the ANOVA In computing the terms required for the F-statistic, we won t explicitly compute any sample variances or
Extensions of One-Way ANOVA.
 Extensions of One-Way ANOVA http://www.pelagicos.net/classes_biometry_fa18.htm What do I want You to Know What are two main limitations of ANOVA? What two approaches can follow a significant ANOVA? How
Extensions of One-Way ANOVA.
 Extensions of One-Way ANOVA http://www.pelagicos.net/classes_biometry_fa17.htm What do I want You to Know What are two main limitations of ANOVA? What two approaches can follow a significant ANOVA? How
Multiple Comparison Procedures Cohen Chapter 13. For EDUC/PSY 6600
 Multiple Comparison Procedures Cohen Chapter 13 For EDUC/PSY 6600 1 We have to go to the deductions and the inferences, said Lestrade, winking at me. I find it hard enough to tackle facts, Holmes, without
Introduction to the Analysis of Variance (ANOVA)
") Introduction to the Analysis of Variance (ANOVA) The Analysis of Variance (ANOVA) The analysis of variance (ANOVA) is a statistical technique for testing for differences between the means of multiple (more
Introduction to the Analysis of Variance (ANOVA) The Analysis of Variance (ANOVA) The analysis of variance (ANOVA) is a statistical technique for testing for differences between the means of multiple (more
Multiple Comparisons
 Multiple Comparisons Error Rates, A Priori Tests, and Post-Hoc Tests Multiple Comparisons: A Rationale Multiple comparison tests function to tease apart differences between the groups within our IV when
One-way between-subjects ANOVA. Comparing three or more independent means
 One-way between-subjects ANOVA Comparing three or more independent means Data files SpiderBG.sav Attractiveness.sav Homework: sourcesofself-esteem.sav ANOVA: A Framework Understand the basic principles
One-way between-subjects ANOVA. Comparing three or more independent means
 One-way between-subjects ANOVA Comparing three or more independent means ANOVA: A Framework Understand the basic principles of ANOVA Why it is done? What it tells us? Theory of one-way between-subjects
ANOVA. Testing more than 2 conditions
 ANOVA Testing more than 2 conditions ANOVA Today s goal: Teach you about ANOVA, the test used to measure the difference between more than two conditions Outline: - Why anova? - Contrasts and post-hoc tests
H0: Tested by k-grp ANOVA
 Pairwise Comparisons ANOVA for multiple condition designs Pairwise comparisons and RH Testing Alpha inflation & Correction LSD & HSD procedures Alpha estimation reconsidered H0: Tested by k-grp ANOVA Regardless
Hypothesis T e T sting w ith with O ne O One-Way - ANOV ANO A V Statistics Arlo Clark Foos -
 Hypothesis Testing with One-Way ANOVA Statistics Arlo Clark-Foos Conceptual Refresher 1. Standardized z distribution of scores and of means can be represented as percentile rankings. 2. t distribution
H0: Tested by k-grp ANOVA
 Analyses of K-Group Designs : Omnibus F, Pairwise Comparisons & Trend Analyses ANOVA for multiple condition designs Pairwise comparisons and RH Testing Alpha inflation & Correction LSD & HSD procedures
One-Way ANOVA Cohen Chapter 12 EDUC/PSY 6600
 One-Way ANOVA Cohen Chapter 1 EDUC/PSY 6600 1 It is easy to lie with statistics. It is hard to tell the truth without statistics. -Andrejs Dunkels Motivating examples Dr. Vito randomly assigns 30 individuals
10/31/2012. One-Way ANOVA F-test
 PSY 511: Advanced Statistics for Psychological and Behavioral Research 1 1. Situation/hypotheses 2. Test statistic 3.Distribution 4. Assumptions One-Way ANOVA F-test One factor J>2 independent samples
Chapter Seven: Multi-Sample Methods 1/52
 Chapter Seven: Multi-Sample Methods 1/52 7.1 Introduction 2/52 Introduction The independent samples t test and the independent samples Z test for a difference between proportions are designed to analyze
Analysis of Variance (ANOVA)
") Analysis of Variance (ANOVA) Two types of ANOVA tests: Independent measures and Repeated measures Comparing 2 means: X 1 = 20 t - test X 2 = 30 How can we Compare 3 means?: X 1 = 20 X 2 = 30 X 3 = 35 ANOVA
Analysis of Variance (ANOVA) Two types of ANOVA tests: Independent measures and Repeated measures Comparing 2 means: X 1 = 20 t - test X 2 = 30 How can we Compare 3 means?: X 1 = 20 X 2 = 30 X 3 = 35 ANOVA
BIOL Biometry LAB 6 - SINGLE FACTOR ANOVA and MULTIPLE COMPARISON PROCEDURES
 BIOL 458 - Biometry LAB 6 - SINGLE FACTOR ANOVA and MULTIPLE COMPARISON PROCEDURES PART 1: INTRODUCTION TO ANOVA Purpose of ANOVA Analysis of Variance (ANOVA) is an extremely useful statistical method
Review. One-way ANOVA, I. What s coming up. Multiple comparisons
 Review One-way ANOVA, I 9.07 /15/00 Earlier in this class, we talked about twosample z- and t-tests for the difference between two conditions of an independent variable Does a trial drug work better than
The One-Way Repeated-Measures ANOVA. (For Within-Subjects Designs)
") The One-Way Repeated-Measures ANOVA (For Within-Subjects Designs) Logic of the Repeated-Measures ANOVA The repeated-measures ANOVA extends the analysis of variance to research situations using repeated-measures
The One-Way Repeated-Measures ANOVA (For Within-Subjects Designs) Logic of the Repeated-Measures ANOVA The repeated-measures ANOVA extends the analysis of variance to research situations using repeated-measures
Sampling Distributions: Central Limit Theorem
 Review for Exam 2 Sampling Distributions: Central Limit Theorem Conceptually, we can break up the theorem into three parts: 1. The mean (µ M ) of a population of sample means (M) is equal to the mean (µ)
One-Way ANOVA Source Table J - 1 SS B / J - 1 MS B /MS W. Pairwise Post-Hoc Comparisons of Means
 One-Way ANOVA Source Table ANOVA MODEL: ij = µ* + α j + ε ij H 0 : µ 1 = µ =... = µ j or H 0 : Σα j = 0 Source Sum of Squares df Mean Squares F Between Groups n j ( j - * ) J - 1 SS B / J - 1 MS B /MS
The legacy of Sir Ronald A. Fisher. Fisher s three fundamental principles: local control, replication, and randomization.
 1 Chapter 1: Research Design Principles The legacy of Sir Ronald A. Fisher. Fisher s three fundamental principles: local control, replication, and randomization. 2 Chapter 2: Completely Randomized Design
Contrasts and Multiple Comparisons Supplement for Pages
 Contrasts and Multiple Comparisons Supplement for Pages 302-323 Brian Habing University of South Carolina Last Updated: July 20, 2001 The F-test from the ANOVA table allows us to test the null hypothesis
Specific Differences. Lukas Meier, Seminar für Statistik
 Specific Differences Lukas Meier, Seminar für Statistik Problem with Global F-test Problem: Global F-test (aka omnibus F-test) is very unspecific. Typically: Want a more precise answer (or have a more
PSYC 331 STATISTICS FOR PSYCHOLOGISTS
 PSYC 331 STATISTICS FOR PSYCHOLOGISTS Session 4 A PARAMETRIC STATISTICAL TEST FOR MORE THAN TWO POPULATIONS Lecturer: Dr. Paul Narh Doku, Dept of Psychology, UG Contact Information: pndoku@ug.edu.gh College
One-Way ANOVA. Some examples of when ANOVA would be appropriate include:
 One-Way ANOVA 1. Purpose Analysis of variance (ANOVA) is used when one wishes to determine whether two or more groups (e.g., classes A, B, and C) differ on some outcome of interest (e.g., an achievement
Your schedule of coming weeks. One-way ANOVA, II. Review from last time. Review from last time /22/2004. Create ANOVA table
 Your schedule of coming weeks One-way ANOVA, II 9.07 //00 Today: One-way ANOVA, part II Next week: Two-way ANOVA, parts I and II. One-way ANOVA HW due Thursday Week of May Teacher out of town all week
Preview from Notesale.co.uk Page 3 of 63
 Stem-and-leaf diagram - vertical numbers on far left represent the 10s, numbers right of the line represent the 1s The mean should not be used if there are extreme scores, or for ranks and categories Unbiased
Analysis of Variance: Part 1
 Analysis of Variance: Part 1 Oneway ANOVA When there are more than two means Each time two means are compared the probability (Type I error) =α. When there are more than two means Each time two means are
Chapter 13 Section D. F versus Q: Different Approaches to Controlling Type I Errors with Multiple Comparisons
 Explaining Psychological Statistics (2 nd Ed.) by Barry H. Cohen Chapter 13 Section D F versus Q: Different Approaches to Controlling Type I Errors with Multiple Comparisons In section B of this chapter,
Difference in two or more average scores in different groups
 ANOVAs Analysis of Variance (ANOVA) Difference in two or more average scores in different groups Each participant tested once Same outcome tested in each group Simplest is one-way ANOVA (one variable as
Hypothesis testing: Steps
 Review for Exam 2 Hypothesis testing: Steps Repeated-Measures ANOVA 1. Determine appropriate test and hypotheses 2. Use distribution table to find critical statistic value(s) representing rejection region
The t-test: A z-score for a sample mean tells us where in the distribution the particular mean lies
 The t-test: So Far: Sampling distribution benefit is that even if the original population is not normal, a sampling distribution based on this population will be normal (for sample size > 30). Benefit
ANOVA: Analysis of Variation
 ANOVA: Analysis of Variation The basic ANOVA situation Two variables: 1 Categorical, 1 Quantitative Main Question: Do the (means of) the quantitative variables depend on which group (given by categorical
ANALYTICAL COMPARISONS AMONG TREATMENT MEANS (CHAPTER 4)
") ANALYTICAL COMPARISONS AMONG TREATMENT MEANS (CHAPTER 4) ERSH 8310 Fall 2007 September 11, 2007 Today s Class The need for analytic comparisons. Planned comparisons. Comparisons among treatment means.
ANALYTICAL COMPARISONS AMONG TREATMENT MEANS (CHAPTER 4) ERSH 8310 Fall 2007 September 11, 2007 Today s Class The need for analytic comparisons. Planned comparisons. Comparisons among treatment means.
Calculating Fobt for all possible combinations of variances for each sample Calculating the probability of (F) for each different value of Fobt
 for each different value of Fobt") PSY 305 Module 5-A AVP Transcript During the past two modules, you have been introduced to inferential statistics. We have spent time on z-tests and the three types of t-tests. We are now ready to move
PSY 305 Module 5-A AVP Transcript During the past two modules, you have been introduced to inferential statistics. We have spent time on z-tests and the three types of t-tests. We are now ready to move
Degrees of freedom df=1. Limitations OR in SPSS LIM: Knowing σ and µ is unlikely in large
 Z Test Comparing a group mean to a hypothesis T test (about 1 mean) T test (about 2 means) Comparing mean to sample mean. Similar means = will have same response to treatment Two unknown means are different
Analysis of variance
 Analysis of variance 1 Method If the null hypothesis is true, then the populations are the same: they are normal, and they have the same mean and the same variance. We will estimate the numerical value
An Old Research Question
 ANOVA An Old Research Question The impact of TV on high-school grade Watch or not watch Two groups The impact of TV hours on high-school grade Exactly how much TV watching would make difference Multiple
What Does the F-Ratio Tell Us?
 Planned Comparisons What Does the F-Ratio Tell Us? The F-ratio (called an omnibus or overall F) provides a test of whether or not there a treatment effects in an experiment A significant F-ratio suggests
Introduction to Analysis of Variance (ANOVA) Part 2
 Part 2") Introduction to Analysis of Variance (ANOVA) Part 2 Single factor Serpulid recruitment and biofilms Effect of biofilm type on number of recruiting serpulid worms in Port Phillip Bay Response variable:
Introduction to Analysis of Variance (ANOVA) Part 2 Single factor Serpulid recruitment and biofilms Effect of biofilm type on number of recruiting serpulid worms in Port Phillip Bay Response variable:
Business Statistics. Lecture 10: Course Review
 Business Statistics Lecture 10: Course Review 1 Descriptive Statistics for Continuous Data Numerical Summaries Location: mean, median Spread or variability: variance, standard deviation, range, percentiles,
Analysis of Variance
 Statistical Techniques II EXST7015 Analysis of Variance 15a_ANOVA_Introduction 1 Design The simplest model for Analysis of Variance (ANOVA) is the CRD, the Completely Randomized Design This model is also
Orthogonal, Planned and Unplanned Comparisons
 This is a chapter excerpt from Guilford Publications. Data Analysis for Experimental Design, by Richard Gonzalez Copyright 2008. 8 Orthogonal, Planned and Unplanned Comparisons 8.1 Introduction In this
N J SS W /df W N - 1
 One-Way ANOVA Source Table ANOVA MODEL: ij = µ* + α j + ε ij H 0 : µ = µ =... = µ j or H 0 : Σα j = 0 Source Sum of Squares df Mean Squares F J Between Groups nj( j * ) J - SS B /(J ) MS B /MS W = ( N
Inferences for Regression
 Inferences for Regression An Example: Body Fat and Waist Size Looking at the relationship between % body fat and waist size (in inches). Here is a scatterplot of our data set: Remembering Regression In
Independent Samples ANOVA
 Independent Samples ANOVA In this example students were randomly assigned to one of three mnemonics (techniques for improving memory) rehearsal (the control group; simply repeat the words), visual imagery
Introduction to Analysis of Variance. Chapter 11
 Introduction to Analysis of Variance Chapter 11 Review t-tests Single-sample t-test Independent samples t-test Related or paired-samples t-test s m M t ) ( 1 1 ) ( m m s M M t M D D D s M t n s s M 1 )
2 Hand-out 2. Dr. M. P. M. M. M c Loughlin Revised 2018
 Math 403 - P. & S. III - Dr. McLoughlin - 1 2018 2 Hand-out 2 Dr. M. P. M. M. M c Loughlin Revised 2018 3. Fundamentals 3.1. Preliminaries. Suppose we can produce a random sample of weights of 10 year-olds
ANCOVA. Psy 420 Andrew Ainsworth
 ANCOVA Psy 420 Andrew Ainsworth What is ANCOVA? Analysis of covariance an extension of ANOVA in which main effects and interactions are assessed on DV scores after the DV has been adjusted for by the DV
A posteriori multiple comparison tests
 A posteriori multiple comparison tests 11/15/16 1 Recall the Lakes experiment Source of variation SS DF MS F P Lakes 58.000 2 29.400 8.243 0.006 Error 42.800 12 3.567 Total 101.600 14 The ANOVA tells us
Linear Combinations of Group Means
 Linear Combinations of Group Means Look at the handicap example on p. 150 of the text. proc means data=mth567.disability; class handicap; var score; proc sort data=mth567.disability; by handicap; proc
Contrasts (in general)
") 10/1/015 6-09/749 Experimental Design for Behavioral and Social Sciences Contrasts (in general) Context: An ANOVA rejects the overall null hypothesis that all k means of some factor are not equal, i.e.,
10/1/015 6-09/749 Experimental Design for Behavioral and Social Sciences Contrasts (in general) Context: An ANOVA rejects the overall null hypothesis that all k means of some factor are not equal, i.e.,
B. Weaver (18-Oct-2006) MC Procedures Chapter 1: Multiple Comparison Procedures ) C (1.1)
 MC Procedures Chapter 1: Multiple Comparison Procedures ) C (1.1)") B. Weaver (18-Oct-2006) MC Procedures... 1 Chapter 1: Multiple Comparison Procedures 1.1 Introduction The omnibus F-test in a one-way ANOVA is a test of the null hypothesis that the population means of
B. Weaver (18-Oct-2006) MC Procedures... 1 Chapter 1: Multiple Comparison Procedures 1.1 Introduction The omnibus F-test in a one-way ANOVA is a test of the null hypothesis that the population means of
DESAIN EKSPERIMEN Analysis of Variances (ANOVA) Semester Genap 2017/2018 Jurusan Teknik Industri Universitas Brawijaya
 Semester Genap 2017/2018 Jurusan Teknik Industri Universitas Brawijaya") DESAIN EKSPERIMEN Analysis of Variances (ANOVA) Semester Jurusan Teknik Industri Universitas Brawijaya Outline Introduction The Analysis of Variance Models for the Data Post-ANOVA Comparison of Means Sample
DESAIN EKSPERIMEN Analysis of Variances (ANOVA) Semester Jurusan Teknik Industri Universitas Brawijaya Outline Introduction The Analysis of Variance Models for the Data Post-ANOVA Comparison of Means Sample
Hypothesis testing: Steps
 Review for Exam 2 Hypothesis testing: Steps Exam 2 Review 1. Determine appropriate test and hypotheses 2. Use distribution table to find critical statistic value(s) representing rejection region 3. Compute
CHAPTER 17 CHI-SQUARE AND OTHER NONPARAMETRIC TESTS FROM: PAGANO, R. R. (2007)
") FROM: PAGANO, R. R. (007) I. INTRODUCTION: DISTINCTION BETWEEN PARAMETRIC AND NON-PARAMETRIC TESTS Statistical inference tests are often classified as to whether they are parametric or nonparametric Parameter
FROM: PAGANO, R. R. (007) I. INTRODUCTION: DISTINCTION BETWEEN PARAMETRIC AND NON-PARAMETRIC TESTS Statistical inference tests are often classified as to whether they are parametric or nonparametric Parameter
Keppel, G. & Wickens, T. D. Design and Analysis Chapter 4: Analytical Comparisons Among Treatment Means
 Keppel, G. & Wickens, T. D. Design and Analysis Chapter 4: Analytical Comparisons Among Treatment Means 4.1 The Need for Analytical Comparisons...the between-groups sum of squares averages the differences
T.I.H.E. IT 233 Statistics and Probability: Sem. 1: 2013 ESTIMATION AND HYPOTHESIS TESTING OF TWO POPULATIONS
 ESTIMATION AND HYPOTHESIS TESTING OF TWO POPULATIONS In our work on hypothesis testing, we used the value of a sample statistic to challenge an accepted value of a population parameter. We focused only
Lectures 5 & 6: Hypothesis Testing
 Lectures 5 & 6: Hypothesis Testing in which you learn to apply the concept of statistical significance to OLS estimates, learn the concept of t values, how to use them in regression work and come across
ANOVA 3/12/2012. Two reasons for using ANOVA. Type I Error and Multiple Tests. Review Independent Samples t test
 // ANOVA Lectures - Readings: GW Review Independent Samples t test Placeo Treatment 7 7 7 Mean... Review Independent Samples t test Placeo Treatment 7 7 7 Mean.. t (). p. C. I.: p t tcrit s pt crit s t
Week 14 Comparing k(> 2) Populations
 Populations") Week 14 Comparing k(> 2) Populations Week 14 Objectives Methods associated with testing for the equality of k(> 2) means or proportions are presented. Post-testing concepts and analysis are introduced.
Week 14 Comparing k(> 2) Populations Week 14 Objectives Methods associated with testing for the equality of k(> 2) means or proportions are presented. Post-testing concepts and analysis are introduced.
Chapter 7 Factorial ANOVA: Two-way ANOVA
 Chapter 7 Factorial ANOVA: Two-way ANOVA Page Two-way ANOVA: Equal n. Examples 7-. Terminology 7-6 3. Understanding main effects 7- and interactions 4. Structural model 7-5 5. Variance partitioning 7-6.
Notes on Maxwell & Delaney
 Notes on Maxwell & Delaney PSCH 710 6 Chapter 6 - Trend Analysis Previously, we discussed how to use linear contrasts, or comparisons, to test specific hypotheses about differences among means. Those discussions
Analysis of Variance (ANOVA)
") Analysis of Variance (ANOVA) Used for comparing or more means an extension of the t test Independent Variable (factor) = categorical (qualita5ve) predictor should have at least levels, but can have many
Analysis of Variance (ANOVA) Used for comparing or more means an extension of the t test Independent Variable (factor) = categorical (qualita5ve) predictor should have at least levels, but can have many
Review of Statistics 101
 Review of Statistics 101 We review some important themes from the course 1. Introduction Statistics- Set of methods for collecting/analyzing data (the art and science of learning from data). Provides methods
Stats fest Analysis of variance. Single factor ANOVA. Aims. Single factor ANOVA. Data
 1 Stats fest 2007 Analysis of variance murray.logan@sci.monash.edu.au Single factor ANOVA 2 Aims Description Investigate differences between population means Explanation How much of the variation in response
4.1. Introduction: Comparing Means
 4. Analysis of Variance (ANOVA) 4.1. Introduction: Comparing Means Consider the problem of testing H 0 : µ 1 = µ 2 against H 1 : µ 1 µ 2 in two independent samples of two different populations of possibly
Keppel, G. & Wickens, T. D. Design and Analysis Chapter 12: Detailed Analyses of Main Effects and Simple Effects
 Keppel, G. & Wickens, T. D. Design and Analysis Chapter 1: Detailed Analyses of Main Effects and Simple Effects If the interaction is significant, then less attention is paid to the two main effects, and
INTERVAL ESTIMATION AND HYPOTHESES TESTING
 INTERVAL ESTIMATION AND HYPOTHESES TESTING 1. IDEA An interval rather than a point estimate is often of interest. Confidence intervals are thus important in empirical work. To construct interval estimates,
Advanced Experimental Design
 Advanced Experimental Design Topic Four Hypothesis testing (z and t tests) & Power Agenda Hypothesis testing Sampling distributions/central limit theorem z test (σ known) One sample z & Confidence intervals
Analysis of Variance and Contrasts
 Analysis of Variance and Contrasts Ken Kelley s Class Notes 1 / 103 Lesson Breakdown by Topic 1 Goal of Analysis of Variance A Conceptual Example Appropriate for ANOVA Example F -Test for Independent Variances
Multiple Testing. Gary W. Oehlert. January 28, School of Statistics University of Minnesota
 Multiple Testing Gary W. Oehlert School of Statistics University of Minnesota January 28, 2016 Background Suppose that you had a 20-sided die. Nineteen of the sides are labeled 0 and one of the sides is
An Analysis of College Algebra Exam Scores December 14, James D Jones Math Section 01
 An Analysis of College Algebra Exam s December, 000 James D Jones Math - Section 0 An Analysis of College Algebra Exam s Introduction Students often complain about a test being too difficult. Are there
9 One-Way Analysis of Variance
 9 One-Way Analysis of Variance SW Chapter 11 - all sections except 6. The one-way analysis of variance (ANOVA) is a generalization of the two sample t test to k 2 groups. Assume that the populations of
4:3 LEC - PLANNED COMPARISONS AND REGRESSION ANALYSES
 4:3 LEC - PLANNED COMPARISONS AND REGRESSION ANALYSES FOR SINGLE FACTOR BETWEEN-S DESIGNS Planned or A Priori Comparisons We previously showed various ways to test all possible pairwise comparisons for
PLSC PRACTICE TEST ONE
 PLSC 724 - PRACTICE TEST ONE 1. Discuss briefly the relationship between the shape of the normal curve and the variance. 2. What is the relationship between a statistic and a parameter? 3. How is the α
Using SPSS for One Way Analysis of Variance
 Using SPSS for One Way Analysis of Variance This tutorial will show you how to use SPSS version 12 to perform a one-way, between- subjects analysis of variance and related post-hoc tests. This tutorial
DESIGNING EXPERIMENTS AND ANALYZING DATA A Model Comparison Perspective
 DESIGNING EXPERIMENTS AND ANALYZING DATA A Model Comparison Perspective Second Edition Scott E. Maxwell Uniuersity of Notre Dame Harold D. Delaney Uniuersity of New Mexico J,t{,.?; LAWRENCE ERLBAUM ASSOCIATES,
These are all actually contrasts (the coef sum to zero). What are these contrasts representing? What would make them large?
. What are these contrasts representing? What would make them large?") Lecture 12 Comparing treatment effects Orthogonal Contrasts What use are contrasts? Recall the Cotton data In this case, the treatment levels have an ordering to them this is not always the case) Consider
Lecture 12 Comparing treatment effects Orthogonal Contrasts What use are contrasts? Recall the Cotton data In this case, the treatment levels have an ordering to them this is not always the case) Consider
DETAILED CONTENTS PART I INTRODUCTION AND DESCRIPTIVE STATISTICS. 1. Introduction to Statistics
 DETAILED CONTENTS About the Author Preface to the Instructor To the Student How to Use SPSS With This Book PART I INTRODUCTION AND DESCRIPTIVE STATISTICS 1. Introduction to Statistics 1.1 Descriptive and
Comparisons among means (or, the analysis of factor effects)
") Comparisons among means (or, the analysis of factor effects) In carrying out our usual test that μ 1 = = μ r, we might be content to just reject this omnibus hypothesis but typically more is required:
Comparisons among means (or, the analysis of factor effects) In carrying out our usual test that μ 1 = = μ r, we might be content to just reject this omnibus hypothesis but typically more is required:
In a one-way ANOVA, the total sums of squares among observations is partitioned into two components: Sums of squares represent:
 Activity #10: AxS ANOVA (Repeated subjects design) Resources: optimism.sav So far in MATH 300 and 301, we have studied the following hypothesis testing procedures: 1) Binomial test, sign-test, Fisher s
Statistical methods for comparing multiple groups. Lecture 7: ANOVA. ANOVA: Definition. ANOVA: Concepts
 Statistical methods for comparing multiple groups Lecture 7: ANOVA Sandy Eckel seckel@jhsph.edu 30 April 2008 Continuous data: comparing multiple means Analysis of variance Binary data: comparing multiple
CIVL /8904 T R A F F I C F L O W T H E O R Y L E C T U R E - 8
 CIVL - 7904/8904 T R A F F I C F L O W T H E O R Y L E C T U R E - 8 Chi-square Test How to determine the interval from a continuous distribution I = Range 1 + 3.322(logN) I-> Range of the class interval
Introduction to Business Statistics QM 220 Chapter 12
 Department of Quantitative Methods & Information Systems Introduction to Business Statistics QM 220 Chapter 12 Dr. Mohammad Zainal 12.1 The F distribution We already covered this topic in Ch. 10 QM-220,
Regression With a Categorical Independent Variable: Mean Comparisons
 Regression With a Categorical Independent Variable: Mean Lecture 16 March 29, 2005 Applied Regression Analysis Lecture #16-3/29/2005 Slide 1 of 43 Today s Lecture comparisons among means. Today s Lecture
The goodness-of-fit test Having discussed how to make comparisons between two proportions, we now consider comparisons of multiple proportions.
 The goodness-of-fit test Having discussed how to make comparisons between two proportions, we now consider comparisons of multiple proportions. A common problem of this type is concerned with determining
In ANOVA the response variable is numerical and the explanatory variables are categorical.
 1 ANOVA ANOVA means ANalysis Of VAriance. The ANOVA is a tool for studying the influence of one or more qualitative variables on the mean of a numerical variable in a population. In ANOVA the response
Analysis of Variance: Repeated measures
 Repeated-Measures ANOVA: Analysis of Variance: Repeated measures Each subject participates in all conditions in the experiment (which is why it is called repeated measures). A repeated-measures ANOVA is
One-Way Analysis of Variance: ANOVA
 One-Way Analysis of Variance: ANOVA Dr. J. Kyle Roberts Southern Methodist University Simmons School of Education and Human Development Department of Teaching and Learning Background to ANOVA Recall from
Hypothesis testing I. - In particular, we are talking about statistical hypotheses. [get everyone s finger length!] n =
![Hypothesis testing I. - In particular, we are talking about statistical hypotheses. [get everyone s finger length!] n =](/thumbs/86/94764601.jpg "Hypothesis testing I. - In particular, we are talking about statistical hypotheses. [get everyone s finger length!] n =") Hypothesis testing I I. What is hypothesis testing? [Note we re temporarily bouncing around in the book a lot! Things will settle down again in a week or so] - Exactly what it says. We develop a hypothesis,
Hypothesis testing I I. What is hypothesis testing? [Note we re temporarily bouncing around in the book a lot! Things will settle down again in a week or so] - Exactly what it says. We develop a hypothesis,
Inverse-variance Weighted Average
 Fixed Effects Meta-Analysisand Homogeneity Evaluation Jeff Valentine University of Louisville Campbell Collaboration Annual Colloquium Oslo 2009 Inverse-variance Weighted Average All effect sizes are not
22s:152 Applied Linear Regression. Chapter 8: 1-Way Analysis of Variance (ANOVA) 2-Way Analysis of Variance (ANOVA)
 2-Way Analysis of Variance (ANOVA)") 22s:152 Applied Linear Regression Chapter 8: 1-Way Analysis of Variance (ANOVA) 2-Way Analysis of Variance (ANOVA) We now consider an analysis with only categorical predictors (i.e. all predictors are
22s:152 Applied Linear Regression Chapter 8: 1-Way Analysis of Variance (ANOVA) 2-Way Analysis of Variance (ANOVA) We now consider an analysis with only categorical predictors (i.e. all predictors are
Chapter 6 Planned Contrasts and Post-hoc Tests for one-way ANOVA
 Chapter 6 Planned Contrasts and Post-hoc Tests for one-way NOV Page. The Problem of Multiple Comparisons 6-. Types of Type Error Rates 6-. Planned contrasts vs. Post hoc Contrasts 6-7 4. Planned Contrasts
16.400/453J Human Factors Engineering. Design of Experiments II
 J Human Factors Engineering Design of Experiments II Review Experiment Design and Descriptive Statistics Research question, independent and dependent variables, histograms, box plots, etc. Inferential