Nonparametric statistic methods. Waraphon Phimpraphai DVM, PhD Department of Veterinary Public Health
|
|
|
- Juliet Wood
- 5 years ago
- Views:
Transcription


1 Nonparametric statistic methods Waraphon Phimpraphai DVM, PhD Department of Veterinary Public Health
2 Measurement What are the 4 levels of measurement discussed? 1. Nominal or Classificatory Scale Gender, ethnic background 2. Ordinal or Ranking Scale Hardness of rocks, beauty, military ranks 3. Interval Scale Celsius or Fahrenheit 4. Ratio Scale speed, height, mass or weight
3 Parametric Assumptions The observations must be independent The observations must be drawn from normally distributed populations These populations must have the same variances
4 Introduction The theory upon which the twosample T-test is based requires that the two sampled populations be normal and have equal variances. Many other common statistical procedures have similar assumptions.
5 Introduction A large body of statistical methods is available that comprises procedures that not requiring the estimation of the population variance and mean and not stating hypothesis about parameters. These testing procedures are termed non-parametric tests
6 Introduction Non parametric tests may be applied in any situation where we would be justified in employing a parametric test, such as the two-sample t test, as well as in instances when the assumptions of the latter are untenable.
7 Introduction If either the parametric or nonparametric approach is applicable, then the former will always be more powerful than the latter.
 high probability of violating the assumption of normality leads to spurious Type 1 (false alarm) errors Outlier more often leads to spurious")
8 Why use a non-parametric statistics? Very small samples (< 20 replicates) high probability of violating the assumption of normality leads to spurious Type 1 (false alarm) errors Outlier more often leads to spurious Type 1 errors in parametric statistics Non-parametric statistics reduce data to an ordinal rank, which reduce the impact or leverage of outlier
9 Error Type I error: False alarm for a bogus effect Reject the null hypothesis when it is really true Type II error: Miss a real effect Fail to reject the null hypothesis when it is really false Type III error ;) Lazy, incompetence, or willful ignorance of the truth
10 Nonparametric Assumptions Observations are independent Variable under study has underlying continuity
11 Nonparametric Methods There is at least one nonparametric test equivalent to a parametric test These tests fall into several categories Tests of differences between groups (independent samples) Tests of differences between variables (dependent samples) Tests of relationships between variables
12 Nonparametric Methods Sign Test Wilcoxon Signed-Rank Test Mann-Whitney-Wilcoxon Test Kruskal-Wallis Test Rank Correlation Adapted from JOHN S. LOUCKS St. Edward s University
13 Sign Test A common application of the sign test involves using a sample of n potential customers to identify a preference for one of two brands of a product. The objective is to determine whether there is a difference in preference between the two items being compared.
14 Sign Test To record the preference data, we use a plus sign if the individual prefers one brand and a minus sign if the individual prefers the other brand. Because the data are recorded as plus and minus signs, this test is called the sign test.
15 Example: Hand Cream Test Sign Test: Large-Sample Case o As part of a market research study, a sample of 36 consumers were asked to taste two brands of hand cream and indicate a preference o Do the data shown below indicate a significant difference in the consumer preferences for the two brands?
16 Example: Hand cream Test 18 preferred L Occitane (+ sign recorded) 12 preferred Bath & Body ( _ sign recorded) 6 had no preference The analysis is based on a sample size of = 30 Hypotheses H 0 : No preference for one brand over the other exists H a : A preference for one brand over the other exists
17 Example: Hand cream Test Rejection Rule Using 0.05 level of significance, Reject H 0 if z < or z > 1.96 Test Statistic z = (18-15)/2.74 = 3/2.74 = Conclusion Do not reject H 0. There is insufficient evidence in the sample to conclude that a difference in preference exists for the two brands of hand cream. Fewer than 10 or more than 20 individuals would have to have a preference for a particular brand in order for us to reject H 0.
18 Wilcoxon Signed-Rank Test The methodology of the parametric matched-sample analysis requires: interval data, and the assumption that the population of differences between the pairs of observations is normally distributed If the assumption of normally distributed differences is not appropriate, the Wilcoxon signed-rank test can be used.
19 Wilcoxon Signed-Rank Test Preliminary Steps of the Test Compute the differences between the paired observations Discard any differences of zero Rank the absolute value of the differences from lowest to highest Tied differences are assigned the average ranking of their positions Give the ranks the sign of the original difference in the data Sum the signed ranks... next determine whether the sum is significantly different from zero
20 Example: Express Deliveries Wilcoxon Signed-Rank Test A huge animal hospital has decided to select one of two express delivery services. To test the delivery times of the two services, the Vet sends two reports to a sample of 10 district animal clinics, with one report carried by one service and the other report carried by the second service. Do the data (delivery times in hours) indicate a difference in the two services?
21 Example: Express Deliveries District clinic Overnight NiteFlite Seattle 32 hrs. 25 hrs. Los Angeles Boston Cleveland New York Houston Atlanta St. Louis 10 8 Milwaukee 7 9 Denver 16 11
22 Example: Express Deliveries District clinic Differ Diff Rank Sign Rank Seattle Los Angeles Boston Cleveland New York Houston Atlanta St. Louis Milwaukee Denver
23 Example: Express Deliveries Hypotheses H 0 : The delivery times of the two services are the same; neither offers faster service than the other H a : Delivery times differ between the two services; recommend the one with the smaller times
24 Example: Express Deliveries Rejection Rule Using 0.05 level of significance, Reject H 0 if z < or z > 1.96 Test Statistic z = (T - T )/ T = (44-0)/19.62 = 2.24 Conclusion Reject H 0. There is sufficient evidence in the sample to conclude that a difference exists in the delivery times provided by the two services. Recommend using the NiteFlite service
25 Kruskal-Wallis Test The MWN test can be used to test whether two populations are identical The MWW test has been extended by Kruskal and Wallis for cases of three or more populations The Kruskal-Wallis test can be used with ordinal data, interval or ratio data Not require the assumption of normally distributed populations The hypotheses are: H 0 : All populations are identical H a : Not all populations are identical
26 Mann-Whitney U Test
27 Two-sample rank test Although nonparametric procedures have been proposed for testing differences between the dispersion, or variability, of two populations, none has achieved widespread acceptance.
28 Differences between independent groups Two samples compare mean value for some variable of interest Parametric test T-test for independent samples Non-parametric test Wald-Wolfowitz runs test Mann-Whitney U test Kolmogorov-Smirnov two sample test
29 Mann-Whitney U Test For this test, as for many other nonparametric procedures, the actual measurements are not employed, but use instead the ranks of the measurements. The data may be ranked either from the highest to lowest or from the lowest to the highest values.
30 Mann-Whitney U Test Nonparametric alternative to twosample t-test Actual measurements not used ranks of the measurements used Data can be ranked from highest to lowest or lowest to highest values Calculate Mann-Whitney U statistic (for one sided) U = n 1 n 2 + n 1 (n 1 +1) R 1 2
31 Mann-Whitney U Test Calculate Mann-Whitney U statistic (two sided) U = n1n2+n1(n1+1) R1 U'= n1n2-u 2 n1 and n2 are the number of observations in Sample one and two R1 is the sum of the ranks of the observations in Sample one
32 Mann-Whitney U Test Calculate Mann-Whitney U statistic (two sided) U'= n2n1+n2(n2+1) R2 U= n1n2-u' 2 n1 and n2 are the number of observations in Sample one and two R2 is the sum of the ranks of the observations in Sample two
33 Example of Mann-Whitney U test Two tailed null hypothesis that there is no difference between the heights of male and female students Ho: Male and female students are the same height HA: Male and female students are not the same height
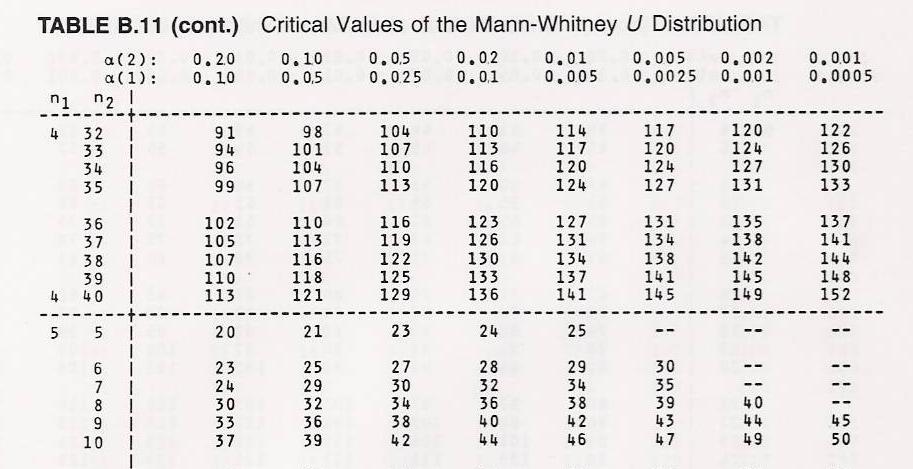
34 Example 1 U 0.05(2),7,5 = U 0.05(2),5,7 = 30 As 33 > 30, Ho is rejected U = n1n2 + n1(n1+1) R < P (U >= 33 or U =< 2) < 0.02 U=(7)(5) + (7)(8) 30 2 U = Heights of males (cm) Heights of females (cm) Ranks of male heights Ranks of female heights U = 33 U = n1n2 U U = (7)(5) 33 U = n 1 = 7 n 2 = 5 R 1 = 30 R 2 = 48
35
36 Calculation for z-statistics E(U) = (n1n2)/2 =(7*5)/2=17.5 S(U) = n1n2(n1+n2+1)/12 = 7*5*(7+5+1)/12 = 6.16 z = [U-E(U)]/S(U) = [(2-17.5)/6.16 =
37 Rejection Rule Using 0.05 level of significance, Reject H 0 if z < or z > 1.96 Conclusion Can reject H 0. There is significantly difference between the heights of male and female students..
38 Example of Mann-Whitney U test Ho: The performance of students is the same under the two teaching assistants Ha: Students do not perform equally well under the two teaching assistants = 0.05
39 Teaching Assistant A Teaching Assistant B Example 2 Grade A A Rank of grade Grade A A A B+ A- B+ B B B- C+ C C+ C C C- C B D C- D D D D- Rank of grade n 1 = 11 R 1 = n 2 = 14 R 2 =
40 Example 2 Teaching Assistant A Teaching Assistant B U = n 1 n 2 + n 1 (n 1 +1) R 1 2 U=(11)(14) + (11)(12) U = U = U = n 1 n 2 U U = (11)(14) U = 48.5 U 0.05(2),11,14 = 114 As < 114, accept H < P (U >105.5 or U =< 48.5) < 0.20 Grade Rank of grade Grade Rank of grade A 3 A 3 A 3 A 3 A 3 B+ 7.5 A- 6 B+ 7.5 B 10 B 10 B 10 B- 12 C C 16.5 C C 16.5 C 16.5 C C 16.5 D 22.5 C D 22.5 D 22.5 D 22.5 D- 25 n 1 = 11 R 1 =114.5 n 2 = 14 R 2 =210.5
41 Calculation for z-statistics E(U) = (n1n2)/2 = 77 S(U) = n1n2(n1+n2+1)/12 = z = [U-E(U)]/S(U) = [( )/18.27] = -1.56
42 Rejection Rule Using 0.05 level of significance, Reject H 0 if z < or z > 1.96 Conclusion Can not reject H 0. The performance of students is the same under the two teaching assistants.
43 Differences between independent groups Multiple groups Multiple groups Parametric Analysis of variance (ANOVA/ MANOVA) Nonparametric Kruskal-Wallis analysis of ranks Median test
44 Differences between dependent groups Compare two variables measured in the same sample If more than two variables are measured in same sample Parametric t-test for dependent samples Repeated measures ANOVA Nonparametric Sign test Wilcoxon s matched pairs test Friedman s two way analysis of variance Cochran Q
45 Relationships between variables Two variables of interest are categorical Parametric Correlation coefficient Nonparametric Spearman R Kendall Tau Coefficient Gamma Chi square Phi coefficient Fisher exact test Kendall coefficient of concordance
46 Summary Table of Statistical Tests Level of Measurement Sample Characteristics Correlation 1 Sample 2 Sample K Sample (i.e., >2) Independent Dependent Independent Dependent Categorical or Nominal Χ 2 or binomial Χ 2 Macnarmar s Χ 2 Χ 2 Cochran s Q Rank or Ordinal Mann Whitney U Wilcoxin Matched Pairs Signed Ranks Kruskal Wallis H Friendman s ANOVA Spearman s rho Parametric (Interval & Ratio) z test or t test t test between groups t test within groups 1 way ANOVA between groups 1 way ANOVA (within or repeated measure) Pearson s r Factorial (2 way) ANOVA
47 Advantages of Nonparametric Tests Probability statements obtained from most nonparametric statistics are exact probabilities, regardless of the shape of the population distribution from which the random sample was drawn If sample sizes as small as N=6 are used, there is no alternative to using a nonparametric test
48 Advantages of Nonparametric Tests Treat samples made up of observations from several different populations. Can treat data which are inherently in ranks as well as data whose seemingly numerical scores have the strength in ranks They are available to treat data which are classificatory Easier to learn and apply than parametric tests
49 Criticisms of Nonparametric Procedures Losing precision/wasteful of data Low power False sense of security Lack of software Testing distributions only Higher-ordered interactions not dealt with


50 A good tree will bear good fruits
Parametric versus Nonparametric Statistics-when to use them and which is more powerful? Dr Mahmoud Alhussami
 Parametric versus Nonparametric Statistics-when to use them and which is more powerful? Dr Mahmoud Alhussami Parametric Assumptions The observations must be independent. Dependent variable should be continuous
Textbook Examples of. SPSS Procedure
 Textbook s of IBM SPSS Procedures Each SPSS procedure listed below has its own section in the textbook. These sections include a purpose statement that describes the statistical test, identification of
NON-PARAMETRIC STATISTICS * (http://www.statsoft.com)
") NON-PARAMETRIC STATISTICS * (http://www.statsoft.com) 1. GENERAL PURPOSE 1.1 Brief review of the idea of significance testing To understand the idea of non-parametric statistics (the term non-parametric
NON-PARAMETRIC STATISTICS * (http://www.statsoft.com) 1. GENERAL PURPOSE 1.1 Brief review of the idea of significance testing To understand the idea of non-parametric statistics (the term non-parametric
Non-parametric methods
 Eastern Mediterranean University Faculty of Medicine Biostatistics course Non-parametric methods March 4&7, 2016 Instructor: Dr. Nimet İlke Akçay (ilke.cetin@emu.edu.tr) Learning Objectives 1. Distinguish
Non-parametric tests, part A:
 Two types of statistical test: Non-parametric tests, part A: Parametric tests: Based on assumption that the data have certain characteristics or "parameters": Results are only valid if (a) the data are
PSY 307 Statistics for the Behavioral Sciences. Chapter 20 Tests for Ranked Data, Choosing Statistical Tests
 PSY 307 Statistics for the Behavioral Sciences Chapter 20 Tests for Ranked Data, Choosing Statistical Tests What To Do with Non-normal Distributions Tranformations (pg 382): The shape of the distribution
CHAPTER 17 CHI-SQUARE AND OTHER NONPARAMETRIC TESTS FROM: PAGANO, R. R. (2007)
") FROM: PAGANO, R. R. (007) I. INTRODUCTION: DISTINCTION BETWEEN PARAMETRIC AND NON-PARAMETRIC TESTS Statistical inference tests are often classified as to whether they are parametric or nonparametric Parameter
FROM: PAGANO, R. R. (007) I. INTRODUCTION: DISTINCTION BETWEEN PARAMETRIC AND NON-PARAMETRIC TESTS Statistical inference tests are often classified as to whether they are parametric or nonparametric Parameter
Lecture Slides. Elementary Statistics. by Mario F. Triola. and the Triola Statistics Series
 Lecture Slides Elementary Statistics Tenth Edition and the Triola Statistics Series by Mario F. Triola Slide 1 Chapter 13 Nonparametric Statistics 13-1 Overview 13-2 Sign Test 13-3 Wilcoxon Signed-Ranks
Lecture Slides. Section 13-1 Overview. Elementary Statistics Tenth Edition. Chapter 13 Nonparametric Statistics. by Mario F.
 Lecture Slides Elementary Statistics Tenth Edition and the Triola Statistics Series by Mario F. Triola Slide 1 Chapter 13 Nonparametric Statistics 13-1 Overview 13-2 Sign Test 13-3 Wilcoxon Signed-Ranks
Non-parametric (Distribution-free) approaches p188 CN
 approaches p188 CN") Week 1: Introduction to some nonparametric and computer intensive (re-sampling) approaches: the sign test, Wilcoxon tests and multi-sample extensions, Spearman s rank correlation; the Bootstrap. (ch14
Week 1: Introduction to some nonparametric and computer intensive (re-sampling) approaches: the sign test, Wilcoxon tests and multi-sample extensions, Spearman s rank correlation; the Bootstrap. (ch14
CHI SQUARE ANALYSIS 8/18/2011 HYPOTHESIS TESTS SO FAR PARAMETRIC VS. NON-PARAMETRIC
 CHI SQUARE ANALYSIS I N T R O D U C T I O N T O N O N - P A R A M E T R I C A N A L Y S E S HYPOTHESIS TESTS SO FAR We ve discussed One-sample t-test Dependent Sample t-tests Independent Samples t-tests
4/6/16. Non-parametric Test. Overview. Stephen Opiyo. Distinguish Parametric and Nonparametric Test Procedures
 Non-parametric Test Stephen Opiyo Overview Distinguish Parametric and Nonparametric Test Procedures Explain commonly used Nonparametric Test Procedures Perform Hypothesis Tests Using Nonparametric Procedures
Nonparametric Statistics. Leah Wright, Tyler Ross, Taylor Brown
 Nonparametric Statistics Leah Wright, Tyler Ross, Taylor Brown Before we get to nonparametric statistics, what are parametric statistics? These statistics estimate and test population means, while holding
Chapter 15: Nonparametric Statistics Section 15.1: An Overview of Nonparametric Statistics
 Section 15.1: An Overview of Nonparametric Statistics Understand Difference between Parametric and Nonparametric Statistical Procedures Parametric statistical procedures inferential procedures that rely
Introduction and Descriptive Statistics p. 1 Introduction to Statistics p. 3 Statistics, Science, and Observations p. 5 Populations and Samples p.
 Preface p. xi Introduction and Descriptive Statistics p. 1 Introduction to Statistics p. 3 Statistics, Science, and Observations p. 5 Populations and Samples p. 6 The Scientific Method and the Design of
Nonparametric Statistics
 Nonparametric Statistics Nonparametric or Distribution-free statistics: used when data are ordinal (i.e., rankings) used when ratio/interval data are not normally distributed (data are converted to ranks)
HYPOTHESIS TESTING II TESTS ON MEANS. Sorana D. Bolboacă
 HYPOTHESIS TESTING II TESTS ON MEANS Sorana D. Bolboacă OBJECTIVES Significance value vs p value Parametric vs non parametric tests Tests on means: 1 Dec 14 2 SIGNIFICANCE LEVEL VS. p VALUE Materials and
Data are sometimes not compatible with the assumptions of parametric statistical tests (i.e. t-test, regression, ANOVA)
") BSTT523 Pagano & Gauvreau Chapter 13 1 Nonparametric Statistics Data are sometimes not compatible with the assumptions of parametric statistical tests (i.e. t-test, regression, ANOVA) In particular, data
BSTT523 Pagano & Gauvreau Chapter 13 1 Nonparametric Statistics Data are sometimes not compatible with the assumptions of parametric statistical tests (i.e. t-test, regression, ANOVA) In particular, data
3. Nonparametric methods
 3. Nonparametric methods If the probability distributions of the statistical variables are unknown or are not as required (e.g. normality assumption violated), then we may still apply nonparametric tests
Glossary. The ISI glossary of statistical terms provides definitions in a number of different languages:
 Glossary The ISI glossary of statistical terms provides definitions in a number of different languages: http://isi.cbs.nl/glossary/index.htm Adjusted r 2 Adjusted R squared measures the proportion of the
Basic Business Statistics, 10/e
 Chapter 1 1-1 Basic Business Statistics 11 th Edition Chapter 1 Chi-Square Tests and Nonparametric Tests Basic Business Statistics, 11e 009 Prentice-Hall, Inc. Chap 1-1 Learning Objectives In this chapter,
Inferential Statistics
 Inferential Statistics Eva Riccomagno, Maria Piera Rogantin DIMA Università di Genova riccomagno@dima.unige.it rogantin@dima.unige.it Part G Distribution free hypothesis tests 1. Classical and distribution-free
DETAILED CONTENTS PART I INTRODUCTION AND DESCRIPTIVE STATISTICS. 1. Introduction to Statistics
 DETAILED CONTENTS About the Author Preface to the Instructor To the Student How to Use SPSS With This Book PART I INTRODUCTION AND DESCRIPTIVE STATISTICS 1. Introduction to Statistics 1.1 Descriptive and
Module 9: Nonparametric Statistics Statistics (OA3102)
") Module 9: Nonparametric Statistics Statistics (OA3102) Professor Ron Fricker Naval Postgraduate School Monterey, California Reading assignment: WM&S chapter 15.1-15.6 Revision: 3-12 1 Goals for this Lecture
Module 9: Nonparametric Statistics Statistics (OA3102) Professor Ron Fricker Naval Postgraduate School Monterey, California Reading assignment: WM&S chapter 15.1-15.6 Revision: 3-12 1 Goals for this Lecture
Unit 14: Nonparametric Statistical Methods
 Unit 14: Nonparametric Statistical Methods Statistics 571: Statistical Methods Ramón V. León 8/8/2003 Unit 14 - Stat 571 - Ramón V. León 1 Introductory Remarks Most methods studied so far have been based
Contents. Acknowledgments. xix
 Table of Preface Acknowledgments page xv xix 1 Introduction 1 The Role of the Computer in Data Analysis 1 Statistics: Descriptive and Inferential 2 Variables and Constants 3 The Measurement of Variables
Types of Statistical Tests DR. MIKE MARRAPODI
 Types of Statistical Tests DR. MIKE MARRAPODI Tests t tests ANOVA Correlation Regression Multivariate Techniques Non-parametric t tests One sample t test Independent t test Paired sample t test One sample
What Are Nonparametric Statistics and When Do You Use Them? Jennifer Catrambone
 What Are Nonparametric Statistics and When Do You Use Them? Jennifer Catrambone First, a bit about Parametric Statistics Data are expected to be randomly drawn from a normal population Minimum sample size
Intro to Parametric & Nonparametric Statistics
 Kinds of variable The classics & some others Intro to Parametric & Nonparametric Statistics Kinds of variables & why we care Kinds & definitions of nonparametric statistics Where parametric stats come
Contents Kruskal-Wallis Test Friedman s Two-way Analysis of Variance by Ranks... 47
 Contents 1 Non-parametric Tests 3 1.1 Introduction....................................... 3 1.2 Advantages of Non-parametric Tests......................... 4 1.3 Disadvantages of Non-parametric Tests........................
ANOVA - analysis of variance - used to compare the means of several populations.
 12.1 One-Way Analysis of Variance ANOVA - analysis of variance - used to compare the means of several populations. Assumptions for One-Way ANOVA: 1. Independent samples are taken using a randomized design.
SEVERAL μs AND MEDIANS: MORE ISSUES. Business Statistics
 SEVERAL μs AND MEDIANS: MORE ISSUES Business Statistics CONTENTS Post-hoc analysis ANOVA for 2 groups The equal variances assumption The Kruskal-Wallis test Old exam question Further study POST-HOC ANALYSIS
Statistical Inference Theory Lesson 46 Non-parametric Statistics
 46.1-The Sign Test Statistical Inference Theory Lesson 46 Non-parametric Statistics 46.1 - Problem 1: (a). Let p equal the proportion of supermarkets that charge less than $2.15 a pound. H o : p 0.50 H
16. Nonparametric Methods. Analysis of ordinal data
 16. Nonparametric Methods 數 Analysis of ordinal data 料 1 Data : Non-interval data : nominal data, ordinal data Interval data but not normally distributed Nonparametric tests : Two dependent samples pair
BIO 682 Nonparametric Statistics Spring 2010
 BIO 682 Nonparametric Statistics Spring 2010 Steve Shuster http://www4.nau.edu/shustercourses/bio682/index.htm Lecture 8 Example: Sign Test 1. The number of warning cries delivered against intruders by
Inferences About the Difference Between Two Means
 7 Inferences About the Difference Between Two Means Chapter Outline 7.1 New Concepts 7.1.1 Independent Versus Dependent Samples 7.1. Hypotheses 7. Inferences About Two Independent Means 7..1 Independent
Chapter Fifteen. Frequency Distribution, Cross-Tabulation, and Hypothesis Testing
 Chapter Fifteen Frequency Distribution, Cross-Tabulation, and Hypothesis Testing Copyright 2010 Pearson Education, Inc. publishing as Prentice Hall 15-1 Internet Usage Data Table 15.1 Respondent Sex Familiarity
Statistics Handbook. All statistical tables were computed by the author.
 Statistics Handbook Contents Page Wilcoxon rank-sum test (Mann-Whitney equivalent) Wilcoxon matched-pairs test 3 Normal Distribution 4 Z-test Related samples t-test 5 Unrelated samples t-test 6 Variance
Rank-Based Methods. Lukas Meier
 Rank-Based Methods Lukas Meier 20.01.2014 Introduction Up to now we basically always used a parametric family, like the normal distribution N (µ, σ 2 ) for modeling random data. Based on observed data
THE ROYAL STATISTICAL SOCIETY HIGHER CERTIFICATE
 THE ROYAL STATISTICAL SOCIETY 004 EXAMINATIONS SOLUTIONS HIGHER CERTIFICATE PAPER II STATISTICAL METHODS The Society provides these solutions to assist candidates preparing for the examinations in future
Nominal Data. Parametric Statistics. Nonparametric Statistics. Parametric vs Nonparametric Tests. Greg C Elvers
 Nominal Data Greg C Elvers 1 Parametric Statistics The inferential statistics that we have discussed, such as t and ANOVA, are parametric statistics A parametric statistic is a statistic that makes certain
CDA Chapter 3 part II
 CDA Chapter 3 part II Two-way tables with ordered classfications Let u 1 u 2... u I denote scores for the row variable X, and let ν 1 ν 2... ν J denote column Y scores. Consider the hypothesis H 0 : X
Agonistic Display in Betta splendens: Data Analysis I. Betta splendens Research: Parametric or Non-parametric Data?
 Agonistic Display in Betta splendens: Data Analysis By Joanna Weremjiwicz, Simeon Yurek, and Dana Krempels Once you have collected data with your ethogram, you are ready to analyze that data to see whether
ST4241 Design and Analysis of Clinical Trials Lecture 7: N. Lecture 7: Non-parametric tests for PDG data
 ST4241 Design and Analysis of Clinical Trials Lecture 7: Non-parametric tests for PDG data Department of Statistics & Applied Probability 8:00-10:00 am, Friday, September 2, 2016 Outline Non-parametric
Analysis of variance (ANOVA) Comparing the means of more than two groups
 Comparing the means of more than two groups") Analysis of variance (ANOVA) Comparing the means of more than two groups Example: Cost of mating in male fruit flies Drosophila Treatments: place males with and without unmated (virgin) females Five treatments
Analysis of variance (ANOVA) Comparing the means of more than two groups Example: Cost of mating in male fruit flies Drosophila Treatments: place males with and without unmated (virgin) females Five treatments
An Analysis of College Algebra Exam Scores December 14, James D Jones Math Section 01
 An Analysis of College Algebra Exam s December, 000 James D Jones Math - Section 0 An Analysis of College Algebra Exam s Introduction Students often complain about a test being too difficult. Are there
N Utilization of Nursing Research in Advanced Practice, Summer 2008
 University of Michigan Deep Blue deepblue.lib.umich.edu 2008-07 536 - Utilization of ursing Research in Advanced Practice, Summer 2008 Tzeng, Huey-Ming Tzeng, H. (2008, ctober 1). Utilization of ursing
STATISTIKA INDUSTRI 2 TIN 4004
 STATISTIKA INDUSTRI 2 TIN 4004 Pertemuan 11 & 12 Outline: Nonparametric Statistics Referensi: Walpole, R.E., Myers, R.H., Myers, S.L., Ye, K., Probability & Statistics for Engineers & Scientists, 9 th
Introduction to inferential statistics. Alissa Melinger IGK summer school 2006 Edinburgh
 Introduction to inferential statistics Alissa Melinger IGK summer school 2006 Edinburgh Short description Prereqs: I assume no prior knowledge of stats This half day tutorial on statistical analysis will
GROUPED DATA E.G. FOR SAMPLE OF RAW DATA (E.G. 4, 12, 7, 5, MEAN G x / n STANDARD DEVIATION MEDIAN AND QUARTILES STANDARD DEVIATION
 FOR SAMPLE OF RAW DATA (E.G. 4, 1, 7, 5, 11, 6, 9, 7, 11, 5, 4, 7) BE ABLE TO COMPUTE MEAN G / STANDARD DEVIATION MEDIAN AND QUARTILES Σ ( Σ) / 1 GROUPED DATA E.G. AGE FREQ. 0-9 53 10-19 4...... 80-89
What is a Hypothesis?
 What is a Hypothesis? A hypothesis is a claim (assumption) about a population parameter: population mean Example: The mean monthly cell phone bill in this city is μ = $42 population proportion Example:
= 1 i. normal approximation to χ 2 df > df
 χ tests 1) 1 categorical variable χ test for goodness-of-fit ) categorical variables χ test for independence (association, contingency) 3) categorical variables McNemar's test for change χ df k (O i 1
Hypothesis Testing. Hypothesis: conjecture, proposition or statement based on published literature, data, or a theory that may or may not be true
 Hypothesis esting Hypothesis: conjecture, proposition or statement based on published literature, data, or a theory that may or may not be true Statistical Hypothesis: conjecture about a population parameter
Chapter 18 Resampling and Nonparametric Approaches To Data
 Chapter 18 Resampling and Nonparametric Approaches To Data 18.1 Inferences in children s story summaries (McConaughy, 1980): a. Analysis using Wilcoxon s rank-sum test: Younger Children Older Children
Small n, σ known or unknown, underlying nongaussian
 READY GUIDE Summary Tables SUMMARY-1: Methods to compute some confidence intervals Parameter of Interest Conditions 95% CI Proportion (π) Large n, p 0 and p 1 Equation 12.11 Small n, any p Figure 12-4
NONPARAMETRIC TESTS. LALMOHAN BHAR Indian Agricultural Statistics Research Institute Library Avenue, New Delhi-12
 NONPARAMETRIC TESTS LALMOHAN BHAR Indian Agricultural Statistics Research Institute Library Avenue, New Delhi-1 lmb@iasri.res.in 1. Introduction Testing (usually called hypothesis testing ) play a major
Lecture 7: Hypothesis Testing and ANOVA
 Lecture 7: Hypothesis Testing and ANOVA Goals Overview of key elements of hypothesis testing Review of common one and two sample tests Introduction to ANOVA Hypothesis Testing The intent of hypothesis
Non-Parametric Statistics: When Normal Isn t Good Enough"
 Non-Parametric Statistics: When Normal Isn t Good Enough" Professor Ron Fricker" Naval Postgraduate School" Monterey, California" 1/28/13 1 A Bit About Me" Academic credentials" Ph.D. and M.A. in Statistics,
Intuitive Biostatistics: Choosing a statistical test
 pagina 1 van 5 < BACK Intuitive Biostatistics: Choosing a statistical This is chapter 37 of Intuitive Biostatistics (ISBN 0-19-508607-4) by Harvey Motulsky. Copyright 1995 by Oxfd University Press Inc.
psychological statistics
 psychological statistics B Sc. Counselling Psychology 011 Admission onwards III SEMESTER COMPLEMENTARY COURSE UNIVERSITY OF CALICUT SCHOOL OF DISTANCE EDUCATION CALICUT UNIVERSITY.P.O., MALAPPURAM, KERALA,
Nonparametric Statistics Notes
 Nonparametric Statistics Notes Chapter 5: Some Methods Based on Ranks Jesse Crawford Department of Mathematics Tarleton State University (Tarleton State University) Ch 5: Some Methods Based on Ranks 1
Understand the difference between symmetric and asymmetric measures
 Chapter 9 Measures of Strength of a Relationship Learning Objectives Understand the strength of association between two variables Explain an association from a table of joint frequencies Understand a proportional
Transition Passage to Descriptive Statistics 28
 viii Preface xiv chapter 1 Introduction 1 Disciplines That Use Quantitative Data 5 What Do You Mean, Statistics? 6 Statistics: A Dynamic Discipline 8 Some Terminology 9 Problems and Answers 12 Scales of
Statistical. Psychology
 SEVENTH у *i km m it* & П SB Й EDITION Statistical M e t h o d s for Psychology D a v i d C. Howell University of Vermont ; \ WADSWORTH f% CENGAGE Learning* Australia Biaall apan Korea Меяко Singapore
Nonparametric Methods
 Nonparametric Methods Marc H. Mehlman marcmehlman@yahoo.com University of New Haven Nonparametric Methods, or Distribution Free Methods is for testing from a population without knowing anything about the
Dr. Maddah ENMG 617 EM Statistics 10/12/12. Nonparametric Statistics (Chapter 16, Hines)
") Dr. Maddah ENMG 617 EM Statistics 10/12/12 Nonparametric Statistics (Chapter 16, Hines) Introduction Most of the hypothesis testing presented so far assumes normally distributed data. These approaches
Dr. Maddah ENMG 617 EM Statistics 10/12/12 Nonparametric Statistics (Chapter 16, Hines) Introduction Most of the hypothesis testing presented so far assumes normally distributed data. These approaches
NAG Library Chapter Introduction. G08 Nonparametric Statistics
 NAG Library Chapter Introduction G08 Nonparametric Statistics Contents 1 Scope of the Chapter.... 2 2 Background to the Problems... 2 2.1 Parametric and Nonparametric Hypothesis Testing... 2 2.2 Types
Slides by. John Loucks. St. Edward s University. Slide South-Western, a part of Cengage Learning
 Slides by John Loucks St. Edward s University Slide 1 Chapter 10 Comparisons Involving Means Part A Inferences About the Difference Between Two Population Means: s 1 and s 2 Known Inferences About the
Introduction to Biostatistics: Part 5, Statistical Inference Techniques for Hypothesis Testing With Nonparametric Data
 SPECIAL CONTRIBUTION biostatistics Introduction to Biostatistics: Part 5, Statistical Inference Techniques for Hypothesis Testing With Nonparametric Data Specific statistical tests are used when the null
This is particularly true if you see long tails in your data. What are you testing? That the two distributions are the same!
 Two sample tests (part II): What to do if your data are not distributed normally: Option 1: if your sample size is large enough, don't worry - go ahead and use a t-test (the CLT will take care of non-normal
Data Analysis: Agonistic Display in Betta splendens I. Betta splendens Research: Parametric or Non-parametric Data?
 Data Analysis: Agonistic Display in Betta splendens By Joanna Weremjiwicz, Simeon Yurek, and Dana Krempels Once you have collected data with your ethogram, you are ready to analyze that data to see whether
Analyzing Small Sample Experimental Data
 Analyzing Small Sample Experimental Data Session 2: Non-parametric tests and estimators I Dominik Duell (University of Essex) July 15, 2017 Pick an appropriate (non-parametric) statistic 1. Intro to non-parametric
Statistics: revision
 NST 1B Experimental Psychology Statistics practical 5 Statistics: revision Rudolf Cardinal & Mike Aitken 29 / 30 April 2004 Department of Experimental Psychology University of Cambridge Handouts: Answers
Statistics and Measurement Concepts with OpenStat
 Statistics and Measurement Concepts with OpenStat William Miller Statistics and Measurement Concepts with OpenStat William Miller Urbandale, Iowa USA ISBN 978-1-4614-5742-8 ISBN 978-1-4614-5743-5 (ebook)
Non-parametric Tests
 Statistics Column Shengping Yang PhD,Gilbert Berdine MD I was working on a small study recently to compare drug metabolite concentrations in the blood between two administration regimes. However, the metabolite
Basics on t-tests Independent Sample t-tests Single-Sample t-tests Summary of t-tests Multiple Tests, Effect Size Proportions. Statistiek I.
 Statistiek I t-tests John Nerbonne CLCG, Rijksuniversiteit Groningen http://www.let.rug.nl/nerbonne/teach/statistiek-i/ John Nerbonne 1/46 Overview 1 Basics on t-tests 2 Independent Sample t-tests 3 Single-Sample
Glossary for the Triola Statistics Series
 Glossary for the Triola Statistics Series Absolute deviation The measure of variation equal to the sum of the deviations of each value from the mean, divided by the number of values Acceptance sampling
Basic Statistical Analysis
 indexerrt.qxd 8/21/2002 9:47 AM Page 1 Corrected index pages for Sprinthall Basic Statistical Analysis Seventh Edition indexerrt.qxd 8/21/2002 9:47 AM Page 656 Index Abscissa, 24 AB-STAT, vii ADD-OR rule,
ST4241 Design and Analysis of Clinical Trials Lecture 9: N. Lecture 9: Non-parametric procedures for CRBD
 ST21 Design and Analysis of Clinical Trials Lecture 9: Non-parametric procedures for CRBD Department of Statistics & Applied Probability 8:00-10:00 am, Friday, September 9, 2016 Outline Nonparametric tests
TMA4255 Applied Statistics V2016 (23)
") TMA4255 Applied Statistics V2016 (23) Part 7: Nonparametric tests Signed-Rank test [16.2] Wilcoxon Rank-sum test [16.3] Anna Marie Holand April 19, 2016, wiki.math.ntnu.no/tma4255/2016v/start 2 Outline
TMA4255 Applied Statistics V2016 (23) Part 7: Nonparametric tests Signed-Rank test [16.2] Wilcoxon Rank-sum test [16.3] Anna Marie Holand April 19, 2016, wiki.math.ntnu.no/tma4255/2016v/start 2 Outline
Nonparametric tests. Mark Muldoon School of Mathematics, University of Manchester. Mark Muldoon, November 8, 2005 Nonparametric tests - p.
 Nonparametric s Mark Muldoon School of Mathematics, University of Manchester Mark Muldoon, November 8, 2005 Nonparametric s - p. 1/31 Overview The sign, motivation The Mann-Whitney Larger Larger, in pictures
Spearman Rho Correlation
 Spearman Rho Correlation Learning Objectives After studying this Chapter, you should be able to: know when to use Spearman rho, Calculate Spearman rho coefficient, Interpret the correlation coefficient,
Inference About Means and Proportions with Two Populations
 Inference About Means and Proportions with Two Populations Content Inferences About the Difference Between Two Population Means: 1 and Known Inferences About the Difference Between Two Population Means:
Biostatistics 270 Kruskal-Wallis Test 1. Kruskal-Wallis Test
 Biostatistics 270 Kruskal-Wallis Test 1 ORIGIN 1 Kruskal-Wallis Test The Kruskal-Wallis is a non-parametric analog to the One-Way ANOVA F-Test of means. It is useful when the k samples appear not to come
Contents 1. Contents
 Contents 1 Contents 4 Paired Comparisons & Block Designs 3 4.1 Paired Comparisons.................... 3 4.1.1 Paired Data.................... 3 4.1.2 Existing Approaches................ 6 4.1.3 Paired-comparison
Inferential statistics
 Inferential statistics Inference involves making a Generalization about a larger group of individuals on the basis of a subset or sample. Ahmed-Refat-ZU Null and alternative hypotheses In hypotheses testing,
1 ONE SAMPLE TEST FOR MEDIAN: THE SIGN TEST
 NON-PARAMETRIC STATISTICS ONE AND TWO SAMPLE TESTS Non-parametric tests are normally based on ranks of the data samples, and test hypotheses relating to quantiles of the probability distribution representing
Review of Statistics 101
 Review of Statistics 101 We review some important themes from the course 1. Introduction Statistics- Set of methods for collecting/analyzing data (the art and science of learning from data). Provides methods
Non-Parametric Two-Sample Analysis: The Mann-Whitney U Test
 Non-Parametric Two-Sample Analysis: The Mann-Whitney U Test When samples do not meet the assumption of normality parametric tests should not be used. To overcome this problem, non-parametric tests can
Kumaun University Nainital
 Kumaun University Nainital Department of Statistics B. Sc. Semester system course structure: 1. The course work shall be divided into six semesters with three papers in each semester. 2. Each paper in
Introduction to Nonparametric Statistics
 Introduction to Nonparametric Statistics by James Bernhard Spring 2012 Parameters Parametric method Nonparametric method µ[x 2 X 1 ] paired t-test Wilcoxon signed rank test µ[x 1 ], µ[x 2 ] 2-sample t-test
Introduction to Business Statistics QM 220 Chapter 12
 Department of Quantitative Methods & Information Systems Introduction to Business Statistics QM 220 Chapter 12 Dr. Mohammad Zainal 12.1 The F distribution We already covered this topic in Ch. 10 QM-220,
Tentative solutions TMA4255 Applied Statistics 16 May, 2015
 Norwegian University of Science and Technology Department of Mathematical Sciences Page of 9 Tentative solutions TMA455 Applied Statistics 6 May, 05 Problem Manufacturer of fertilizers a) Are these independent
Non-parametric Statistics
 45 Contents Non-parametric Statistics 45.1 Non-parametric Tests for a Single Sample 45. Non-parametric Tests for Two Samples 4 Learning outcomes You will learn about some significance tests which may be
Exam details. Final Review Session. Things to Review
 Exam details Final Review Session Short answer, similar to book problems Formulae and tables will be given You CAN use a calculator Date and Time: Dec. 7, 006, 1-1:30 pm Location: Osborne Centre, Unit
E509A: Principle of Biostatistics. (Week 11(2): Introduction to non-parametric. methods ) GY Zou.
: Introduction to non-parametric. methods ) GY Zou.") E509A: Principle of Biostatistics (Week 11(2): Introduction to non-parametric methods ) GY Zou gzou@robarts.ca Sign test for two dependent samples Ex 12.1 subj 1 2 3 4 5 6 7 8 9 10 baseline 166 135 189
E509A: Principle of Biostatistics (Week 11(2): Introduction to non-parametric methods ) GY Zou gzou@robarts.ca Sign test for two dependent samples Ex 12.1 subj 1 2 3 4 5 6 7 8 9 10 baseline 166 135 189
Everything is not normal
 Everything is not normal According to the dictionary, one thing is considered normal when it s in its natural state or conforms to standards set in advance. And this is its normal meaning. But, like many
Frequency Distribution Cross-Tabulation
 Frequency Distribution Cross-Tabulation 1) Overview 2) Frequency Distribution 3) Statistics Associated with Frequency Distribution i. Measures of Location ii. Measures of Variability iii. Measures of Shape
Solutions exercises of Chapter 7
 Solutions exercises of Chapter 7 Exercise 1 a. These are paired samples: each pair of half plates will have about the same level of corrosion, so the result of polishing by the two brands of polish are