Introduction to Statistical Analysis
|
|
|
- Alan Barrie Banks
- 5 years ago
- Views:
Transcription


1 Introduction to Statistical Analysis Changyu Shen Richard A. and Susan F. Smith Center for Outcomes Research in Cardiology Beth Israel Deaconess Medical Center Harvard Medical School
2
3 Objectives Descriptive versus inferential procedures Parametric versus non parametric inferential procedures Central limit theorem (CLT) and pivot quantity Inferential procedures Categories Univariate analysis Bivariate analysis Multivariate analysis
4 Descriptive versus Inferential Procedures A descriptive statistic usually is the sample version of the corresponding population parameter Mean age in a sample is the sample version of the mean age in the population The purpose is to get an approximate sense of the population An inference procedure formally addresses the uncertainty when using statistics to infer parameters Interval estimation Hypothesis testing
5 Descriptive Statistics Continuous variables Measures of the center of the distribution Mean Median Measures of the dispersion of the distribution Standard deviation Interquartile range Range Measures of symmetry Skewness Measures of fatness of the tail Kurtosis
6 Descriptive Statistics Binary variables Proportion (proportion can also be viewed as mean if event is coded as 1 and non event is coded as 0) Categorical variables Proportions
7
8

9
10

11
12 Before data collection After data collection Parameter Experiment Procedure Statistic(s) Interpretation Determine the parameter of interest Determine the study design Determine statistical method(s) Compute statistic(s) Draw conclusion(s)
13 Formulating a Research Question Parameter Translate the research question into estimation/testing of population parameter(s) e.g. For the evaluation of a medical intervention, how to measure efficacy? If there are multiple choices, which to pick? Interpretability Variability Practicality Sometimes we needs to transfer to another quantity It is easier to draw statistical inference of Transform back
14 Parametric Inferential Methods Assumptions about the underlying distributions of the variables (collectively called a model) Shape of distributions, e.g. normal distribution, Poisson distribution Relationship between the mean of a variable and the values of other variables, e.g. linear, quadratic Correlation structure among variables Advantages Convenience in defining the parameters of interest; e.g. slope in a linear regression More efficient (better precision)
15 Parametric Inferential Methods Disadvantages Model misspecification renders parameter not meaningful Bias
16 Nonparametric Inferential Methods Fewer assumptions Many of them are based on ranks Signed rank test (NP version of paired T) Wilcoxon rank sum/mann Whitney U test (NP version of two sample T) Kruskal Wallis test (NP version of ANOVA) Friedman test (NP version of repeated ANOVA) Advantage Robust Disadvantage Less efficient
17 Central Limit Theorem (CLT) CLT states that the sampling distribution of the sample mean approaches to a normal distribution as the sample size gets large It is the foundational theorem of most of the widely adopted statistical inference procedures that rely on large sample sizes
18
19 Pivot Quantity parameter of interest : a statistic that serves as a point estimator of (usually the sample version of ) : the estimated standard error of Unique feature: the sampling distribution of the pivot does not depend on.
20 Scenario 1 Sample size=21 Sample 1 T 1 =1.32 Sample 2 T 2 =0.27 Population (mean SBP=120mmHg) Sample 3 T 3 =-0.89 Sample m T m =-0.11 T=(sample mean of SBP 120)/estimated standard error
21 Scenario 2 Sample size=21 Sample 1 T 1 =0.87 Sample 2 T 2 =1.84 Population (mean SBP=115mmHg) Sample 3 T 3 =-1.14 Sample m T m =-0.33 T=(sample mean of SBP 115)/estimated standard error

22 Scenarios 1 and 2 have the same sampling distribution for T
23 Pivot Quantity Often the common distribution of can be approximated by standard normal distribution based on CLT, then We can make statement like Pr 0.95 Pr 0.95 (confidence interval) We can compute the null distribution for the test statistic (hypothesis testing)
24 Three Foundational Elements of Statistical Inference Sampling distribution (Define how uncertainty is measured) CLT Computation of the sampling distribution Pivot Bridge statistics and parameters
25 Procedures: Category Normal ( N ) Sampling distribution of the pivot is standard normal or approximately standard normal Estimation: and ( for 95% CI) Hypothesis testing:, two sided: ; one sided: (or ). for
26
27 Procedures: Category T Sampling distribution of the pivot is T distribution Estimation: and Hypothesis testing:, two sided: ; one sided: (or ). depends on confidence level/type I error and sample size When sample size is large, T distribution is the same as standard normal distribution
28
29 Procedure: Category Other ( O ) Alternative pivots and sampling distributions of the pivots Chi square distribution for the pivot used to infer population variance F distribution for the pivot used to infer ratio of the variances of two populations Non pivot based approaches When the sampling distribution of a statistic only depends on one parameter (which is of interest), exact method is possible Bootstrap
30 Univariate Analysis for Continuous Population mean : sample mean; : estimated SEM Variables a) If the variable is normally distributed: T test and T interval (category T) b) If the sample size is large: Z test and Z interval (category N) c) Other (category O)
31 Univariate Analysis for Continuous Variables Population median (for skewed distribution) Signed test median=10 versus median>10 : proportion of units with value >10=0.5 : proportion of units with value >10>0.5 Essentially a test of proportion
32 Univariate Analysis for Binary Variables Proportion: a proportion can be viewed as a mean by coding event as 1 and non event as 0 a) If the sample size is large: Z test and Z interval (category N) b) Exact method based on binomial distribution for small sample sizes (category O)
33 Univariate Analysis for Time to Event Time to event variables Time to death Time to MI Feature: potentially right censoring Variables e.g. Follow up is not available after time t so we know subject is event free at time t but do not know exactly when event occurs after t Need special technique for analysis
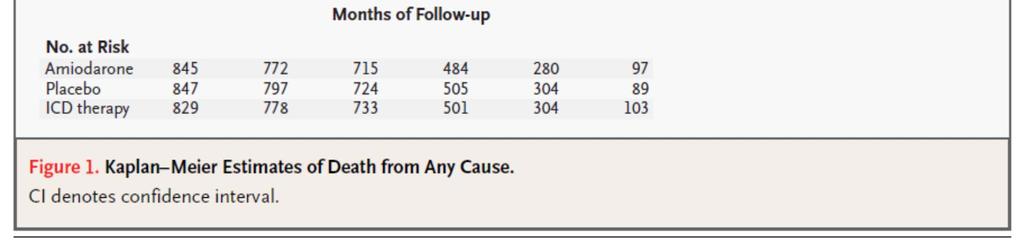
34 Univariate Analysis for Time to Event Survival probability beyond time Variables : Kaplan Meier estimator (category N) Key assumption: those who are censored at a given time point and those who are not censored have the same survival probability

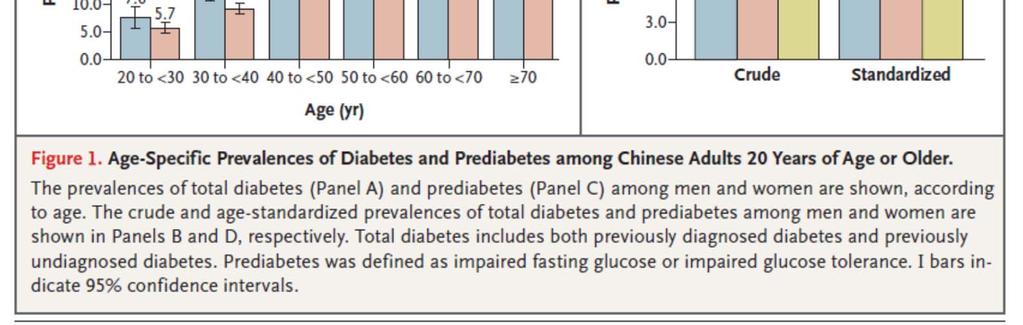
35 Univariate Analysis for Time to Event Variables
36
37
38
39 Bivariate Analysis: Two Continuous Pearson correlation coefficient (PCC) Variables
40 Bivariate Analysis: Two Continuous Variables Pearson correlation coefficient (PCC) Takes value in [ 1,1] Measures linear relationships The two variables do NOT necessarily need to be normal PCC=0 does not necessarily mean the two variables are independent : sample correlation coefficient Inference is category N
41
42 Bivariate Analysis: Two Continuous Variables Simple linear regression Model: is the error that is independence of X Mean of is 0 Sometimes is assumed to be normal Examine how changes of X affect the mean of Y Slope ( ): the amount of change in the mean value of Y for every one unit increase in X Point estimate: least square method Inference is category N or T
43
44 Odds ratio: Bivariate Analysis: Two Binary Variables Example: Always greater than 0 Measure of the strength of association when event rate is relatively low (e.g. death rate is low) : sample odds ratio Inference is category N or category O (exact method for small sample size)
45 Relative risk: Bivariate Analysis: Two Binary Variables Example: Always greater than 0 Measure of the strength of association when event rate is relatively high (e.g. disease free rate is high) : sample relative risk Inference is category N
46 Risk difference: Bivariate Analysis: Two Binary Variables Example: Takes value in [ 1,1] : sample risk difference Inference is category N or O (equivalent)
47 Bivariate Analysis: One Continuous and One Binary Variables Treat the continuous variable as outcome (the binary variable defines the group) Paired data Mean of the difference: paired T test/t CI (category T) or Z test/z CI (category N) Median of the difference: Wilcoxon signed rank test (category N) Non paired data Mean of the difference: T test/t CI (category T) or Z test/z CI (category N) Median of the difference: Wilcoxon rank sum test (category N)
48 Bivariate Analysis: One Continuous and One Binary Variables Treat the binary variable as outcome, the analysis becomes logistic regression (discussed later)
49 Bivariate Analysis: One of the Two is Time to Event Variable Usually the time to event variable is the outcome When the other variable is binary Log rank test to test if the two survival curves are the same at every time point (category N and O). Cox proportional hazard regression model (discussed later)
50
51
52 Multivariate Analysis: Regression Model A statistical model is a set of assumptions about the underlying stochastic process that generated the data Regression model describes the relationship between dependent random variables and independent variables (observed or unobserved) Regression model is a general framework that covers many statistical methods (e.g. T test, ANOVA)
53 Objectives of Regression Models Understand association between a set of independent variables and the dependent variables Causal inference Predictions
54 Continuous Outcome: Linear Regression Model: is the error that is independence of all X Mean of is 0 Sometimes is assumed to be normal measures the amount of change in the mean value of Y for every one unit increase in when other X s are fixed Point estimate: least square method Inference is category N or T Once s are estimated, the model can be used for prediction
55 Binary Outcome: Logistic Regression Model: ln 1 measures the amount of change in the odd of Y=1 (at the logarithm scale) for every one unit increase in when other X s are fixed; when is binary, is the odds ratio Point estimate: maximum likelihood estimation Inference is category N or O Once s are estimated, the model can be used for prediction
56 Time to Event Outcome: Cox Model Hazard Model # # ) Interpretation is the baseline hazard corresponding to the group of subjects with all X equal to 0 The essence of the model is that the X s affect the hazard (at the logarithm scale) in a linear manner
57 Time to Event Outcome: Cox Model Cox model is also called the proportional hazard model Consider the model with one binary covariate: exp ) The hazard ratio of the group with 1to the group with 0is exp ), which does not depend on t. measures the amount of change in the hazard (at the logarithm scale) for every one unit increase in when other X s are fixed; when is binary, exp is the hazard ratio Point estimate: maximum partial likelihood estimation Inference is category N Once s are estimated, the model can be used for prediction
58 Summary Descriptive versus inferential procedures Descriptive: rough idea of the population Inferential: formally address uncertainty Parametric versus non parametric inference procedures Parametric: more efficient; less robust Nonparametric: more robust; less efficient
 Assumptions Procedures Interpretations")
59 Three elements of statistical inference Sampling distribution Central limit theorem Pivot Analysis Parameter(s) Assumptions Procedures Interpretations Summary
Introduction and Descriptive Statistics p. 1 Introduction to Statistics p. 3 Statistics, Science, and Observations p. 5 Populations and Samples p.
 Preface p. xi Introduction and Descriptive Statistics p. 1 Introduction to Statistics p. 3 Statistics, Science, and Observations p. 5 Populations and Samples p. 6 The Scientific Method and the Design of
Contents. Acknowledgments. xix
 Table of Preface Acknowledgments page xv xix 1 Introduction 1 The Role of the Computer in Data Analysis 1 Statistics: Descriptive and Inferential 2 Variables and Constants 3 The Measurement of Variables
Turning a research question into a statistical question.
 Turning a research question into a statistical question. IGINAL QUESTION: Concept Concept Concept ABOUT ONE CONCEPT ABOUT RELATIONSHIPS BETWEEN CONCEPTS TYPE OF QUESTION: DESCRIBE what s going on? DECIDE
Glossary. The ISI glossary of statistical terms provides definitions in a number of different languages:
 Glossary The ISI glossary of statistical terms provides definitions in a number of different languages: http://isi.cbs.nl/glossary/index.htm Adjusted r 2 Adjusted R squared measures the proportion of the
3 Joint Distributions 71
 2.2.3 The Normal Distribution 54 2.2.4 The Beta Density 58 2.3 Functions of a Random Variable 58 2.4 Concluding Remarks 64 2.5 Problems 64 3 Joint Distributions 71 3.1 Introduction 71 3.2 Discrete Random
DETAILED CONTENTS PART I INTRODUCTION AND DESCRIPTIVE STATISTICS. 1. Introduction to Statistics
 DETAILED CONTENTS About the Author Preface to the Instructor To the Student How to Use SPSS With This Book PART I INTRODUCTION AND DESCRIPTIVE STATISTICS 1. Introduction to Statistics 1.1 Descriptive and
Small n, σ known or unknown, underlying nongaussian
 READY GUIDE Summary Tables SUMMARY-1: Methods to compute some confidence intervals Parameter of Interest Conditions 95% CI Proportion (π) Large n, p 0 and p 1 Equation 12.11 Small n, any p Figure 12-4
Nemours Biomedical Research Statistics Course. Li Xie Nemours Biostatistics Core October 14, 2014
 Nemours Biomedical Research Statistics Course Li Xie Nemours Biostatistics Core October 14, 2014 Outline Recap Introduction to Logistic Regression Recap Descriptive statistics Variable type Example of
Textbook Examples of. SPSS Procedure
 Textbook s of IBM SPSS Procedures Each SPSS procedure listed below has its own section in the textbook. These sections include a purpose statement that describes the statistical test, identification of
Biost 518 Applied Biostatistics II. Purpose of Statistics. First Stage of Scientific Investigation. Further Stages of Scientific Investigation
 Biost 58 Applied Biostatistics II Scott S. Emerson, M.D., Ph.D. Professor of Biostatistics University of Washington Lecture 5: Review Purpose of Statistics Statistics is about science (Science in the broadest
Transition Passage to Descriptive Statistics 28
 viii Preface xiv chapter 1 Introduction 1 Disciplines That Use Quantitative Data 5 What Do You Mean, Statistics? 6 Statistics: A Dynamic Discipline 8 Some Terminology 9 Problems and Answers 12 Scales of
CHI SQUARE ANALYSIS 8/18/2011 HYPOTHESIS TESTS SO FAR PARAMETRIC VS. NON-PARAMETRIC
 CHI SQUARE ANALYSIS I N T R O D U C T I O N T O N O N - P A R A M E T R I C A N A L Y S E S HYPOTHESIS TESTS SO FAR We ve discussed One-sample t-test Dependent Sample t-tests Independent Samples t-tests
Stat 5101 Lecture Notes
 Stat 5101 Lecture Notes Charles J. Geyer Copyright 1998, 1999, 2000, 2001 by Charles J. Geyer May 7, 2001 ii Stat 5101 (Geyer) Course Notes Contents 1 Random Variables and Change of Variables 1 1.1 Random
Chapter 1 Statistical Inference
 Chapter 1 Statistical Inference causal inference To infer causality, you need a randomized experiment (or a huge observational study and lots of outside information). inference to populations Generalizations
Hypothesis testing, part 2. With some material from Howard Seltman, Blase Ur, Bilge Mutlu, Vibha Sazawal
 Hypothesis testing, part 2 With some material from Howard Seltman, Blase Ur, Bilge Mutlu, Vibha Sazawal 1 CATEGORICAL IV, NUMERIC DV 2 Independent samples, one IV # Conditions Normal/Parametric Non-parametric
Exam details. Final Review Session. Things to Review
 Exam details Final Review Session Short answer, similar to book problems Formulae and tables will be given You CAN use a calculator Date and Time: Dec. 7, 006, 1-1:30 pm Location: Osborne Centre, Unit
Unit 14: Nonparametric Statistical Methods
 Unit 14: Nonparametric Statistical Methods Statistics 571: Statistical Methods Ramón V. León 8/8/2003 Unit 14 - Stat 571 - Ramón V. León 1 Introductory Remarks Most methods studied so far have been based
CHAPTER 17 CHI-SQUARE AND OTHER NONPARAMETRIC TESTS FROM: PAGANO, R. R. (2007)
") FROM: PAGANO, R. R. (007) I. INTRODUCTION: DISTINCTION BETWEEN PARAMETRIC AND NON-PARAMETRIC TESTS Statistical inference tests are often classified as to whether they are parametric or nonparametric Parameter
FROM: PAGANO, R. R. (007) I. INTRODUCTION: DISTINCTION BETWEEN PARAMETRIC AND NON-PARAMETRIC TESTS Statistical inference tests are often classified as to whether they are parametric or nonparametric Parameter
Nonparametric Statistics
 Nonparametric Statistics Nonparametric or Distribution-free statistics: used when data are ordinal (i.e., rankings) used when ratio/interval data are not normally distributed (data are converted to ranks)
Statistics in medicine
 Statistics in medicine Lecture 4: and multivariable regression Fatma Shebl, MD, MS, MPH, PhD Assistant Professor Chronic Disease Epidemiology Department Yale School of Public Health Fatma.shebl@yale.edu
APPENDIX B Sample-Size Calculation Methods: Classical Design
 APPENDIX B Sample-Size Calculation Methods: Classical Design One/Paired - Sample Hypothesis Test for the Mean Sign test for median difference for a paired sample Wilcoxon signed - rank test for one or
Foundations of Probability and Statistics
 Foundations of Probability and Statistics William C. Rinaman Le Moyne College Syracuse, New York Saunders College Publishing Harcourt Brace College Publishers Fort Worth Philadelphia San Diego New York
Basic Statistical Analysis
 indexerrt.qxd 8/21/2002 9:47 AM Page 1 Corrected index pages for Sprinthall Basic Statistical Analysis Seventh Edition indexerrt.qxd 8/21/2002 9:47 AM Page 656 Index Abscissa, 24 AB-STAT, vii ADD-OR rule,
Semiparametric Regression
 Semiparametric Regression Patrick Breheny October 22 Patrick Breheny Survival Data Analysis (BIOS 7210) 1/23 Introduction Over the past few weeks, we ve introduced a variety of regression models under
STATISTICS ( CODE NO. 08 ) PAPER I PART - I
 PAPER I PART - I") STATISTICS ( CODE NO. 08 ) PAPER I PART - I 1. Descriptive Statistics Types of data - Concepts of a Statistical population and sample from a population ; qualitative and quantitative data ; nominal and
STATISTICS ( CODE NO. 08 ) PAPER I PART - I 1. Descriptive Statistics Types of data - Concepts of a Statistical population and sample from a population ; qualitative and quantitative data ; nominal and
Dr. Maddah ENMG 617 EM Statistics 10/12/12. Nonparametric Statistics (Chapter 16, Hines)
") Dr. Maddah ENMG 617 EM Statistics 10/12/12 Nonparametric Statistics (Chapter 16, Hines) Introduction Most of the hypothesis testing presented so far assumes normally distributed data. These approaches
Dr. Maddah ENMG 617 EM Statistics 10/12/12 Nonparametric Statistics (Chapter 16, Hines) Introduction Most of the hypothesis testing presented so far assumes normally distributed data. These approaches
Intuitive Biostatistics: Choosing a statistical test
 pagina 1 van 5 < BACK Intuitive Biostatistics: Choosing a statistical This is chapter 37 of Intuitive Biostatistics (ISBN 0-19-508607-4) by Harvey Motulsky. Copyright 1995 by Oxfd University Press Inc.
Subject CS1 Actuarial Statistics 1 Core Principles
 Institute of Actuaries of India Subject CS1 Actuarial Statistics 1 Core Principles For 2019 Examinations Aim The aim of the Actuarial Statistics 1 subject is to provide a grounding in mathematical and
TABLE OF CONTENTS CHAPTER 1 COMBINATORIAL PROBABILITY 1
 TABLE OF CONTENTS CHAPTER 1 COMBINATORIAL PROBABILITY 1 1.1 The Probability Model...1 1.2 Finite Discrete Models with Equally Likely Outcomes...5 1.2.1 Tree Diagrams...6 1.2.2 The Multiplication Principle...8
Chapter 15: Nonparametric Statistics Section 15.1: An Overview of Nonparametric Statistics
 Section 15.1: An Overview of Nonparametric Statistics Understand Difference between Parametric and Nonparametric Statistical Procedures Parametric statistical procedures inferential procedures that rely
Survival Analysis Math 434 Fall 2011
 Survival Analysis Math 434 Fall 2011 Part IV: Chap. 8,9.2,9.3,11: Semiparametric Proportional Hazards Regression Jimin Ding Math Dept. www.math.wustl.edu/ jmding/math434/fall09/index.html Basic Model Setup
Review of Statistics 101
 Review of Statistics 101 We review some important themes from the course 1. Introduction Statistics- Set of methods for collecting/analyzing data (the art and science of learning from data). Provides methods
HYPOTHESIS TESTING II TESTS ON MEANS. Sorana D. Bolboacă
 HYPOTHESIS TESTING II TESTS ON MEANS Sorana D. Bolboacă OBJECTIVES Significance value vs p value Parametric vs non parametric tests Tests on means: 1 Dec 14 2 SIGNIFICANCE LEVEL VS. p VALUE Materials and
Contents. Preface to Second Edition Preface to First Edition Abbreviations PART I PRINCIPLES OF STATISTICAL THINKING AND ANALYSIS 1
 Contents Preface to Second Edition Preface to First Edition Abbreviations xv xvii xix PART I PRINCIPLES OF STATISTICAL THINKING AND ANALYSIS 1 1 The Role of Statistical Methods in Modern Industry and Services
* Tuesday 17 January :30-16:30 (2 hours) Recored on ESSE3 General introduction to the course.
 Recored on ESSE3 General introduction to the course.") Name of the course Statistical methods and data analysis Audience The course is intended for students of the first or second year of the Graduate School in Materials Engineering. The aim of the course
Name of the course Statistical methods and data analysis Audience The course is intended for students of the first or second year of the Graduate School in Materials Engineering. The aim of the course
Glossary for the Triola Statistics Series
 Glossary for the Triola Statistics Series Absolute deviation The measure of variation equal to the sum of the deviations of each value from the mean, divided by the number of values Acceptance sampling
Statistics Boot Camp. Dr. Stephanie Lane Institute for Defense Analyses DATAWorks 2018
 Statistics Boot Camp Dr. Stephanie Lane Institute for Defense Analyses DATAWorks 2018 March 21, 2018 Outline of boot camp Summarizing and simplifying data Point and interval estimation Foundations of statistical
Testing Statistical Hypotheses
 E.L. Lehmann Joseph P. Romano Testing Statistical Hypotheses Third Edition 4y Springer Preface vii I Small-Sample Theory 1 1 The General Decision Problem 3 1.1 Statistical Inference and Statistical Decisions
Prerequisite: STATS 7 or STATS 8 or AP90 or (STATS 120A and STATS 120B and STATS 120C). AP90 with a minimum score of 3
. AP90 with a minimum score of 3") University of California, Irvine 2017-2018 1 Statistics (STATS) Courses STATS 5. Seminar in Data Science. 1 Unit. An introduction to the field of Data Science; intended for entering freshman and transfers.
University of California, Irvine 2017-2018 1 Statistics (STATS) Courses STATS 5. Seminar in Data Science. 1 Unit. An introduction to the field of Data Science; intended for entering freshman and transfers.
Parametric versus Nonparametric Statistics-when to use them and which is more powerful? Dr Mahmoud Alhussami
 Parametric versus Nonparametric Statistics-when to use them and which is more powerful? Dr Mahmoud Alhussami Parametric Assumptions The observations must be independent. Dependent variable should be continuous
NON-PARAMETRIC STATISTICS * (http://www.statsoft.com)
") NON-PARAMETRIC STATISTICS * (http://www.statsoft.com) 1. GENERAL PURPOSE 1.1 Brief review of the idea of significance testing To understand the idea of non-parametric statistics (the term non-parametric
NON-PARAMETRIC STATISTICS * (http://www.statsoft.com) 1. GENERAL PURPOSE 1.1 Brief review of the idea of significance testing To understand the idea of non-parametric statistics (the term non-parametric
Non-parametric tests, part A:
 Two types of statistical test: Non-parametric tests, part A: Parametric tests: Based on assumption that the data have certain characteristics or "parameters": Results are only valid if (a) the data are
Sigmaplot di Systat Software
 Sigmaplot di Systat Software SigmaPlot Has Extensive Statistical Analysis Features SigmaPlot is now bundled with SigmaStat as an easy-to-use package for complete graphing and data analysis. The statistical
SPSS Guide For MMI 409
 SPSS Guide For MMI 409 by John Wong March 2012 Preface Hopefully, this document can provide some guidance to MMI 409 students on how to use SPSS to solve many of the problems covered in the D Agostino
Bayesian inference for sample surveys. Roderick Little Module 2: Bayesian models for simple random samples
 Bayesian inference for sample surveys Roderick Little Module : Bayesian models for simple random samples Superpopulation Modeling: Estimating parameters Various principles: least squares, method of moments,
Data are sometimes not compatible with the assumptions of parametric statistical tests (i.e. t-test, regression, ANOVA)
") BSTT523 Pagano & Gauvreau Chapter 13 1 Nonparametric Statistics Data are sometimes not compatible with the assumptions of parametric statistical tests (i.e. t-test, regression, ANOVA) In particular, data
BSTT523 Pagano & Gauvreau Chapter 13 1 Nonparametric Statistics Data are sometimes not compatible with the assumptions of parametric statistical tests (i.e. t-test, regression, ANOVA) In particular, data
Statistical. Psychology
 SEVENTH у *i km m it* & П SB Й EDITION Statistical M e t h o d s for Psychology D a v i d C. Howell University of Vermont ; \ WADSWORTH f% CENGAGE Learning* Australia Biaall apan Korea Меяко Singapore
N Utilization of Nursing Research in Advanced Practice, Summer 2008
 University of Michigan Deep Blue deepblue.lib.umich.edu 2008-07 536 - Utilization of ursing Research in Advanced Practice, Summer 2008 Tzeng, Huey-Ming Tzeng, H. (2008, ctober 1). Utilization of ursing
Lecture 7: Hypothesis Testing and ANOVA
 Lecture 7: Hypothesis Testing and ANOVA Goals Overview of key elements of hypothesis testing Review of common one and two sample tests Introduction to ANOVA Hypothesis Testing The intent of hypothesis
STATS 200: Introduction to Statistical Inference. Lecture 29: Course review
 STATS 200: Introduction to Statistical Inference Lecture 29: Course review Course review We started in Lecture 1 with a fundamental assumption: Data is a realization of a random process. The goal throughout
Statistics in medicine
 Statistics in medicine Lecture 3: Bivariate association : Categorical variables Proportion in one group One group is measured one time: z test Use the z distribution as an approximation to the binomial
Correlation and Simple Linear Regression
 Correlation and Simple Linear Regression Sasivimol Rattanasiri, Ph.D Section for Clinical Epidemiology and Biostatistics Ramathibodi Hospital, Mahidol University E-mail: sasivimol.rat@mahidol.ac.th 1 Outline
My data doesn t look like that..
 Testing assumptions My data doesn t look like that.. We have made a big deal about testing model assumptions each week. Bill Pine Testing assumptions Testing assumptions We have made a big deal about testing
GROUPED DATA E.G. FOR SAMPLE OF RAW DATA (E.G. 4, 12, 7, 5, MEAN G x / n STANDARD DEVIATION MEDIAN AND QUARTILES STANDARD DEVIATION
 FOR SAMPLE OF RAW DATA (E.G. 4, 1, 7, 5, 11, 6, 9, 7, 11, 5, 4, 7) BE ABLE TO COMPUTE MEAN G / STANDARD DEVIATION MEDIAN AND QUARTILES Σ ( Σ) / 1 GROUPED DATA E.G. AGE FREQ. 0-9 53 10-19 4...... 80-89
General structural model Part 2: Categorical variables and beyond. Psychology 588: Covariance structure and factor models
 General structural model Part 2: Categorical variables and beyond Psychology 588: Covariance structure and factor models Categorical variables 2 Conventional (linear) SEM assumes continuous observed variables
Testing Statistical Hypotheses
 E.L. Lehmann Joseph P. Romano, 02LEu1 ttd ~Lt~S Testing Statistical Hypotheses Third Edition With 6 Illustrations ~Springer 2 The Probability Background 28 2.1 Probability and Measure 28 2.2 Integration.........
ESP 178 Applied Research Methods. 2/23: Quantitative Analysis
 ESP 178 Applied Research Methods 2/23: Quantitative Analysis Data Preparation Data coding create codebook that defines each variable, its response scale, how it was coded Data entry for mail surveys and
NAG Library Chapter Introduction. G08 Nonparametric Statistics
 NAG Library Chapter Introduction G08 Nonparametric Statistics Contents 1 Scope of the Chapter.... 2 2 Background to the Problems... 2 2.1 Parametric and Nonparametric Hypothesis Testing... 2 2.2 Types
Rank-Based Methods. Lukas Meier
 Rank-Based Methods Lukas Meier 20.01.2014 Introduction Up to now we basically always used a parametric family, like the normal distribution N (µ, σ 2 ) for modeling random data. Based on observed data
Final Exam. Name: Solution:
 Final Exam. Name: Instructions. Answer all questions on the exam. Open books, open notes, but no electronic devices. The first 13 problems are worth 5 points each. The rest are worth 1 point each. HW1.
Module 9: Nonparametric Statistics Statistics (OA3102)
") Module 9: Nonparametric Statistics Statistics (OA3102) Professor Ron Fricker Naval Postgraduate School Monterey, California Reading assignment: WM&S chapter 15.1-15.6 Revision: 3-12 1 Goals for this Lecture
Module 9: Nonparametric Statistics Statistics (OA3102) Professor Ron Fricker Naval Postgraduate School Monterey, California Reading assignment: WM&S chapter 15.1-15.6 Revision: 3-12 1 Goals for this Lecture
Algebra Topic Alignment
 Preliminary Topics Absolute Value 9N2 Compare, order and determine equivalent forms for rational and irrational numbers. Factoring Numbers 9N4 Demonstrate fluency in computations using real numbers. Fractions
Introduction to inferential statistics. Alissa Melinger IGK summer school 2006 Edinburgh
 Introduction to inferential statistics Alissa Melinger IGK summer school 2006 Edinburgh Short description Prereqs: I assume no prior knowledge of stats This half day tutorial on statistical analysis will
COPYRIGHTED MATERIAL CONTENTS. Preface Preface to the First Edition
 Preface Preface to the First Edition xi xiii 1 Basic Probability Theory 1 1.1 Introduction 1 1.2 Sample Spaces and Events 3 1.3 The Axioms of Probability 7 1.4 Finite Sample Spaces and Combinatorics 15
Lecture 1. Introduction Statistics Statistical Methods II. Presented January 8, 2018
 Introduction Statistics 211 - Statistical Methods II Presented January 8, 2018 linear models Dan Gillen Department of Statistics University of California, Irvine 1.1 Logistics and Contact Information Lectures:
Non-parametric methods
 Eastern Mediterranean University Faculty of Medicine Biostatistics course Non-parametric methods March 4&7, 2016 Instructor: Dr. Nimet İlke Akçay (ilke.cetin@emu.edu.tr) Learning Objectives 1. Distinguish
Confidence Intervals, Testing and ANOVA Summary
 Confidence Intervals, Testing and ANOVA Summary 1 One Sample Tests 1.1 One Sample z test: Mean (σ known) Let X 1,, X n a r.s. from N(µ, σ) or n > 30. Let The test statistic is H 0 : µ = µ 0. z = x µ 0
CDA Chapter 3 part II
 CDA Chapter 3 part II Two-way tables with ordered classfications Let u 1 u 2... u I denote scores for the row variable X, and let ν 1 ν 2... ν J denote column Y scores. Consider the hypothesis H 0 : X
ECLT 5810 Linear Regression and Logistic Regression for Classification. Prof. Wai Lam
 ECLT 5810 Linear Regression and Logistic Regression for Classification Prof. Wai Lam Linear Regression Models Least Squares Input vectors is an attribute / feature / predictor (independent variable) The
TMA 4275 Lifetime Analysis June 2004 Solution
 TMA 4275 Lifetime Analysis June 2004 Solution Problem 1 a) Observation of the outcome is censored, if the time of the outcome is not known exactly and only the last time when it was observed being intact,
Nonparametric Statistics. Leah Wright, Tyler Ross, Taylor Brown
 Nonparametric Statistics Leah Wright, Tyler Ross, Taylor Brown Before we get to nonparametric statistics, what are parametric statistics? These statistics estimate and test population means, while holding
Non-Parametric Statistics: When Normal Isn t Good Enough"
 Non-Parametric Statistics: When Normal Isn t Good Enough" Professor Ron Fricker" Naval Postgraduate School" Monterey, California" 1/28/13 1 A Bit About Me" Academic credentials" Ph.D. and M.A. in Statistics,
STAT Section 2.1: Basic Inference. Basic Definitions
 STAT 518 --- Section 2.1: Basic Inference Basic Definitions Population: The collection of all the individuals of interest. This collection may be or even. Sample: A collection of elements of the population.
Non-parametric (Distribution-free) approaches p188 CN
 approaches p188 CN") Week 1: Introduction to some nonparametric and computer intensive (re-sampling) approaches: the sign test, Wilcoxon tests and multi-sample extensions, Spearman s rank correlation; the Bootstrap. (ch14
Week 1: Introduction to some nonparametric and computer intensive (re-sampling) approaches: the sign test, Wilcoxon tests and multi-sample extensions, Spearman s rank correlation; the Bootstrap. (ch14
QUANTITATIVE TECHNIQUES
 UNIVERSITY OF CALICUT SCHOOL OF DISTANCE EDUCATION (For B Com. IV Semester & BBA III Semester) COMPLEMENTARY COURSE QUANTITATIVE TECHNIQUES QUESTION BANK 1. The techniques which provide the decision maker
Introduction to Inferential Statistics. Jaranit Kaewkungwal, Ph.D. Faculty of Tropical Medicine Mahidol University
 Introduction to Inferential Statistics Jaranit Kaewkungwal, Ph.D. Faculty of Tropical Medicine Mahidol University 1 Data & Variables 2 Types of Data QUALITATIVE Data expressed by type Data that has been
Institute of Actuaries of India
 Institute of Actuaries of India Subject CT3 Probability and Mathematical Statistics For 2018 Examinations Subject CT3 Probability and Mathematical Statistics Core Technical Syllabus 1 June 2017 Aim The
Introduction to Statistical Inference Lecture 10: ANOVA, Kruskal-Wallis Test
 Introduction to Statistical Inference Lecture 10: ANOVA, Kruskal-Wallis Test la Contents The two sample t-test generalizes into Analysis of Variance. In analysis of variance ANOVA the population consists
Experimental Design and Data Analysis for Biologists
 Experimental Design and Data Analysis for Biologists Gerry P. Quinn Monash University Michael J. Keough University of Melbourne CAMBRIDGE UNIVERSITY PRESS Contents Preface page xv I I Introduction 1 1.1
Semester I BASIC STATISTICS AND PROBABILITY STS1C01
 NAME OF THE DEPARTMENT CODE AND NAME OUTCOMES (POs) SPECIFIC OUTCOMES (PSOs) Department of Statistics PO.1 PO.2 PO.3. PO.4 PO.5 PO.6 PSO.1. PSO.2. PSO.3. PSO.4. PSO. 5. PSO.6. Not Applicable Not Applicable
Preface Introduction to Statistics and Data Analysis Overview: Statistical Inference, Samples, Populations, and Experimental Design The Role of
 Preface Introduction to Statistics and Data Analysis Overview: Statistical Inference, Samples, Populations, and Experimental Design The Role of Probability Sampling Procedures Collection of Data Measures
PSY 307 Statistics for the Behavioral Sciences. Chapter 20 Tests for Ranked Data, Choosing Statistical Tests
 PSY 307 Statistics for the Behavioral Sciences Chapter 20 Tests for Ranked Data, Choosing Statistical Tests What To Do with Non-normal Distributions Tranformations (pg 382): The shape of the distribution
From Practical Data Analysis with JMP, Second Edition. Full book available for purchase here. About This Book... xiii About The Author...
 From Practical Data Analysis with JMP, Second Edition. Full book available for purchase here. Contents About This Book... xiii About The Author... xxiii Chapter 1 Getting Started: Data Analysis with JMP...
Types of Statistical Tests DR. MIKE MARRAPODI
 Types of Statistical Tests DR. MIKE MARRAPODI Tests t tests ANOVA Correlation Regression Multivariate Techniques Non-parametric t tests One sample t test Independent t test Paired sample t test One sample
β j = coefficient of x j in the model; β = ( β1, β2,
 Regression Modeling of Survival Time Data Why regression models? Groups similar except for the treatment under study use the nonparametric methods discussed earlier. Groups differ in variables (covariates)
1.0 Hypothesis Testing
 .0 Hypothesis Testing The Six Steps of Hypothesis Testing Rejecting or Accepting the Null Samples and Data. Parametric Tests for Comparing Two Populations Testing Equality of Population Means (T Test!
Introduction to Statistical Data Analysis III
 Introduction to Statistical Data Analysis III JULY 2011 Afsaneh Yazdani Preface Major branches of Statistics: - Descriptive Statistics - Inferential Statistics Preface What is Inferential Statistics? The
SEVERAL μs AND MEDIANS: MORE ISSUES. Business Statistics
 SEVERAL μs AND MEDIANS: MORE ISSUES Business Statistics CONTENTS Post-hoc analysis ANOVA for 2 groups The equal variances assumption The Kruskal-Wallis test Old exam question Further study POST-HOC ANALYSIS
Model Based Statistics in Biology. Part V. The Generalized Linear Model. Chapter 18.1 Logistic Regression (Dose - Response)
") Model Based Statistics in Biology. Part V. The Generalized Linear Model. Logistic Regression ( - Response) ReCap. Part I (Chapters 1,2,3,4), Part II (Ch 5, 6, 7) ReCap Part III (Ch 9, 10, 11), Part IV
Model Based Statistics in Biology. Part V. The Generalized Linear Model. Logistic Regression ( - Response) ReCap. Part I (Chapters 1,2,3,4), Part II (Ch 5, 6, 7) ReCap Part III (Ch 9, 10, 11), Part IV
Cox s proportional hazards model and Cox s partial likelihood
 Cox s proportional hazards model and Cox s partial likelihood Rasmus Waagepetersen October 12, 2018 1 / 27 Non-parametric vs. parametric Suppose we want to estimate unknown function, e.g. survival function.
Multilevel Statistical Models: 3 rd edition, 2003 Contents
 Multilevel Statistical Models: 3 rd edition, 2003 Contents Preface Acknowledgements Notation Two and three level models. A general classification notation and diagram Glossary Chapter 1 An introduction
PASS Sample Size Software. Poisson Regression
 Chapter 870 Introduction Poisson regression is used when the dependent variable is a count. Following the results of Signorini (99), this procedure calculates power and sample size for testing the hypothesis
Econometric Analysis of Cross Section and Panel Data
 Econometric Analysis of Cross Section and Panel Data Jeffrey M. Wooldridge / The MIT Press Cambridge, Massachusetts London, England Contents Preface Acknowledgments xvii xxiii I INTRODUCTION AND BACKGROUND
An introduction to biostatistics: part 1
 An introduction to biostatistics: part 1 Cavan Reilly September 6, 2017 Table of contents Introduction to data analysis Uncertainty Probability Conditional probability Random variables Discrete random
CIMAT Taller de Modelos de Capture y Recaptura Known Fate Survival Analysis
 CIMAT Taller de Modelos de Capture y Recaptura 2010 Known Fate urvival Analysis B D BALANCE MODEL implest population model N = λ t+ 1 N t Deeper understanding of dynamics can be gained by identifying variation
Marginal versus conditional effects: does it make a difference? Mireille Schnitzer, PhD Université de Montréal
 Marginal versus conditional effects: does it make a difference? Mireille Schnitzer, PhD Université de Montréal Overview In observational and experimental studies, the goal may be to estimate the effect
I i=1 1 I(J 1) j=1 (Y ij Ȳi ) 2. j=1 (Y j Ȳ )2 ] = 2n( is the two-sample t-test statistic.
![I i=1 1 I(J 1) j=1 (Y ij Ȳi ) 2. j=1 (Y j Ȳ )2 ] = 2n( is the two-sample t-test statistic.](/thumbs/85/92729432.jpg "I i=1 1 I(J 1) j=1 (Y ij Ȳi ) 2. j=1 (Y j Ȳ )2 ] = 2n( is the two-sample t-test statistic.") Serik Sagitov, Chalmers and GU, February, 08 Solutions chapter Matlab commands: x = data matrix boxplot(x) anova(x) anova(x) Problem.3 Consider one-way ANOVA test statistic For I = and = n, put F = MS
Serik Sagitov, Chalmers and GU, February, 08 Solutions chapter Matlab commands: x = data matrix boxplot(x) anova(x) anova(x) Problem.3 Consider one-way ANOVA test statistic For I = and = n, put F = MS
STATISTICS SYLLABUS UNIT I
 STATISTICS SYLLABUS UNIT I (Probability Theory) Definition Classical and axiomatic approaches.laws of total and compound probability, conditional probability, Bayes Theorem. Random variable and its distribution
General Regression Model
 Scott S. Emerson, M.D., Ph.D. Department of Biostatistics, University of Washington, Seattle, WA 98195, USA January 5, 2015 Abstract Regression analysis can be viewed as an extension of two sample statistical