Introduction to the Analysis of Variance (ANOVA)
|
|
|
- Julius McKinney
- 6 years ago
- Views:
Transcription

1 Introduction to the Analysis of Variance (ANOVA)
2 The Analysis of Variance (ANOVA) The analysis of variance (ANOVA) is a statistical technique for testing for differences between the means of multiple (more than two) groups It is probably the most prevalent statistical technique used in psychological research. The ANOVA is a flexible technique that can be used with a variety of different research designs. In today s lecture, I will explain the logic behind the ANOVA and introduce the one-way between groups ANOVA, which is an ANOVA in which the groups are defined along only one independent (or quasi-independent) variable
3 The Analysis of Variance The purpose of ANOVA is much the same as the t tests presented in the preceding lectures Are the mean differences obtained for sample data sufficiently large for us to conclude that there are mean differences between the populations from which the samples were obtained The difference between ANOVA and the t tests is that ANOVA can be used in situations where there are two or more means being compared, whereas the t tests are limited to situations where only two means are involved.
4 Instructor 1 Instructor 2 Instructor 3 Populations (µ,σ unknown) Samples
5 The Problem of Multiple Comparisons The ANOVA is necessary to protect researchers from an excessive experimentwise error rate in situations where a study is comparing more than two population means. Experimentwise error rate: the probability of making at least one Type I error across mutliple comparisons These situations would require a series of several t tests to evaluate all of the mean differences. (Remember, a t test can compare only two means at a time) So? Why not just use multiple t-tests?
6 The Problem of Multiple Comparisons Why not just use multiple t-tests? Although each t test can be evaluated using a specific α-level (risk of Type I error), the α-levels accumulate over a series of tests so that the final familywise α-level can be quite large Example: For 5 levels of the independent variable, there are 10 possible pairwise comparisons between group means: {1,2},{1,3},{1,4},{1,5},{2,3},{2,4},{2,5},{3,4},{3,5},{4,5}
7 The Problem of Multiple Comparisons Assume H 0 is true and α=0.05. Then the probability of accepting H 0 in a single pairwise comparison is: P accept single pairwise H However, we have to make 10 such comparisons. Using the multiplicative law of probability (remember that?), and assuming independent pairwise tests, the probability of correctly retaining the null in all 10 comparisons is: accept all P H Therefore, experiment 1 P accept all H We now have a 40% overall chance of making a Type I error! 0

8 Intro to ANOVA
9 Null and Alternative Hypotheses in ANOVAs The omnibus null hypothesis is the null hypothesis in the ANOVA: that the population means of all groups being compared are equal i.e., for three groups, H 0 : μ 1 = μ 2 = μ 3 Alternative Hypothesis: at least one population mean is different from the others.

10 Omnibus Null Hypothesis: µ 1 = µ 2 = µ 3
11 The Logic of the Analysis of Variance The test statistic for ANOVA is an F-ratio, which is a ratio of two sample variances. F variance including any treatment effects variance without any treatment effects MS MS between within In the context of ANOVA, the sample variances are called mean squares, or MS values The numerator, MS between, measures the size of mean differences between samples from different treatment groups The denominator, MS within (or MS error ), measures the magnitude of differences that would be expected without any treatment effects
12 The Logic of the Analysis of Variance Total Variance Between Treatments Variance Measures differences caused by: Systematic treatment effects Sampling error Within Treatments Variance Measures differences caused by: Sampling error
13 Assumptions of the ANOVA Normality of Scores I.e., we assume that the scores in all of our group populations are normally distributed Since this is important primarily for the sampling distribution of the mean, the ANOVA is fairly robust to violations of this assumption, especially if the sample sizes are reasonably large Homogeneity of variances We assume that each population of scores has the same variance E.g., [error variance] ANOVA is fairly robust to violations of this assumption Independence of observations E.g., given the population parameters, knowing one person s score tells you nothing about another person s score. Violations of this assumption can have serious implications for an analysis.
14 The Logic of the ANOVA Regardless of whether or not the null hypothesis is true, the assumption of homogeneity of variances implies that all population variances are equal Thus, as we did for the independent-samples t-test, we can estimate this shared population variance by taking the average of the sample variances (the pooled variance),, s s s n s Avg s1 s s ˆwithi p (assuming n 1 = n 2 = n 3 )
15 The Logic of the ANOVA However, if all the population means are equal (under H 0 ), then we have a second way to estimate the population variance we can estimate the population variance using the variance of the sample means Recall that the Central Limit Theorem tells us how to compute the variance of sample means from the population variance: 2 2 M n We can rearrange this formula to solve for the population variance given the variance of sample means: n 2 2 M
16 The Logic of the ANOVA Of course, we don t have the variance of sample means either. However, we can estimate it by computing the variance of our three group means s Var M, M, M 2 2 ˆM M Plugging this into the previous equation, our second estimate of the population variance is ns 2 2 ˆbetween M
17 The Logic of the ANOVA We now have two estimates of the population variance: An estimate computed from the sample variances, which should estimate the population variance regardless of whether H 0 is true ˆwith,, in s p Avg s1 s2 s 3 A second estimate computed from the sample means, which only estimates the population variance if H 0 is true 2 2 ˆ between nsm nvar M1, M 2, M 3
18 The Logic of the ANOVA The F-ratio used as the test statistic for the ANOVA is simply the ratio between these two estimates of the population variance F 2 MS ˆ 1,, between nvar M M M between MS ˆ within within Avg s1, s2, s 3 If H 0 is true, then these two estimates should be equal (on average) In this case, the ratio should be 1.0 However, if H 0 is false, then the estimate in the numerator (which is based on the variability of sample means) will include the treatment effect in addition to differences in sample means expected by chance In this case, the ratio should be greater than
19 The F distribution reject H 0 retain H 0
20 Populations Samples
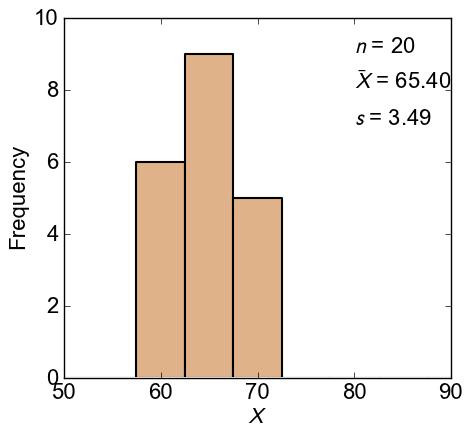
21 The Logic of the ANOVA Sample 1 Sample 2 Sample 3 n = 20 n = 20 n = 20 M = 65.4 M = M = 71.2 s 2 = s 2 = s 2 = M sum M 2 ˆ s 2 2 within p s1 s2 s ns 2 2 ˆbetween M SS n df M M M T SS M nm M n k 3 M M k = ˆbetween 215 F 2 ˆ within
Introduction to the Analysis of Variance (ANOVA) Computing One-Way Independent Measures (Between Subjects) ANOVAs
 Computing One-Way Independent Measures (Between Subjects) ANOVAs") Introduction to the Analysis of Variance (ANOVA) Computing One-Way Independent Measures (Between Subjects) ANOVAs The Analysis of Variance (ANOVA) The analysis of variance (ANOVA) is a statistical technique
Introduction to the Analysis of Variance (ANOVA) Computing One-Way Independent Measures (Between Subjects) ANOVAs The Analysis of Variance (ANOVA) The analysis of variance (ANOVA) is a statistical technique
The One-Way Independent-Samples ANOVA. (For Between-Subjects Designs)
") The One-Way Independent-Samples ANOVA (For Between-Subjects Designs) Computations for the ANOVA In computing the terms required for the F-statistic, we won t explicitly compute any sample variances or
The One-Way Independent-Samples ANOVA (For Between-Subjects Designs) Computations for the ANOVA In computing the terms required for the F-statistic, we won t explicitly compute any sample variances or
Multiple t Tests. Introduction to Analysis of Variance. Experiments with More than 2 Conditions
 Introduction to Analysis of Variance 1 Experiments with More than 2 Conditions Often the research that psychologists perform has more conditions than just the control and experimental conditions You might
COMPARING SEVERAL MEANS: ANOVA
 LAST UPDATED: November 15, 2012 COMPARING SEVERAL MEANS: ANOVA Objectives 2 Basic principles of ANOVA Equations underlying one-way ANOVA Doing a one-way ANOVA in R Following up an ANOVA: Planned contrasts/comparisons
Review. One-way ANOVA, I. What s coming up. Multiple comparisons
 Review One-way ANOVA, I 9.07 /15/00 Earlier in this class, we talked about twosample z- and t-tests for the difference between two conditions of an independent variable Does a trial drug work better than
Difference in two or more average scores in different groups
 ANOVAs Analysis of Variance (ANOVA) Difference in two or more average scores in different groups Each participant tested once Same outcome tested in each group Simplest is one-way ANOVA (one variable as
Sampling Distributions: Central Limit Theorem
 Review for Exam 2 Sampling Distributions: Central Limit Theorem Conceptually, we can break up the theorem into three parts: 1. The mean (µ M ) of a population of sample means (M) is equal to the mean (µ)
10/31/2012. One-Way ANOVA F-test
 PSY 511: Advanced Statistics for Psychological and Behavioral Research 1 1. Situation/hypotheses 2. Test statistic 3.Distribution 4. Assumptions One-Way ANOVA F-test One factor J>2 independent samples
An Old Research Question
 ANOVA An Old Research Question The impact of TV on high-school grade Watch or not watch Two groups The impact of TV hours on high-school grade Exactly how much TV watching would make difference Multiple
Two-Sample Inferential Statistics
 The t Test for Two Independent Samples 1 Two-Sample Inferential Statistics In an experiment there are two or more conditions One condition is often called the control condition in which the treatment is
Hypothesis testing: Steps
 Review for Exam 2 Hypothesis testing: Steps Repeated-Measures ANOVA 1. Determine appropriate test and hypotheses 2. Use distribution table to find critical statistic value(s) representing rejection region
Hypothesis testing: Steps
 Review for Exam 2 Hypothesis testing: Steps Exam 2 Review 1. Determine appropriate test and hypotheses 2. Use distribution table to find critical statistic value(s) representing rejection region 3. Compute
Analysis of Variance (ANOVA)
") Analysis of Variance (ANOVA) Two types of ANOVA tests: Independent measures and Repeated measures Comparing 2 means: X 1 = 20 t - test X 2 = 30 How can we Compare 3 means?: X 1 = 20 X 2 = 30 X 3 = 35 ANOVA
Analysis of Variance (ANOVA) Two types of ANOVA tests: Independent measures and Repeated measures Comparing 2 means: X 1 = 20 t - test X 2 = 30 How can we Compare 3 means?: X 1 = 20 X 2 = 30 X 3 = 35 ANOVA
The t-test: A z-score for a sample mean tells us where in the distribution the particular mean lies
 The t-test: So Far: Sampling distribution benefit is that even if the original population is not normal, a sampling distribution based on this population will be normal (for sample size > 30). Benefit
Multiple Comparisons
 Multiple Comparisons Error Rates, A Priori Tests, and Post-Hoc Tests Multiple Comparisons: A Rationale Multiple comparison tests function to tease apart differences between the groups within our IV when
Comparing Several Means: ANOVA
 Comparing Several Means: ANOVA Understand the basic principles of ANOVA Why it is done? What it tells us? Theory of one way independent ANOVA Following up an ANOVA: Planned contrasts/comparisons Choosing
COMPLETELY RANDOM DESIGN (CRD) -Design can be used when experimental units are essentially homogeneous.
 -Design can be used when experimental units are essentially homogeneous.") COMPLETELY RANDOM DESIGN (CRD) Description of the Design -Simplest design to use. -Design can be used when experimental units are essentially homogeneous. -Because of the homogeneity requirement, it may
COMPLETELY RANDOM DESIGN (CRD) Description of the Design -Simplest design to use. -Design can be used when experimental units are essentially homogeneous. -Because of the homogeneity requirement, it may
One-Way ANOVA Cohen Chapter 12 EDUC/PSY 6600
 One-Way ANOVA Cohen Chapter 1 EDUC/PSY 6600 1 It is easy to lie with statistics. It is hard to tell the truth without statistics. -Andrejs Dunkels Motivating examples Dr. Vito randomly assigns 30 individuals
Keppel, G. & Wickens, T.D. Design and Analysis Chapter 2: Sources of Variability and Sums of Squares
 Keppel, G. & Wickens, T.D. Design and Analysis Chapter 2: Sources of Variability and Sums of Squares K&W introduce the notion of a simple experiment with two conditions. Note that the raw data (p. 16)
Note: k = the # of conditions n = # of data points in a condition N = total # of data points
 The ANOVA for2 Dependent Groups -- Analysis of 2-Within (or Matched)-Group Data with a Quantitative Response Variable Application: This statistic has two applications that can appear very different, but
ANOVA TESTING 4STEPS. 1. State the hypothesis. : H 0 : µ 1 =
 Introduction to Statistics in Psychology PSY 201 Professor Greg Francis Lecture 35 ANalysis Of VAriance Ignoring (some) variability TESTING 4STEPS 1. State the hypothesis. : H 0 : µ 1 = µ 2 =... = µ K,
PSYC 331 STATISTICS FOR PSYCHOLOGISTS
 PSYC 331 STATISTICS FOR PSYCHOLOGISTS Session 4 A PARAMETRIC STATISTICAL TEST FOR MORE THAN TWO POPULATIONS Lecturer: Dr. Paul Narh Doku, Dept of Psychology, UG Contact Information: pndoku@ug.edu.gh College
Your schedule of coming weeks. One-way ANOVA, II. Review from last time. Review from last time /22/2004. Create ANOVA table
 Your schedule of coming weeks One-way ANOVA, II 9.07 //00 Today: One-way ANOVA, part II Next week: Two-way ANOVA, parts I and II. One-way ANOVA HW due Thursday Week of May Teacher out of town all week
CHAPTER 17 CHI-SQUARE AND OTHER NONPARAMETRIC TESTS FROM: PAGANO, R. R. (2007)
") FROM: PAGANO, R. R. (007) I. INTRODUCTION: DISTINCTION BETWEEN PARAMETRIC AND NON-PARAMETRIC TESTS Statistical inference tests are often classified as to whether they are parametric or nonparametric Parameter
FROM: PAGANO, R. R. (007) I. INTRODUCTION: DISTINCTION BETWEEN PARAMETRIC AND NON-PARAMETRIC TESTS Statistical inference tests are often classified as to whether they are parametric or nonparametric Parameter
HYPOTHESIS TESTING. Hypothesis Testing
 MBA 605 Business Analytics Don Conant, PhD. HYPOTHESIS TESTING Hypothesis testing involves making inferences about the nature of the population on the basis of observations of a sample drawn from the population.
Contrasts and Multiple Comparisons Supplement for Pages
 Contrasts and Multiple Comparisons Supplement for Pages 302-323 Brian Habing University of South Carolina Last Updated: July 20, 2001 The F-test from the ANOVA table allows us to test the null hypothesis
One-way Analysis of Variance. Major Points. T-test. Ψ320 Ainsworth
 One-way Analysis of Variance Ψ30 Ainsworth Major Points Problem with t-tests and multiple groups The logic behind ANOVA Calculations Multiple comparisons Assumptions of analysis of variance Effect Size
8/23/2018. One-Way ANOVA F-test. 1. Situation/hypotheses. 2. Test statistic. 3.Distribution. 4. Assumptions
 PSY 5101: Advanced Statistics for Psychological and Behavioral Research 1 1. Situation/hypotheses 2. Test statistic One-Way ANOVA F-test One factor J>2 independent samples H o :µ 1 µ 2 µ J F 3.Distribution
Sampling distribution of t. 2. Sampling distribution of t. 3. Example: Gas mileage investigation. II. Inferential Statistics (8) t =
 t =") 2. The distribution of t values that would be obtained if a value of t were calculated for each sample mean for all possible random of a given size from a population _ t ratio: (X - µ hyp ) t s x The result
2. The distribution of t values that would be obtained if a value of t were calculated for each sample mean for all possible random of a given size from a population _ t ratio: (X - µ hyp ) t s x The result
The legacy of Sir Ronald A. Fisher. Fisher s three fundamental principles: local control, replication, and randomization.
 1 Chapter 1: Research Design Principles The legacy of Sir Ronald A. Fisher. Fisher s three fundamental principles: local control, replication, and randomization. 2 Chapter 2: Completely Randomized Design
LECTURE 5. Introduction to Econometrics. Hypothesis testing
 LECTURE 5 Introduction to Econometrics Hypothesis testing October 18, 2016 1 / 26 ON TODAY S LECTURE We are going to discuss how hypotheses about coefficients can be tested in regression models We will
N J SS W /df W N - 1
 One-Way ANOVA Source Table ANOVA MODEL: ij = µ* + α j + ε ij H 0 : µ = µ =... = µ j or H 0 : Σα j = 0 Source Sum of Squares df Mean Squares F J Between Groups nj( j * ) J - SS B /(J ) MS B /MS W = ( N
In a one-way ANOVA, the total sums of squares among observations is partitioned into two components: Sums of squares represent:
 Activity #10: AxS ANOVA (Repeated subjects design) Resources: optimism.sav So far in MATH 300 and 301, we have studied the following hypothesis testing procedures: 1) Binomial test, sign-test, Fisher s
The One-Way Repeated-Measures ANOVA. (For Within-Subjects Designs)
") The One-Way Repeated-Measures ANOVA (For Within-Subjects Designs) Logic of the Repeated-Measures ANOVA The repeated-measures ANOVA extends the analysis of variance to research situations using repeated-measures
The One-Way Repeated-Measures ANOVA (For Within-Subjects Designs) Logic of the Repeated-Measures ANOVA The repeated-measures ANOVA extends the analysis of variance to research situations using repeated-measures
Review of Statistics 101
 Review of Statistics 101 We review some important themes from the course 1. Introduction Statistics- Set of methods for collecting/analyzing data (the art and science of learning from data). Provides methods
psyc3010 lecture 2 factorial between-ps ANOVA I: omnibus tests
 psyc3010 lecture 2 factorial between-ps ANOVA I: omnibus tests last lecture: introduction to factorial designs next lecture: factorial between-ps ANOVA II: (effect sizes and follow-up tests) 1 general
One-way between-subjects ANOVA. Comparing three or more independent means
 One-way between-subjects ANOVA Comparing three or more independent means Data files SpiderBG.sav Attractiveness.sav Homework: sourcesofself-esteem.sav ANOVA: A Framework Understand the basic principles
Variance Estimates and the F Ratio. ERSH 8310 Lecture 3 September 2, 2009
 Variance Estimates and the F Ratio ERSH 8310 Lecture 3 September 2, 2009 Today s Class Completing the analysis (the ANOVA table) Evaluating the F ratio Errors in hypothesis testing A complete numerical
Psychology 282 Lecture #4 Outline Inferences in SLR
 Psychology 282 Lecture #4 Outline Inferences in SLR Assumptions To this point we have not had to make any distributional assumptions. Principle of least squares requires no assumptions. Can use correlations
COSC 341 Human Computer Interaction. Dr. Bowen Hui University of British Columbia Okanagan
 COSC 341 Human Computer Interaction Dr. Bowen Hui University of British Columbia Okanagan 1 Last Class Introduced hypothesis testing Core logic behind it Determining results significance in scenario when:
Statistical methods for comparing multiple groups. Lecture 7: ANOVA. ANOVA: Definition. ANOVA: Concepts
 Statistical methods for comparing multiple groups Lecture 7: ANOVA Sandy Eckel seckel@jhsph.edu 30 April 2008 Continuous data: comparing multiple means Analysis of variance Binary data: comparing multiple
Chapter Seven: Multi-Sample Methods 1/52
 Chapter Seven: Multi-Sample Methods 1/52 7.1 Introduction 2/52 Introduction The independent samples t test and the independent samples Z test for a difference between proportions are designed to analyze
An inferential procedure to use sample data to understand a population Procedures
 Hypothesis Test An inferential procedure to use sample data to understand a population Procedures Hypotheses, the alpha value, the critical region (z-scores), statistics, conclusion Two types of errors
Calculating Fobt for all possible combinations of variances for each sample Calculating the probability of (F) for each different value of Fobt
 for each different value of Fobt") PSY 305 Module 5-A AVP Transcript During the past two modules, you have been introduced to inferential statistics. We have spent time on z-tests and the three types of t-tests. We are now ready to move
PSY 305 Module 5-A AVP Transcript During the past two modules, you have been introduced to inferential statistics. We have spent time on z-tests and the three types of t-tests. We are now ready to move
One-Way ANOVA. Some examples of when ANOVA would be appropriate include:
 One-Way ANOVA 1. Purpose Analysis of variance (ANOVA) is used when one wishes to determine whether two or more groups (e.g., classes A, B, and C) differ on some outcome of interest (e.g., an achievement
Analysis of Variance
 Statistical Techniques II EXST7015 Analysis of Variance 15a_ANOVA_Introduction 1 Design The simplest model for Analysis of Variance (ANOVA) is the CRD, the Completely Randomized Design This model is also
One-Way Analysis of Variance. With regression, we related two quantitative, typically continuous variables.
 One-Way Analysis of Variance With regression, we related two quantitative, typically continuous variables. Often we wish to relate a quantitative response variable with a qualitative (or simply discrete)
Using SPSS for One Way Analysis of Variance
 Using SPSS for One Way Analysis of Variance This tutorial will show you how to use SPSS version 12 to perform a one-way, between- subjects analysis of variance and related post-hoc tests. This tutorial
One-Way ANOVA Source Table J - 1 SS B / J - 1 MS B /MS W. Pairwise Post-Hoc Comparisons of Means
 One-Way ANOVA Source Table ANOVA MODEL: ij = µ* + α j + ε ij H 0 : µ 1 = µ =... = µ j or H 0 : Σα j = 0 Source Sum of Squares df Mean Squares F Between Groups n j ( j - * ) J - 1 SS B / J - 1 MS B /MS
Extending the Robust Means Modeling Framework. Alyssa Counsell, Phil Chalmers, Matt Sigal, Rob Cribbie
 Extending the Robust Means Modeling Framework Alyssa Counsell, Phil Chalmers, Matt Sigal, Rob Cribbie One-way Independent Subjects Design Model: Y ij = µ + τ j + ε ij, j = 1,, J Y ij = score of the ith
Lecture 5: ANOVA and Correlation
 Lecture 5: ANOVA and Correlation Ani Manichaikul amanicha@jhsph.edu 23 April 2007 1 / 62 Comparing Multiple Groups Continous data: comparing means Analysis of variance Binary data: comparing proportions
Econometrics. 4) Statistical inference
 Statistical inference") 30C00200 Econometrics 4) Statistical inference Timo Kuosmanen Professor, Ph.D. http://nomepre.net/index.php/timokuosmanen Today s topics Confidence intervals of parameter estimates Student s t-distribution
30C00200 Econometrics 4) Statistical inference Timo Kuosmanen Professor, Ph.D. http://nomepre.net/index.php/timokuosmanen Today s topics Confidence intervals of parameter estimates Student s t-distribution
DESIGNING EXPERIMENTS AND ANALYZING DATA A Model Comparison Perspective
 DESIGNING EXPERIMENTS AND ANALYZING DATA A Model Comparison Perspective Second Edition Scott E. Maxwell Uniuersity of Notre Dame Harold D. Delaney Uniuersity of New Mexico J,t{,.?; LAWRENCE ERLBAUM ASSOCIATES,
ANOVA 3/12/2012. Two reasons for using ANOVA. Type I Error and Multiple Tests. Review Independent Samples t test
 // ANOVA Lectures - Readings: GW Review Independent Samples t test Placeo Treatment 7 7 7 Mean... Review Independent Samples t test Placeo Treatment 7 7 7 Mean.. t (). p. C. I.: p t tcrit s pt crit s t
One-way ANOVA. Experimental Design. One-way ANOVA
 Method to compare more than two samples simultaneously without inflating Type I Error rate (α) Simplicity Few assumptions Adequate for highly complex hypothesis testing 09/30/12 1 Outline of this class
MULTIPLE REGRESSION AND ISSUES IN REGRESSION ANALYSIS
 MULTIPLE REGRESSION AND ISSUES IN REGRESSION ANALYSIS Page 1 MSR = Mean Regression Sum of Squares MSE = Mean Squared Error RSS = Regression Sum of Squares SSE = Sum of Squared Errors/Residuals α = Level
Rejection regions for the bivariate case
 Rejection regions for the bivariate case The rejection region for the T 2 test (and similarly for Z 2 when Σ is known) is the region outside of an ellipse, for which there is a (1-α)% chance that the test
H0: Tested by k-grp ANOVA
 Pairwise Comparisons ANOVA for multiple condition designs Pairwise comparisons and RH Testing Alpha inflation & Correction LSD & HSD procedures Alpha estimation reconsidered H0: Tested by k-grp ANOVA Regardless
BIOL Biometry LAB 6 - SINGLE FACTOR ANOVA and MULTIPLE COMPARISON PROCEDURES
 BIOL 458 - Biometry LAB 6 - SINGLE FACTOR ANOVA and MULTIPLE COMPARISON PROCEDURES PART 1: INTRODUCTION TO ANOVA Purpose of ANOVA Analysis of Variance (ANOVA) is an extremely useful statistical method
H0: Tested by k-grp ANOVA
 Analyses of K-Group Designs : Omnibus F, Pairwise Comparisons & Trend Analyses ANOVA for multiple condition designs Pairwise comparisons and RH Testing Alpha inflation & Correction LSD & HSD procedures
T.I.H.E. IT 233 Statistics and Probability: Sem. 1: 2013 ESTIMATION AND HYPOTHESIS TESTING OF TWO POPULATIONS
 ESTIMATION AND HYPOTHESIS TESTING OF TWO POPULATIONS In our work on hypothesis testing, we used the value of a sample statistic to challenge an accepted value of a population parameter. We focused only
Design of Experiments. Factorial experiments require a lot of resources
 Design of Experiments Factorial experiments require a lot of resources Sometimes real-world practical considerations require us to design experiments in specialized ways. The design of an experiment is
df=degrees of freedom = n - 1
 One sample t-test test of the mean Assumptions: Independent, random samples Approximately normal distribution (from intro class: σ is unknown, need to calculate and use s (sample standard deviation)) Hypotheses:
One-way between-subjects ANOVA. Comparing three or more independent means
 One-way between-subjects ANOVA Comparing three or more independent means ANOVA: A Framework Understand the basic principles of ANOVA Why it is done? What it tells us? Theory of one-way between-subjects
WELCOME! Lecture 13 Thommy Perlinger
 Quantitative Methods II WELCOME! Lecture 13 Thommy Perlinger Parametrical tests (tests for the mean) Nature and number of variables One-way vs. two-way ANOVA One-way ANOVA Y X 1 1 One dependent variable
Multiple Comparison Procedures Cohen Chapter 13. For EDUC/PSY 6600
 Multiple Comparison Procedures Cohen Chapter 13 For EDUC/PSY 6600 1 We have to go to the deductions and the inferences, said Lestrade, winking at me. I find it hard enough to tackle facts, Holmes, without
Analysis of Variance and Contrasts
 Analysis of Variance and Contrasts Ken Kelley s Class Notes 1 / 103 Lesson Breakdown by Topic 1 Goal of Analysis of Variance A Conceptual Example Appropriate for ANOVA Example F -Test for Independent Variances
Lecture 11: Two Way Analysis of Variance
 Lecture 11: Two Way Analysis of Variance Review: Hypothesis Testing o ANOVA/F ratio: comparing variances o F = s variance between treatment effect + chance s variance within sampling error (chance effects)
ANOVA Analysis of Variance
 ANOVA Analysis of Variance ANOVA Analysis of Variance Extends independent samples t test ANOVA Analysis of Variance Extends independent samples t test Compares the means of groups of independent observations
INTRODUCTION TO ANALYSIS OF VARIANCE
 CHAPTER 22 INTRODUCTION TO ANALYSIS OF VARIANCE Chapter 18 on inferences about population means illustrated two hypothesis testing situations: for one population mean and for the difference between two
HYPOTHESIS TESTING SAMPLING DISTRIBUTION. the sampling distribution for di erences of means is. 2 is known. normal if.
 Introduction to Statistics in Psychology PSY Professor Greg Francis Lecture 5 Hypothesis testing for two sample case Why do we let people die? H : µ = a H a : µ 6= a H : = a H a : 6= a always compare one-sample
Lecture 3: Inference in SLR
 Lecture 3: Inference in SLR STAT 51 Spring 011 Background Reading KNNL:.1.6 3-1 Topic Overview This topic will cover: Review of hypothesis testing Inference about 1 Inference about 0 Confidence Intervals
Statistics Introductory Correlation
 Statistics Introductory Correlation Session 10 oscardavid.barrerarodriguez@sciencespo.fr April 9, 2018 Outline 1 Statistics are not used only to describe central tendency and variability for a single variable.
Introduction to Business Statistics QM 220 Chapter 12
 Department of Quantitative Methods & Information Systems Introduction to Business Statistics QM 220 Chapter 12 Dr. Mohammad Zainal 12.1 The F distribution We already covered this topic in Ch. 10 QM-220,
1 Descriptive statistics. 2 Scores and probability distributions. 3 Hypothesis testing and one-sample t-test. 4 More on t-tests
 Overall Overview INFOWO Statistics lecture S3: Hypothesis testing Peter de Waal Department of Information and Computing Sciences Faculty of Science, Universiteit Utrecht 1 Descriptive statistics 2 Scores
Lectures 5 & 6: Hypothesis Testing
 Lectures 5 & 6: Hypothesis Testing in which you learn to apply the concept of statistical significance to OLS estimates, learn the concept of t values, how to use them in regression work and come across
One-factor analysis of variance (ANOVA)
") One-factor analysis of variance (ANOVA) March 1, 2017 psych10.stanford.edu Announcements / Action Items Schedule update: final R lab moved to Week 10 Optional Survey 5 coming soon, due on Saturday Last
One-factor analysis of variance (ANOVA) March 1, 2017 psych10.stanford.edu Announcements / Action Items Schedule update: final R lab moved to Week 10 Optional Survey 5 coming soon, due on Saturday Last
Hypothesis T e T sting w ith with O ne O One-Way - ANOV ANO A V Statistics Arlo Clark Foos -
 Hypothesis Testing with One-Way ANOVA Statistics Arlo Clark-Foos Conceptual Refresher 1. Standardized z distribution of scores and of means can be represented as percentile rankings. 2. t distribution
Analysis of variance (ANOVA) Comparing the means of more than two groups
 Comparing the means of more than two groups") Analysis of variance (ANOVA) Comparing the means of more than two groups Example: Cost of mating in male fruit flies Drosophila Treatments: place males with and without unmated (virgin) females Five treatments
Analysis of variance (ANOVA) Comparing the means of more than two groups Example: Cost of mating in male fruit flies Drosophila Treatments: place males with and without unmated (virgin) females Five treatments
Single Sample Means. SOCY601 Alan Neustadtl
 Single Sample Means SOCY601 Alan Neustadtl The Central Limit Theorem If we have a population measured by a variable with a mean µ and a standard deviation σ, and if all possible random samples of size
Lecture 28. Ingo Ruczinski. December 3, Department of Biostatistics Johns Hopkins Bloomberg School of Public Health Johns Hopkins University
 Lecture 28 Department of Biostatistics Johns Hopkins Bloomberg School of Public Health Johns Hopkins University December 3, 2015 1 2 3 4 5 1 Familywise error rates 2 procedure 3 Performance of with multiple
Data analysis and Geostatistics - lecture VII
 Data analysis and Geostatistics - lecture VII t-tests, ANOVA and goodness-of-fit Statistical testing - significance of r Testing the significance of the correlation coefficient: t = r n - 2 1 - r 2 with
Introduction to Analysis of Variance. Chapter 11
 Introduction to Analysis of Variance Chapter 11 Review t-tests Single-sample t-test Independent samples t-test Related or paired-samples t-test s m M t ) ( 1 1 ) ( m m s M M t M D D D s M t n s s M 1 )
Multiple Regression Analysis
 Multiple Regression Analysis y = β 0 + β 1 x 1 + β 2 x 2 +... β k x k + u 2. Inference 0 Assumptions of the Classical Linear Model (CLM)! So far, we know: 1. The mean and variance of the OLS estimators
What Does the F-Ratio Tell Us?
 Planned Comparisons What Does the F-Ratio Tell Us? The F-ratio (called an omnibus or overall F) provides a test of whether or not there a treatment effects in an experiment A significant F-ratio suggests
Unit 12: Analysis of Single Factor Experiments
 Unit 12: Analysis of Single Factor Experiments Statistics 571: Statistical Methods Ramón V. León 7/16/2004 Unit 12 - Stat 571 - Ramón V. León 1 Introduction Chapter 8: How to compare two treatments. Chapter
1. What does the alternate hypothesis ask for a one-way between-subjects analysis of variance?
 1. What does the alternate hypothesis ask for a one-way between-subjects analysis of variance? 2. What is the difference between between-group variability and within-group variability? 3. What does between-group
Sociology 6Z03 Review II
 Sociology 6Z03 Review II John Fox McMaster University Fall 2016 John Fox (McMaster University) Sociology 6Z03 Review II Fall 2016 1 / 35 Outline: Review II Probability Part I Sampling Distributions Probability
Chapter 14: Repeated-measures designs
 Chapter 14: Repeated-measures designs Oliver Twisted Please, Sir, can I have some more sphericity? The following article is adapted from: Field, A. P. (1998). A bluffer s guide to sphericity. Newsletter
CIVL /8904 T R A F F I C F L O W T H E O R Y L E C T U R E - 8
 CIVL - 7904/8904 T R A F F I C F L O W T H E O R Y L E C T U R E - 8 Chi-square Test How to determine the interval from a continuous distribution I = Range 1 + 3.322(logN) I-> Range of the class interval
Unit 27 One-Way Analysis of Variance
 Unit 27 One-Way Analysis of Variance Objectives: To perform the hypothesis test in a one-way analysis of variance for comparing more than two population means Recall that a two sample t test is applied
Independent Samples ANOVA
 Independent Samples ANOVA In this example students were randomly assigned to one of three mnemonics (techniques for improving memory) rehearsal (the control group; simply repeat the words), visual imagery
These are all actually contrasts (the coef sum to zero). What are these contrasts representing? What would make them large?
. What are these contrasts representing? What would make them large?") Lecture 12 Comparing treatment effects Orthogonal Contrasts What use are contrasts? Recall the Cotton data In this case, the treatment levels have an ordering to them this is not always the case) Consider
Lecture 12 Comparing treatment effects Orthogonal Contrasts What use are contrasts? Recall the Cotton data In this case, the treatment levels have an ordering to them this is not always the case) Consider
MANOVA is an extension of the univariate ANOVA as it involves more than one Dependent Variable (DV). The following are assumptions for using MANOVA:
. The following are assumptions for using MANOVA:") MULTIVARIATE ANALYSIS OF VARIANCE MANOVA is an extension of the univariate ANOVA as it involves more than one Dependent Variable (DV). The following are assumptions for using MANOVA: 1. Cell sizes : o
MULTIVARIATE ANALYSIS OF VARIANCE MANOVA is an extension of the univariate ANOVA as it involves more than one Dependent Variable (DV). The following are assumptions for using MANOVA: 1. Cell sizes : o
Hypothesis Testing. Hypothesis: conjecture, proposition or statement based on published literature, data, or a theory that may or may not be true
 Hypothesis esting Hypothesis: conjecture, proposition or statement based on published literature, data, or a theory that may or may not be true Statistical Hypothesis: conjecture about a population parameter
ANALYTICAL COMPARISONS AMONG TREATMENT MEANS (CHAPTER 4)
") ANALYTICAL COMPARISONS AMONG TREATMENT MEANS (CHAPTER 4) ERSH 8310 Fall 2007 September 11, 2007 Today s Class The need for analytic comparisons. Planned comparisons. Comparisons among treatment means.
ANALYTICAL COMPARISONS AMONG TREATMENT MEANS (CHAPTER 4) ERSH 8310 Fall 2007 September 11, 2007 Today s Class The need for analytic comparisons. Planned comparisons. Comparisons among treatment means.
y ˆ i = ˆ " T u i ( i th fitted value or i th fit)
") 1 2 INFERENCE FOR MULTIPLE LINEAR REGRESSION Recall Terminology: p predictors x 1, x 2,, x p Some might be indicator variables for categorical variables) k-1 non-constant terms u 1, u 2,, u k-1 Each u
1 2 INFERENCE FOR MULTIPLE LINEAR REGRESSION Recall Terminology: p predictors x 1, x 2,, x p Some might be indicator variables for categorical variables) k-1 non-constant terms u 1, u 2,, u k-1 Each u
Keppel, G. & Wickens, T. D. Design and Analysis Chapter 4: Analytical Comparisons Among Treatment Means
 Keppel, G. & Wickens, T. D. Design and Analysis Chapter 4: Analytical Comparisons Among Treatment Means 4.1 The Need for Analytical Comparisons...the between-groups sum of squares averages the differences
Lecture 18: Analysis of variance: ANOVA
 Lecture 18: Announcements: Exam has been graded. See website for results. Lecture 18: Announcements: Exam has been graded. See website for results. Reading: Vasilj pp. 83-97. Lecture 18: Announcements:
Introduction to Statistical Hypothesis Testing
 Introduction to Statistical Hypothesis Testing Arun K. Tangirala Power of Hypothesis Tests Arun K. Tangirala, IIT Madras Intro to Statistical Hypothesis Testing 1 Learning objectives I Computing Pr(Type