ANALYTICAL COMPARISONS AMONG TREATMENT MEANS (CHAPTER 4)
|
|
|
- Melissa Hodges
- 6 years ago
- Views:
Transcription
1 ANALYTICAL COMPARISONS AMONG TREATMENT MEANS (CHAPTER 4) ERSH 8310 Fall 2007 September 11, 2007
2 Today s Class The need for analytic comparisons. Planned comparisons. Comparisons among treatment means. Evaluating contrasts with t-tests. Orthogonal contrasts. Mean comparison in SPSS.
3 Today s Example Data Set Still Vigilant

4 Vigilance Task While Sleep Deprived There are a = 4 conditions, namely, 4, 12, 20, and 28 hours without sleep. There are n = 4 subjects randomly assigned to each of the different treatment conditions. The vigilance task score represents the number of failures to spot objects on a radar screen during a 30-minute test period.
5 Data (computation p. 51) Hours without sleep 4 hr 12 hr 20 hr 28 hr a 1 a 2 a 3 A
6 SPSS Results (From Lab Thursday)
7 The Need for Analytic Comparisons
8 The Need for Analytic Comparisons This chapter focuses on the analysis of experiments in which the independent variable consists of qualitative differences among the treatment conditions, where the interest is in isolating and assessing meaningful comparisons between specific treatment conditions. An analytical comparison refers to a meaningful comparison between two or more treatment conditions that are components of a larger experimental design (i.e., planned or post hoc comparisons).
9 The Composite Nature of SS A For an equal n observations per group: SS A n j a 1 Y j Y T 2
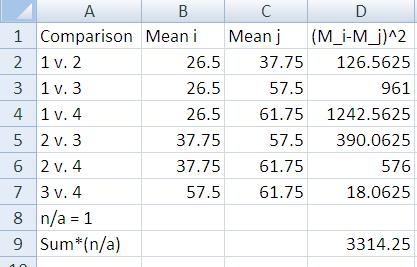
10 The Composite Nature of SS A Because: Y T a j 1 a Y T We can re-express SS A as: SS A n a pairs Y i Y k 2
11 Example Decomposition
12 The Omnibus F Test The overall variation among the treatment means reflected in SS A may be better understood by examining these contributing parts, namely, the comparisons between pairs of means. An F ratio based on more than two treatment levels is called the omnibus or overall F test. Identifying the sources that contribute to the significant overall F should be performed to understand differences among the treatment means.
13 Planned Comparisons
14 Planned Comparisons The analytical comparisons conducted directly on a set of data without reference to the result of the omnibus F test is possible. These are called the planned comparisons.
15 An Example of Planned Comparisons Instead of testing the overall hypothesis (e.g., H 0 : m 1 = m 2 = m 3 = m 4 = m 5, where m j represents the amount of learning for the jth group), we may perform the four comparisons. The four null hypotheses are as follows:
16 Comparisons Among Treatment Means
17 Comparisons Among Treatment Means Comparisons that can be reduced to miniature experiment, each of which consists of a = 2 (i.e., df = 1), are called also contrasts or single-df comparisons. Note that we may extend the comparisons to situations where the subsets of three or more means are tested. (i.e., df ¹ 1).
18 Linear Contrasts From the null hypothesis of a comparison we may represent the difference between two means with ψ. For example Can be rewritten: Yielding:
19 The New Null Hypothesis From the last slide, our contrast is: where the numbers multiplied by each mean are called coefficients. Note that, now, H 0 : ψ = 0.
20 Contrasts, In General The general formula is: where the c j 's represent the coefficients appropriate for a particular comparison. Note: there is a constraint that the c s sum to zero.
21 Constructing Coefficients A pairwise comparison is a comparison between two single groups (e.g., ψ = μ j - μ k ). A complex comparison is a comparison between an average of two or more groups and either a single group or an average of two or more groups. For an example (a = 5), where c j 's are called a standard set. If c j s are expressed as a set of integer numbers (i.e., {-2, +3, -2, +3, -2}), we call the c j 's the relative weights of the groups.
22 The Sums of Squares for a Comparison If then the sum of squares for the contrast is:
23 Evaluating Comparisons If the comparisons are planned comparisons, we may not even bother to perform the omnibus F test. Note that the two comparisons in Table 4.4 account for the total between groups sum of squares (i.e., a complete set of orthogonal comparisons). The F ratio is formed as where df num = 1 and df denom = a(n-1).
24 Unequal Sample Sizes Let n j indicate the number of subjects in group a j. The sum of square is The MS ψ and F can be obtained accordingly.
25 Evaluating Constrasts with a t-test
26 The t-test The one-sample t test is where s M = s/ n.
27 Two-Sample t-test The independent samples t test for the equality of the population means, under the assumptions of the ANOVA procedure are valid, can be written as
28 t-tests v. ANOVA It can be noted that t 2 (df) = F(1,df)
29 Orthogonal Contrasts
30 Orthogonal Contrasts In general, we can divide any sum of squares into as many independent sums of squares as there are df. The valuable property of orthogonal comparisons is that they reflect independent or nonoverlapping pieces of information. The outcome of one comparison given no indication whatsoever about the outcome of another orthogonal comparison. Orthogonality means independence of information.
31 What is Orthogonal? A numerical test of the orthogonality of any two comparisons is provided by the following relationship between the two sets of coefficients: where c 1j and c 2j are corresponding coefficients in the two comparisons.
32 Orthogonality and the ANOVA The number of orthogonal comparisons for a given set of data is a-1, that is the df for the SS A (e.g., Helmert contrasts). Authors of statistical sourcebook are not in agreement on the issue of placing orthogonality restrictions on the nature of the planned comparisons. Researchers must exercise judgment in the planning stages to guarantee that the important questions studies in an investigation can be answered unambiguously by the proposed experimental design. Nonorthogonal comparisons, however, require special care to avoid logical ambiguities.
33 Composite Contrasts Derived from Theory
34 Contrast Coefficients that Match a Pattern The contrast coefficients that reflect theoretical pattern can be constructed using the steps: 1. Use each predicted mean as a starting coefficient. 2. Subtract the average of these means from the predicted means so that they sum to zero. 3. Optionally, simplify the coefficients to be integers. The testing of the observed pattern of means with the theoretically-derived expectation as well as the assessment of the fit of the outcome to the predicted pattern can be performed.
35 Back to the Example Which vigilance task means are significantly different?
36 Comparisons in SPSS To make mean comparisons in SPSS, a basic method is to use t-tests. Because we will have multiple mean comparisons, we need to adjust our overall Type-I error rate so that we have an overall level of error that is acceptable. To do this, we must first go and run our analysis as we did in lab

37 Running the ANOVA Go to Analyze Compare Means One-Way ANOVA

38 Choose the Variables Next put the factor variable in the Factor box Then put the dependent variable in the Dependent List Box. THEN: Click on the Post Hoc button.
.")
39 Select the Bonferroni Method Test Check the box next to Bonferroni Be sure to set the significance level for your overall experiment (0.05 is the default).
40 Results

41 Final Thought The ANOVA procedure yields an omnibus F test that tells you that at least one group mean is different from the rest. This class talked about ways in which you could find out which mean that happened to be. Contrasts are specific hypothesis tests that examine how each mean may differ from all the other means.
42 Next Class Chapter 5: Analysis of Trends
Analytical Comparisons Among Treatment Means (Chapter 4) Analysis of Trend (Chapter 5) ERSH 8310 Fall 2009
 Analysis of Trend (Chapter 5) ERSH 8310 Fall 2009") Analytical Comparisons Among Treatment Means (Chapter 4) Analysis of Trend (Chapter 5) ERSH 8310 Fall 009 September 9, 009 Today s Class Chapter 4 Analytic comparisons The need for analytic comparisons
Analytical Comparisons Among Treatment Means (Chapter 4) Analysis of Trend (Chapter 5) ERSH 8310 Fall 009 September 9, 009 Today s Class Chapter 4 Analytic comparisons The need for analytic comparisons
Keppel, G. & Wickens, T. D. Design and Analysis Chapter 4: Analytical Comparisons Among Treatment Means
 Keppel, G. & Wickens, T. D. Design and Analysis Chapter 4: Analytical Comparisons Among Treatment Means 4.1 The Need for Analytical Comparisons...the between-groups sum of squares averages the differences
Variance Estimates and the F Ratio. ERSH 8310 Lecture 3 September 2, 2009
 Variance Estimates and the F Ratio ERSH 8310 Lecture 3 September 2, 2009 Today s Class Completing the analysis (the ANOVA table) Evaluating the F ratio Errors in hypothesis testing A complete numerical
Analysis of Variance: Repeated measures
 Repeated-Measures ANOVA: Analysis of Variance: Repeated measures Each subject participates in all conditions in the experiment (which is why it is called repeated measures). A repeated-measures ANOVA is
What Does the F-Ratio Tell Us?
 Planned Comparisons What Does the F-Ratio Tell Us? The F-ratio (called an omnibus or overall F) provides a test of whether or not there a treatment effects in an experiment A significant F-ratio suggests
The legacy of Sir Ronald A. Fisher. Fisher s three fundamental principles: local control, replication, and randomization.
 1 Chapter 1: Research Design Principles The legacy of Sir Ronald A. Fisher. Fisher s three fundamental principles: local control, replication, and randomization. 2 Chapter 2: Completely Randomized Design
Analysis of Variance (ANOVA)
") Analysis of Variance (ANOVA) Two types of ANOVA tests: Independent measures and Repeated measures Comparing 2 means: X 1 = 20 t - test X 2 = 30 How can we Compare 3 means?: X 1 = 20 X 2 = 30 X 3 = 35 ANOVA
Analysis of Variance (ANOVA) Two types of ANOVA tests: Independent measures and Repeated measures Comparing 2 means: X 1 = 20 t - test X 2 = 30 How can we Compare 3 means?: X 1 = 20 X 2 = 30 X 3 = 35 ANOVA
The One-Way Independent-Samples ANOVA. (For Between-Subjects Designs)
") The One-Way Independent-Samples ANOVA (For Between-Subjects Designs) Computations for the ANOVA In computing the terms required for the F-statistic, we won t explicitly compute any sample variances or
The One-Way Independent-Samples ANOVA (For Between-Subjects Designs) Computations for the ANOVA In computing the terms required for the F-statistic, we won t explicitly compute any sample variances or
Using SPSS for One Way Analysis of Variance
 Using SPSS for One Way Analysis of Variance This tutorial will show you how to use SPSS version 12 to perform a one-way, between- subjects analysis of variance and related post-hoc tests. This tutorial
4:3 LEC - PLANNED COMPARISONS AND REGRESSION ANALYSES
 4:3 LEC - PLANNED COMPARISONS AND REGRESSION ANALYSES FOR SINGLE FACTOR BETWEEN-S DESIGNS Planned or A Priori Comparisons We previously showed various ways to test all possible pairwise comparisons for
Comparing Several Means: ANOVA
 Comparing Several Means: ANOVA Understand the basic principles of ANOVA Why it is done? What it tells us? Theory of one way independent ANOVA Following up an ANOVA: Planned contrasts/comparisons Choosing
Difference in two or more average scores in different groups
 ANOVAs Analysis of Variance (ANOVA) Difference in two or more average scores in different groups Each participant tested once Same outcome tested in each group Simplest is one-way ANOVA (one variable as
COMPARING SEVERAL MEANS: ANOVA
 LAST UPDATED: November 15, 2012 COMPARING SEVERAL MEANS: ANOVA Objectives 2 Basic principles of ANOVA Equations underlying one-way ANOVA Doing a one-way ANOVA in R Following up an ANOVA: Planned contrasts/comparisons
BIOL Biometry LAB 6 - SINGLE FACTOR ANOVA and MULTIPLE COMPARISON PROCEDURES
 BIOL 458 - Biometry LAB 6 - SINGLE FACTOR ANOVA and MULTIPLE COMPARISON PROCEDURES PART 1: INTRODUCTION TO ANOVA Purpose of ANOVA Analysis of Variance (ANOVA) is an extremely useful statistical method
Introduction to Analysis of Variance. Chapter 11
 Introduction to Analysis of Variance Chapter 11 Review t-tests Single-sample t-test Independent samples t-test Related or paired-samples t-test s m M t ) ( 1 1 ) ( m m s M M t M D D D s M t n s s M 1 )
Regression With a Categorical Independent Variable: Mean Comparisons
 Regression With a Categorical Independent Variable: Mean Lecture 16 March 29, 2005 Applied Regression Analysis Lecture #16-3/29/2005 Slide 1 of 43 Today s Lecture comparisons among means. Today s Lecture
Independent Samples ANOVA
 Independent Samples ANOVA In this example students were randomly assigned to one of three mnemonics (techniques for improving memory) rehearsal (the control group; simply repeat the words), visual imagery
10/31/2012. One-Way ANOVA F-test
 PSY 511: Advanced Statistics for Psychological and Behavioral Research 1 1. Situation/hypotheses 2. Test statistic 3.Distribution 4. Assumptions One-Way ANOVA F-test One factor J>2 independent samples
One-way between-subjects ANOVA. Comparing three or more independent means
 One-way between-subjects ANOVA Comparing three or more independent means Data files SpiderBG.sav Attractiveness.sav Homework: sourcesofself-esteem.sav ANOVA: A Framework Understand the basic principles
Multiple t Tests. Introduction to Analysis of Variance. Experiments with More than 2 Conditions
 Introduction to Analysis of Variance 1 Experiments with More than 2 Conditions Often the research that psychologists perform has more conditions than just the control and experimental conditions You might
Introduction to the Analysis of Variance (ANOVA) Computing One-Way Independent Measures (Between Subjects) ANOVAs
 Computing One-Way Independent Measures (Between Subjects) ANOVAs") Introduction to the Analysis of Variance (ANOVA) Computing One-Way Independent Measures (Between Subjects) ANOVAs The Analysis of Variance (ANOVA) The analysis of variance (ANOVA) is a statistical technique
Introduction to the Analysis of Variance (ANOVA) Computing One-Way Independent Measures (Between Subjects) ANOVAs The Analysis of Variance (ANOVA) The analysis of variance (ANOVA) is a statistical technique
Hypothesis testing: Steps
 Review for Exam 2 Hypothesis testing: Steps Exam 2 Review 1. Determine appropriate test and hypotheses 2. Use distribution table to find critical statistic value(s) representing rejection region 3. Compute
The One-Way Repeated-Measures ANOVA. (For Within-Subjects Designs)
") The One-Way Repeated-Measures ANOVA (For Within-Subjects Designs) Logic of the Repeated-Measures ANOVA The repeated-measures ANOVA extends the analysis of variance to research situations using repeated-measures
The One-Way Repeated-Measures ANOVA (For Within-Subjects Designs) Logic of the Repeated-Measures ANOVA The repeated-measures ANOVA extends the analysis of variance to research situations using repeated-measures
Regression With a Categorical Independent Variable
 Regression With a Independent Variable Lecture 10 November 5, 2008 ERSH 8320 Lecture #10-11/5/2008 Slide 1 of 54 Today s Lecture Today s Lecture Chapter 11: Regression with a single categorical independent
PSYC 331 STATISTICS FOR PSYCHOLOGISTS
 PSYC 331 STATISTICS FOR PSYCHOLOGISTS Session 4 A PARAMETRIC STATISTICAL TEST FOR MORE THAN TWO POPULATIONS Lecturer: Dr. Paul Narh Doku, Dept of Psychology, UG Contact Information: pndoku@ug.edu.gh College
Your schedule of coming weeks. One-way ANOVA, II. Review from last time. Review from last time /22/2004. Create ANOVA table
 Your schedule of coming weeks One-way ANOVA, II 9.07 //00 Today: One-way ANOVA, part II Next week: Two-way ANOVA, parts I and II. One-way ANOVA HW due Thursday Week of May Teacher out of town all week
Chapter 10. Design of Experiments and Analysis of Variance
 Chapter 10 Design of Experiments and Analysis of Variance Elements of a Designed Experiment Response variable Also called the dependent variable Factors (quantitative and qualitative) Also called the independent
One-way between-subjects ANOVA. Comparing three or more independent means
 One-way between-subjects ANOVA Comparing three or more independent means ANOVA: A Framework Understand the basic principles of ANOVA Why it is done? What it tells us? Theory of one-way between-subjects
13: Additional ANOVA Topics
 13: Additional ANOVA Topics Post hoc comparisons Least squared difference The multiple comparisons problem Bonferroni ANOVA assumptions Assessing equal variance When assumptions are severely violated Kruskal-Wallis
Introduction to the Analysis of Variance (ANOVA)
") Introduction to the Analysis of Variance (ANOVA) The Analysis of Variance (ANOVA) The analysis of variance (ANOVA) is a statistical technique for testing for differences between the means of multiple (more
Introduction to the Analysis of Variance (ANOVA) The Analysis of Variance (ANOVA) The analysis of variance (ANOVA) is a statistical technique for testing for differences between the means of multiple (more
ANOVA Analysis of Variance
 ANOVA Analysis of Variance ANOVA Analysis of Variance Extends independent samples t test ANOVA Analysis of Variance Extends independent samples t test Compares the means of groups of independent observations
LAB 3 INSTRUCTIONS SIMPLE LINEAR REGRESSION
 LAB 3 INSTRUCTIONS SIMPLE LINEAR REGRESSION In this lab you will first learn how to display the relationship between two quantitative variables with a scatterplot and also how to measure the strength of
8/23/2018. One-Way ANOVA F-test. 1. Situation/hypotheses. 2. Test statistic. 3.Distribution. 4. Assumptions
 PSY 5101: Advanced Statistics for Psychological and Behavioral Research 1 1. Situation/hypotheses 2. Test statistic One-Way ANOVA F-test One factor J>2 independent samples H o :µ 1 µ 2 µ J F 3.Distribution
psyc3010 lecture 2 factorial between-ps ANOVA I: omnibus tests
 psyc3010 lecture 2 factorial between-ps ANOVA I: omnibus tests last lecture: introduction to factorial designs next lecture: factorial between-ps ANOVA II: (effect sizes and follow-up tests) 1 general
Notes on Maxwell & Delaney
 Notes on Maxwell & Delaney PSCH 710 6 Chapter 6 - Trend Analysis Previously, we discussed how to use linear contrasts, or comparisons, to test specific hypotheses about differences among means. Those discussions
Analyses of Variance. Block 2b
 Analyses of Variance Block 2b Types of analyses 1 way ANOVA For more than 2 levels of a factor between subjects ANCOVA For continuous co-varying factor, between subjects ANOVA for factorial design Multiple
One-Way ANOVA. Some examples of when ANOVA would be appropriate include:
 One-Way ANOVA 1. Purpose Analysis of variance (ANOVA) is used when one wishes to determine whether two or more groups (e.g., classes A, B, and C) differ on some outcome of interest (e.g., an achievement
The t-test: A z-score for a sample mean tells us where in the distribution the particular mean lies
 The t-test: So Far: Sampling distribution benefit is that even if the original population is not normal, a sampling distribution based on this population will be normal (for sample size > 30). Benefit
STAT 328 (Statistical Packages)
") Department of Statistics and Operations Research College of Science King Saud University Exercises STAT 328 (Statistical Packages) nashmiah r.alshammari ^-^ Excel and Minitab - 1 - Write the commands of
Department of Statistics and Operations Research College of Science King Saud University Exercises STAT 328 (Statistical Packages) nashmiah r.alshammari ^-^ Excel and Minitab - 1 - Write the commands of
Orthogonal, Planned and Unplanned Comparisons
 This is a chapter excerpt from Guilford Publications. Data Analysis for Experimental Design, by Richard Gonzalez Copyright 2008. 8 Orthogonal, Planned and Unplanned Comparisons 8.1 Introduction In this
DESIGNING EXPERIMENTS AND ANALYZING DATA A Model Comparison Perspective
 DESIGNING EXPERIMENTS AND ANALYZING DATA A Model Comparison Perspective Second Edition Scott E. Maxwell Uniuersity of Notre Dame Harold D. Delaney Uniuersity of New Mexico J,t{,.?; LAWRENCE ERLBAUM ASSOCIATES,
Hypothesis testing: Steps
 Review for Exam 2 Hypothesis testing: Steps Repeated-Measures ANOVA 1. Determine appropriate test and hypotheses 2. Use distribution table to find critical statistic value(s) representing rejection region
Factorial Independent Samples ANOVA
 Factorial Independent Samples ANOVA Liljenquist, Zhong and Galinsky (2010) found that people were more charitable when they were in a clean smelling room than in a neutral smelling room. Based on that
Regression With a Categorical Independent Variable
 Regression ith a Independent Variable ERSH 8320 Slide 1 of 34 Today s Lecture Regression with a single categorical independent variable. Today s Lecture Coding procedures for analysis. Dummy coding. Relationship
Specific Differences. Lukas Meier, Seminar für Statistik
 Specific Differences Lukas Meier, Seminar für Statistik Problem with Global F-test Problem: Global F-test (aka omnibus F-test) is very unspecific. Typically: Want a more precise answer (or have a more
ANOVA: Comparing More Than Two Means
 1 ANOVA: Comparing More Than Two Means 10.1 ANOVA: The Completely Randomized Design Elements of a Designed Experiment Before we begin any calculations, we need to discuss some terminology. To make this
Multiple Comparison Procedures Cohen Chapter 13. For EDUC/PSY 6600
 Multiple Comparison Procedures Cohen Chapter 13 For EDUC/PSY 6600 1 We have to go to the deductions and the inferences, said Lestrade, winking at me. I find it hard enough to tackle facts, Holmes, without
Comparisons among means (or, the analysis of factor effects)
") Comparisons among means (or, the analysis of factor effects) In carrying out our usual test that μ 1 = = μ r, we might be content to just reject this omnibus hypothesis but typically more is required:
Comparisons among means (or, the analysis of factor effects) In carrying out our usual test that μ 1 = = μ r, we might be content to just reject this omnibus hypothesis but typically more is required:
Note: k = the # of conditions n = # of data points in a condition N = total # of data points
 The ANOVA for2 Dependent Groups -- Analysis of 2-Within (or Matched)-Group Data with a Quantitative Response Variable Application: This statistic has two applications that can appear very different, but
Analysis of Variance and Contrasts
 Analysis of Variance and Contrasts Ken Kelley s Class Notes 1 / 103 Lesson Breakdown by Topic 1 Goal of Analysis of Variance A Conceptual Example Appropriate for ANOVA Example F -Test for Independent Variances
This module focuses on the logic of ANOVA with special attention given to variance components and the relationship between ANOVA and regression.
 WISE ANOVA and Regression Lab Introduction to the WISE Correlation/Regression and ANOVA Applet This module focuses on the logic of ANOVA with special attention given to variance components and the relationship
Hotelling s One- Sample T2
 Chapter 405 Hotelling s One- Sample T2 Introduction The one-sample Hotelling s T2 is the multivariate extension of the common one-sample or paired Student s t-test. In a one-sample t-test, the mean response
WISE Regression/Correlation Interactive Lab. Introduction to the WISE Correlation/Regression Applet
 WISE Regression/Correlation Interactive Lab Introduction to the WISE Correlation/Regression Applet This tutorial focuses on the logic of regression analysis with special attention given to variance components.
Chapter 7 Factorial ANOVA: Two-way ANOVA
 Chapter 7 Factorial ANOVA: Two-way ANOVA Page Two-way ANOVA: Equal n. Examples 7-. Terminology 7-6 3. Understanding main effects 7- and interactions 4. Structural model 7-5 5. Variance partitioning 7-6.
Analysis of Covariance. The following example illustrates a case where the covariate is affected by the treatments.
 Analysis of Covariance In some experiments, the experimental units (subjects) are nonhomogeneous or there is variation in the experimental conditions that are not due to the treatments. For example, a
Contrasts (in general)
") 10/1/015 6-09/749 Experimental Design for Behavioral and Social Sciences Contrasts (in general) Context: An ANOVA rejects the overall null hypothesis that all k means of some factor are not equal, i.e.,
10/1/015 6-09/749 Experimental Design for Behavioral and Social Sciences Contrasts (in general) Context: An ANOVA rejects the overall null hypothesis that all k means of some factor are not equal, i.e.,
Keppel, G. & Wickens, T. D. Design and Analysis Chapter 12: Detailed Analyses of Main Effects and Simple Effects
 Keppel, G. & Wickens, T. D. Design and Analysis Chapter 1: Detailed Analyses of Main Effects and Simple Effects If the interaction is significant, then less attention is paid to the two main effects, and
A Re-Introduction to General Linear Models (GLM)
") A Re-Introduction to General Linear Models (GLM) Today s Class: You do know the GLM Estimation (where the numbers in the output come from): From least squares to restricted maximum likelihood (REML) Reviewing
A Re-Introduction to General Linear Models (GLM) Today s Class: You do know the GLM Estimation (where the numbers in the output come from): From least squares to restricted maximum likelihood (REML) Reviewing
Stats fest Analysis of variance. Single factor ANOVA. Aims. Single factor ANOVA. Data
 1 Stats fest 2007 Analysis of variance murray.logan@sci.monash.edu.au Single factor ANOVA 2 Aims Description Investigate differences between population means Explanation How much of the variation in response
Unbalanced Designs & Quasi F-Ratios
 Unbalanced Designs & Quasi F-Ratios ANOVA for unequal n s, pooled variances, & other useful tools Unequal nʼs Focus (so far) on Balanced Designs Equal n s in groups (CR-p and CRF-pq) Observation in every
DETAILED CONTENTS PART I INTRODUCTION AND DESCRIPTIVE STATISTICS. 1. Introduction to Statistics
 DETAILED CONTENTS About the Author Preface to the Instructor To the Student How to Use SPSS With This Book PART I INTRODUCTION AND DESCRIPTIVE STATISTICS 1. Introduction to Statistics 1.1 Descriptive and
a. See the textbook for examples of proving logical equivalence using truth tables. b. There is a real number x for which f (x) < 0. (x 1) 2 > 0.
 < 0. (x 1) 2 > 0.") For some problems, several sample proofs are given here. Problem 1. a. See the textbook for examples of proving logical equivalence using truth tables. b. There is a real number x for which f (x) < 0.
For some problems, several sample proofs are given here. Problem 1. a. See the textbook for examples of proving logical equivalence using truth tables. b. There is a real number x for which f (x) < 0.
Hypothesis T e T sting w ith with O ne O One-Way - ANOV ANO A V Statistics Arlo Clark Foos -
 Hypothesis Testing with One-Way ANOVA Statistics Arlo Clark-Foos Conceptual Refresher 1. Standardized z distribution of scores and of means can be represented as percentile rankings. 2. t distribution
STAT 263/363: Experimental Design Winter 2016/17. Lecture 1 January 9. Why perform Design of Experiments (DOE)? There are at least two reasons:
? There are at least two reasons:") STAT 263/363: Experimental Design Winter 206/7 Lecture January 9 Lecturer: Minyong Lee Scribe: Zachary del Rosario. Design of Experiments Why perform Design of Experiments (DOE)? There are at least two
STAT 263/363: Experimental Design Winter 206/7 Lecture January 9 Lecturer: Minyong Lee Scribe: Zachary del Rosario. Design of Experiments Why perform Design of Experiments (DOE)? There are at least two
Regression With a Categorical Independent Variable
 Regression With a Categorical Independent Variable Lecture 15 March 17, 2005 Applied Regression Analysis Lecture #15-3/17/2005 Slide 1 of 29 Today s Lecture» Today s Lecture» Midterm Note» Example Regression
Review of Multiple Regression
 Ronald H. Heck 1 Let s begin with a little review of multiple regression this week. Linear models [e.g., correlation, t-tests, analysis of variance (ANOVA), multiple regression, path analysis, multivariate
Cheat Sheet: ANOVA. Scenario. Power analysis. Plotting a line plot and a box plot. Pre-testing assumptions
 Cheat Sheet: ANOVA Measurement and Evaluation of HCC Systems Scenario Use ANOVA if you want to test the difference in continuous outcome variable vary between multiple levels (A, B, C, ) of a nominal variable
Lec 1: An Introduction to ANOVA
 Ying Li Stockholm University October 31, 2011 Three end-aisle displays Which is the best? Design of the Experiment Identify the stores of the similar size and type. The displays are randomly assigned to
Multiple Comparisons
 Multiple Comparisons Error Rates, A Priori Tests, and Post-Hoc Tests Multiple Comparisons: A Rationale Multiple comparison tests function to tease apart differences between the groups within our IV when
2. RELATIONSHIP BETWEEN A QUALITATIVE AND A QUANTITATIVE VARIABLE
 7/09/06. RELATIONHIP BETWEEN A QUALITATIVE AND A QUANTITATIVE VARIABLE Design and Data Analysis in Psychology II usana anduvete Chaves alvadorchacón Moscoso. INTRODUCTION You may examine gender differences
5:1LEC - BETWEEN-S FACTORIAL ANOVA
 5:1LEC - BETWEEN-S FACTORIAL ANOVA The single-factor Between-S design described in previous classes is only appropriate when there is just one independent variable or factor in the study. Often, however,
Prepared by: Prof. Dr Bahaman Abu Samah Department of Professional Development and Continuing Education Faculty of Educational Studies Universiti
 Prepared by: Prof. Dr Bahaman Abu Samah Department of Professional Development and Continuing Education Faculty of Educational Studies Universiti Putra Malaysia Serdang Use in experiment, quasi-experiment
One-way Analysis of Variance. Major Points. T-test. Ψ320 Ainsworth
 One-way Analysis of Variance Ψ30 Ainsworth Major Points Problem with t-tests and multiple groups The logic behind ANOVA Calculations Multiple comparisons Assumptions of analysis of variance Effect Size
H0: Tested by k-grp ANOVA
 Analyses of K-Group Designs : Omnibus F, Pairwise Comparisons & Trend Analyses ANOVA for multiple condition designs Pairwise comparisons and RH Testing Alpha inflation & Correction LSD & HSD procedures
H0: Tested by k-grp ANOVA
 Pairwise Comparisons ANOVA for multiple condition designs Pairwise comparisons and RH Testing Alpha inflation & Correction LSD & HSD procedures Alpha estimation reconsidered H0: Tested by k-grp ANOVA Regardless
1. The (dependent variable) is the variable of interest to be measured in the experiment.
 is the variable of interest to be measured in the experiment.") Chapter 10 Analysis of variance (ANOVA) 10.1 Elements of a designed experiment 1. The (dependent variable) is the variable of interest to be measured in the experiment. 2. are those variables whose effect
Chapter 10 Analysis of variance (ANOVA) 10.1 Elements of a designed experiment 1. The (dependent variable) is the variable of interest to be measured in the experiment. 2. are those variables whose effect
Multiple comparisons - subsequent inferences for two-way ANOVA
 1 Multiple comparisons - subsequent inferences for two-way ANOVA the kinds of inferences to be made after the F tests of a two-way ANOVA depend on the results if none of the F tests lead to rejection of
Analysis of Variance and Co-variance. By Manza Ramesh
 Analysis of Variance and Co-variance By Manza Ramesh Contents Analysis of Variance (ANOVA) What is ANOVA? The Basic Principle of ANOVA ANOVA Technique Setting up Analysis of Variance Table Short-cut Method
Least Squares Analyses of Variance and Covariance
 Least Squares Analyses of Variance and Covariance One-Way ANOVA Read Sections 1 and 2 in Chapter 16 of Howell. Run the program ANOVA1- LS.sas, which can be found on my SAS programs page. The data here
Calculating Fobt for all possible combinations of variances for each sample Calculating the probability of (F) for each different value of Fobt
 for each different value of Fobt") PSY 305 Module 5-A AVP Transcript During the past two modules, you have been introduced to inferential statistics. We have spent time on z-tests and the three types of t-tests. We are now ready to move
PSY 305 Module 5-A AVP Transcript During the past two modules, you have been introduced to inferential statistics. We have spent time on z-tests and the three types of t-tests. We are now ready to move
GLM Repeated-measures designs: One within-subjects factor
 GLM Repeated-measures designs: One within-subjects factor Reading: SPSS dvanced Models 9.0: 2. Repeated Measures Homework: Sums of Squares for Within-Subject Effects Download: glm_withn1.sav (Download
Dr. Junchao Xia Center of Biophysics and Computational Biology. Fall /1/2016 1/46
 BIO5312 Biostatistics Lecture 10:Regression and Correlation Methods Dr. Junchao Xia Center of Biophysics and Computational Biology Fall 2016 11/1/2016 1/46 Outline In this lecture, we will discuss topics
Degrees of freedom df=1. Limitations OR in SPSS LIM: Knowing σ and µ is unlikely in large
 Z Test Comparing a group mean to a hypothesis T test (about 1 mean) T test (about 2 means) Comparing mean to sample mean. Similar means = will have same response to treatment Two unknown means are different
Regression: Main Ideas Setting: Quantitative outcome with a quantitative explanatory variable. Example, cont.
 TCELL 9/4/205 36-309/749 Experimental Design for Behavioral and Social Sciences Simple Regression Example Male black wheatear birds carry stones to the nest as a form of sexual display. Soler et al. wanted
CHAPTER 7 - FACTORIAL ANOVA
 Between-S Designs Factorial 7-1 CHAPTER 7 - FACTORIAL ANOVA Introduction to Factorial Designs................................................. 2 A 2 x 2 Factorial Example.......................................................
Lesson 12. Student Outcomes. Classwork. Opening Exercise (4 minutes) Discussion (4 minutes)
 Discussion (4 minutes)") Student Outcomes Students are introduced to the formal process of solving an equation: starting from the assumption that the original equation has a solution. Students explain each step as following from
Student Outcomes Students are introduced to the formal process of solving an equation: starting from the assumption that the original equation has a solution. Students explain each step as following from
HEC-HMS Lab 4 Using Frequency Storms in HEC-HMS
 HEC-HMS Lab 4 Using Frequency Storms in HEC-HMS Created by Venkatesh Merwade (vmerwade@purdue.edu) Learning outcomes The objective of this lab is to learn how HEC-HMS is used to determine design flow by
36-309/749 Experimental Design for Behavioral and Social Sciences. Sep. 22, 2015 Lecture 4: Linear Regression
 36-309/749 Experimental Design for Behavioral and Social Sciences Sep. 22, 2015 Lecture 4: Linear Regression TCELL Simple Regression Example Male black wheatear birds carry stones to the nest as a form
THE PEARSON CORRELATION COEFFICIENT
 CORRELATION Two variables are said to have a relation if knowing the value of one variable gives you information about the likely value of the second variable this is known as a bivariate relation There
STAT 135 Lab 9 Multiple Testing, One-Way ANOVA and Kruskal-Wallis
 STAT 135 Lab 9 Multiple Testing, One-Way ANOVA and Kruskal-Wallis Rebecca Barter April 6, 2015 Multiple Testing Multiple Testing Recall that when we were doing two sample t-tests, we were testing the equality
Applied Statistics for the Behavioral Sciences
 Applied Statistics for the Behavioral Sciences Chapter 8 One-sample designs Hypothesis testing/effect size Chapter Outline Hypothesis testing null & alternative hypotheses alpha ( ), significance level,
Lesson 28: A Focus on Square Roots
 now Lesson 28: A Focus on Square Roots Student Outcomes Students solve simple radical equations and understand the possibility of extraneous solutions. They understand that care must be taken with the
Regression Analysis IV... More MLR and Model Building
 Regression Analysis IV... More MLR and Model Building This session finishes up presenting the formal methods of inference based on the MLR model and then begins discussion of "model building" (use of regression
INTRODUCTION TO ANALYSIS OF VARIANCE
 CHAPTER 22 INTRODUCTION TO ANALYSIS OF VARIANCE Chapter 18 on inferences about population means illustrated two hypothesis testing situations: for one population mean and for the difference between two
Analysis of Variance (ANOVA)
") Analysis of Variance (ANOVA) Used for comparing or more means an extension of the t test Independent Variable (factor) = categorical (qualita5ve) predictor should have at least levels, but can have many
Analysis of Variance (ANOVA) Used for comparing or more means an extension of the t test Independent Variable (factor) = categorical (qualita5ve) predictor should have at least levels, but can have many
Power Analysis. Introduction to Power
 Power Analysis Dr. J. Kyle Roberts Southern Methodist University Simmons School of Education and Human Development Department of Teaching and Learning When testing a specific null hypothesis (H 0 ), we
Statistiek II. John Nerbonne using reworkings by Hartmut Fitz and Wilbert Heeringa. February 13, Dept of Information Science
 Statistiek II John Nerbonne using reworkings by Hartmut Fitz and Wilbert Heeringa Dept of Information Science j.nerbonne@rug.nl February 13, 2014 Course outline 1 One-way ANOVA. 2 Factorial ANOVA. 3 Repeated
One-Way ANOVA Cohen Chapter 12 EDUC/PSY 6600
 One-Way ANOVA Cohen Chapter 1 EDUC/PSY 6600 1 It is easy to lie with statistics. It is hard to tell the truth without statistics. -Andrejs Dunkels Motivating examples Dr. Vito randomly assigns 30 individuals
Unit5: Inferenceforcategoricaldata. 4. MT2 Review. Sta Fall Duke University, Department of Statistical Science
 Unit5: Inferenceforcategoricaldata 4. MT2 Review Sta 101 - Fall 2015 Duke University, Department of Statistical Science Dr. Çetinkaya-Rundel Slides posted at http://bit.ly/sta101_f15 Outline 1. Housekeeping
Module 8: Linear Regression. The Applied Research Center
 Module 8: Linear Regression The Applied Research Center Module 8 Overview } Purpose of Linear Regression } Scatter Diagrams } Regression Equation } Regression Results } Example Purpose } To predict scores