8/23/2018. One-Way ANOVA F-test. 1. Situation/hypotheses. 2. Test statistic. 3.Distribution. 4. Assumptions
|
|
|
- Julian Crawford
- 5 years ago
- Views:
Transcription
1 PSY 5101: Advanced Statistics for Psychological and Behavioral Research 1 1. Situation/hypotheses 2. Test statistic One-Way ANOVA F-test One factor J>2 independent samples H o :µ 1 µ 2 µ J F 3.Distribution 4. Assumptions F J-1, N-J 1. Populations are normal 2. σ 2 1σ 2 2 σ 2 J 3. Observations are independent We compare the amount of variability that is explained by the model (e.g., experimental manipulation) to the error in the model (e.g., individual differences in the outcome variable that are not attributed to the manipulation) This ratio is called thef-ratio If the model explains a lot more variability than it is unable to explain, then the F-ratio is statistically significant (e.g., the experimental manipulation has had a significant effect on the outcome variable) 1


2 If the experiment is successful, then the model will explain more variance than it can t SS M will be greater than SS R There is a family of F Distributions Each member of the family is determined by two parameters: the numerator degrees of freedom and the denominator degrees of freedom Fcannot be negative and it is a continuous distribution The Fdistribution is positively skewed Its values range from 0 to As F the curve approaches the X-axis What happens when we want to compare two or more groups? Now we examine a test statistic that will let us test hypotheses about two or more means, so we can use two or more groups The two-sample t-tests could work with only two groups The one-way ANOVA uses two or more groups 2
3 !! 8/23/2018 Problem 1: You would need 3 t-tests to test the equality of 3 groups (1 vs. 2, 1 vs. 3, & 2 vs. 3) Problem 2: Those multiple t-tests are not independent The tests involving group 1 (1 vs. 2 & 1 vs. 3) have some overlap. Problem 3: The probability of a Type I error increases as a function of the number of t-tests This idea will be discussed during our section on Multiple Comparison Procedures Problem 4: You would have multiple tests for one hypothesis How many tests would need to be significant in order to reject the null? t What does the numerator of this tformula tell you? It tells you about the difference between groups What does the denominator of this tformula tell you? It tells you about the pooled variance within groups What about ANOVA? It is a ratio of two variances Between-groups variance in the numerator It uses between-groups variance because you cannot simply look at the difference scores between three or more groups Within-groups variance in the denominator Type of Analysis Information about differences between group means Information about the variability of scores within groups Two-Independent- Samples t-test " 1 -" 2 MS Between # 2 & (# 2 1 MS 1 1'1 2& 2'1 ( & 1(& 2'2 & 1 & 2 Within One-Way ANOVA Degrees of freedom df n 1 + n 2-2 Two dfterms: df Between J 1 df Within N -J Test Statistic ) * ) Information represented by the test statistic Between' Group Differences Within' Group Differences Between' Group Differences Within' Group Differences 3
4 One-Way refers to the number of factors (i.e., variables that classify the subjects into groups) Note: ANOVA can be used for either experimental or non-experimental data ANOVA is an abbreviation for Analysis of Variance A One-Way ANOVA is a procedure that tests the effects of one factor (several independent groups) on the means of one continuous outcome variable Question: Does smoking impact your thinking? Groups: Non-Smokers (NS) Active Smokers (AS, had just smoked) Deprived Smokers (DS, not smoked for 3 hours) The three groups performed several cognitive tasks that ranged from simple to complex For the complex tasks, there were significant differences between the groups such that the AS group did the worst You obtain two estimates of σ 2 One estimate is based on the variance of sample means and the other estimate is based on the variance of observations within the groups Both estimate the population variance (σ 2 ) if the null hypothesis of equal population means is true but they estimate different quantities if H 0 is false With these two estimates of σ 2, you form the F ratio You expect the Fratio to be approximately one if H 0 is true but larger than one if H 0 is false You reject H 0 if Fis larger than or equal to a critical value 4
5 The ANOVA F-test uses a different logic than <, r, or any of the t-tests They were all based on a logic that looked for how far the test statistic was from a middle value of zero If the statistic was far enough away from zero and in agreement with H 1 then you rejected H o The ANOVA s logic forms an F-ratio of two sample variances, one based on the group means (Between) and the other based on scores within groups (Within) Total variance can be partitioned into between-groups and withingroups If H o of equal population means is true, then both variances should be equal and the average F will be about 1 If the population means are not equal, then we expect Between Variance > Within Variance which results in an average F > 1 (this leads us to reject H o if F>F crit ) ANOVA will use two estimates of σ 2 Estimate of σ 2 from the group means ns 2 is n (number of observations per group) times the unbiased sample variance of the X values (group means) Remember σ 2 σ2? solve for σ2 to get σ 2 nσ 2 s 2 is our best estimate of σ 2 Estimate of σ 2 based on the variance of observations within groups s 2 is the estimate of σ 2 based on pooling the values of s 2 j For equal sample sizes per group, s 2 is the average of the s 2 jvalues 5
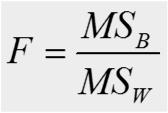
6 Notation n # of observations per group J # of groups N nj Two sample variances: One variance is based on group means (Between) Compute # 2 A (i.e., the unbiased variance of the J group means) and multiply it by n. This also is called MS B, so ns 2 MS B One variance is based on scores within groups (Within) Compute s 2 of observations within each of the J groups, and the average of these J values of s 2 is s 2 pooled, also called MS W Form the test statistic: F ) * ) Hypotheses: H o :µ 1 µ 2 µ J H 1 :any differences in µ j s -Any unbiased sample variance consists of a sum of squares such as Σ(X-X)² divided by degrees of freedom s 2 Σ(X )² B -Mean square (MS) is sample variance -Sum of squares (SS) is a sum of squared deviations ns 2 MS B CC DE s 2 pooled MS W CC DE F H o True Estimates σ 2 Estimates σ 2 Expect F 1 H 0 False Estimates σ 2 + positive quantity (i.e., treatment effect) Estimates σ 2 Expect F > 1 We reject H o if F > F crit or p-value is <.05 F (F ratio) MS B (Mean Squares Between) CC DE SS B Sum of Squares Between: Sum of squared deviations for each group mean about the grand mean (i.e., mean of the total sample) df B J-1 (J # of groups) MS W (Mean Squares Within) CC DE SS W Sum of Squares Within: Sum of squared deviations for all observations within each group from that group mean, summed across all groups df W N-J (n # participants; N n*j) 6
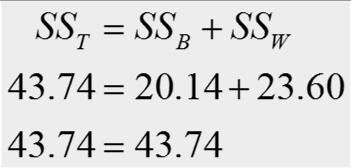
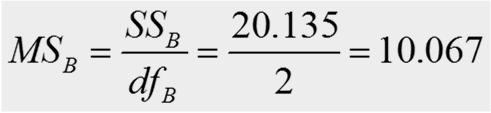
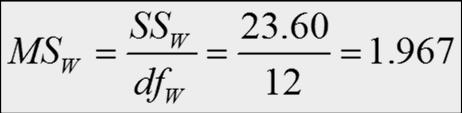
7 Compute SS Between and SS Within Compute MS Between by dividing SS Between by its df Compute MS Within by dividing SS Within by its df Compute an F ratio by dividing MS Between by MS Within Compare this value for F with the critical value for F based on df Between and df Within Sum of Squares Between (SS Between ) L SS Between & G X G 'X 2 HIJ&K MN Sum of Squares Within (SS Within ) L SS Within OO G POO 1 (OO 2 ( (OOR MN Sum of Squares Total (SS Total ) SS Total SS Between + SS Within The ANOVA is a general statistical tool, including the oneway ANOVA, the two-way ANOVA, and beyond The one in one-way refers to the number of factors (variables that classify the subjects into groups) A one-way layout looks like this: A two-way layout looks like this: Levels are the values of the factors In these examples, the oneway above has four levels, and the two-way has 2 levels of one factor and 3 levels of the second and is called a 2X3 ANOVA Factor A A 1 A 2 Factor B B 1 B 2 B 3 7
8 Hypotheses: if J4 H o :µ 1 µ 2 µ 3 µ 4 H 1 :any differences in µs The test statistic is the F-ratio, F, where df B J-1 and df W N-J Example: if SS B 410, SS W 630, n30, and J4 then df B J-14-13, and df W N-J J(n-1)4(29)116, so F ST U VUT V WX.XZ [.\W The F distribution is a positively skewed distribution with a minimum of zero It has two parameters, the dffor the numerator variance (df B ) and the dffor the denominator variance (df W ) The F table of critical values is organized by df B, df W, and α(.05 and.01) Only upper-tail critical values are given because we expect the F only to get large if H 1 is true Here is a picture of the F distribution with df B 3 and df W 60, with the critical value that cuts off α.05 in the upper tail H o α.05 F crit Rejection Values 8
9 The one-way ANOVA F statistic is distributed as F J-1,N-J only if all of the assumptions are met If any of the assumptions are not met, then F only approximately has this distribution and we need to ask questions about robustness for each assumption Normality: like the two-independent-samples t-test, Fis reasonably robust to non-normality, except for mixed distributions Equal variances: unlike the t, Fis not robust to very unequal variances, even with large and equal sample sizes Independence: like the t, Fis not robust to dependence in the data but we typically meet this assumption Unlike the t, Fis not robust to very unequal variances, even with large and equal sample sizes (if J > 2) For example, for J4, n50, if the population variances are in the ratio of 16:1:1:1, then the true αis.088 when αis set at.05 Note that.088 is larger than the.06 that we set as an upper boundary on α.05 Also note that the n50 per group is considerably larger than the n15 that it took to make the t robust to any ratio in variances The F is robust to slightly unequal variances but you do not know the population variances This problem of the F s lack of robustness to very unequal variances will be resolved when we get to the next statistical procedures: multiple-comparison procedures Testing the effects of Viagra on Libido using three groups: Placebo (Sugar Pill) Low Dose Viagra High Dose Viagra The Outcome/Dependent Variable (DV) was an objective measure of Libido 9

10 Mean 2 Low Dose Mean 3 High Dose Grand Mean Mean 1 Placebo Grand Mean 10
11 # of participants Grand variance Degrees of Freedom (df) are the number of values that are free to vary In general, the dfare one less than the number of values used to calculate the SS Grand Mean 11


12 How many values did we use to calculate SS B? We used the 3 means Grand Mean Df 4 Df 4 Df 4 12


13 How many values did we use to calculate SS W? We used the 5 scores for each of the SS for each group 13


14 14
15 Source SS df MS F Between * Within Total Next, get an F crit for df B 2 and df W 12. With α.05 we have F crit H o Now, reject H o because F5.12>F crit SPSS p-value.025 Or, reject H o because p.025< α F crit 3.89 F5.12 Rejection values The ANOVA does not tell us which groups are different Do people in the High Dose group have higher libidos than those in the Low Dose group? Do people in the Low Dose group have higher libidos than those in the Placebo group? Do people in the High Dose group have higher libidos than both those in the Low Dose group and the Placebo group? ANOVA tells us that there is some difference in the means but not how many differences there are or which means are different How do we know which groups are different? We will have to use Multiple Comparison Procedures (we cannot rely on looking at means) 15


16 The final topic for the ANOVA is to show the connection between the two-independentsample t and the one-way ANOVA F when J2 When comparing two groups, either test is fine because they will lead to the same conclusion The relationship is: t 2 F Here is a picture of what happens with t 2 60F 1,60 t distribution F distribution Rejection values t crit Rejection values 0 F crit 4.00 Rejection values Two-Independent-Samples t-test One-Way ANOVA 16
17 How strong is the actual effect? That is, what proportion of variability in the outcome variable is accounted for by the factor? What is needed is an estimate of the magnitude that is relatively independent of sample size Estimates of magnitude or effect size tell us how strongly two or more variables are related or how large the difference is between groups Eta squared: η 2 DE P ]^_`^^? b DE ]^_`^^? b DE`M_cM? 17
10/31/2012. One-Way ANOVA F-test
 PSY 511: Advanced Statistics for Psychological and Behavioral Research 1 1. Situation/hypotheses 2. Test statistic 3.Distribution 4. Assumptions One-Way ANOVA F-test One factor J>2 independent samples
Comparing Several Means: ANOVA
 Comparing Several Means: ANOVA Understand the basic principles of ANOVA Why it is done? What it tells us? Theory of one way independent ANOVA Following up an ANOVA: Planned contrasts/comparisons Choosing
COMPARING SEVERAL MEANS: ANOVA
 LAST UPDATED: November 15, 2012 COMPARING SEVERAL MEANS: ANOVA Objectives 2 Basic principles of ANOVA Equations underlying one-way ANOVA Doing a one-way ANOVA in R Following up an ANOVA: Planned contrasts/comparisons
One-way between-subjects ANOVA. Comparing three or more independent means
 One-way between-subjects ANOVA Comparing three or more independent means Data files SpiderBG.sav Attractiveness.sav Homework: sourcesofself-esteem.sav ANOVA: A Framework Understand the basic principles
9/28/2013. PSY 511: Advanced Statistics for Psychological and Behavioral Research 1
 PSY 511: Advanced Statistics for Psychological and Behavioral Research 1 The one-sample t-test and test of correlation are realistic, useful statistical tests The tests that we will learn next are even
One-way between-subjects ANOVA. Comparing three or more independent means
 One-way between-subjects ANOVA Comparing three or more independent means ANOVA: A Framework Understand the basic principles of ANOVA Why it is done? What it tells us? Theory of one-way between-subjects
The One-Way Repeated-Measures ANOVA. (For Within-Subjects Designs)
") The One-Way Repeated-Measures ANOVA (For Within-Subjects Designs) Logic of the Repeated-Measures ANOVA The repeated-measures ANOVA extends the analysis of variance to research situations using repeated-measures
The One-Way Repeated-Measures ANOVA (For Within-Subjects Designs) Logic of the Repeated-Measures ANOVA The repeated-measures ANOVA extends the analysis of variance to research situations using repeated-measures
Review. One-way ANOVA, I. What s coming up. Multiple comparisons
 Review One-way ANOVA, I 9.07 /15/00 Earlier in this class, we talked about twosample z- and t-tests for the difference between two conditions of an independent variable Does a trial drug work better than
One-way Analysis of Variance. Major Points. T-test. Ψ320 Ainsworth
 One-way Analysis of Variance Ψ30 Ainsworth Major Points Problem with t-tests and multiple groups The logic behind ANOVA Calculations Multiple comparisons Assumptions of analysis of variance Effect Size
Multiple t Tests. Introduction to Analysis of Variance. Experiments with More than 2 Conditions
 Introduction to Analysis of Variance 1 Experiments with More than 2 Conditions Often the research that psychologists perform has more conditions than just the control and experimental conditions You might
Calculating Fobt for all possible combinations of variances for each sample Calculating the probability of (F) for each different value of Fobt
 for each different value of Fobt") PSY 305 Module 5-A AVP Transcript During the past two modules, you have been introduced to inferential statistics. We have spent time on z-tests and the three types of t-tests. We are now ready to move
PSY 305 Module 5-A AVP Transcript During the past two modules, you have been introduced to inferential statistics. We have spent time on z-tests and the three types of t-tests. We are now ready to move
The One-Way Independent-Samples ANOVA. (For Between-Subjects Designs)
") The One-Way Independent-Samples ANOVA (For Between-Subjects Designs) Computations for the ANOVA In computing the terms required for the F-statistic, we won t explicitly compute any sample variances or
The One-Way Independent-Samples ANOVA (For Between-Subjects Designs) Computations for the ANOVA In computing the terms required for the F-statistic, we won t explicitly compute any sample variances or
Sampling Distributions: Central Limit Theorem
 Review for Exam 2 Sampling Distributions: Central Limit Theorem Conceptually, we can break up the theorem into three parts: 1. The mean (µ M ) of a population of sample means (M) is equal to the mean (µ)
Difference in two or more average scores in different groups
 ANOVAs Analysis of Variance (ANOVA) Difference in two or more average scores in different groups Each participant tested once Same outcome tested in each group Simplest is one-way ANOVA (one variable as
Introduction to the Analysis of Variance (ANOVA) Computing One-Way Independent Measures (Between Subjects) ANOVAs
 Computing One-Way Independent Measures (Between Subjects) ANOVAs") Introduction to the Analysis of Variance (ANOVA) Computing One-Way Independent Measures (Between Subjects) ANOVAs The Analysis of Variance (ANOVA) The analysis of variance (ANOVA) is a statistical technique
Introduction to the Analysis of Variance (ANOVA) Computing One-Way Independent Measures (Between Subjects) ANOVAs The Analysis of Variance (ANOVA) The analysis of variance (ANOVA) is a statistical technique
The t-test: A z-score for a sample mean tells us where in the distribution the particular mean lies
 The t-test: So Far: Sampling distribution benefit is that even if the original population is not normal, a sampling distribution based on this population will be normal (for sample size > 30). Benefit
Introduction to Analysis of Variance. Chapter 11
 Introduction to Analysis of Variance Chapter 11 Review t-tests Single-sample t-test Independent samples t-test Related or paired-samples t-test s m M t ) ( 1 1 ) ( m m s M M t M D D D s M t n s s M 1 )
Extensions of One-Way ANOVA.
 Extensions of One-Way ANOVA http://www.pelagicos.net/classes_biometry_fa17.htm What do I want You to Know What are two main limitations of ANOVA? What two approaches can follow a significant ANOVA? How
Hypothesis T e T sting w ith with O ne O One-Way - ANOV ANO A V Statistics Arlo Clark Foos -
 Hypothesis Testing with One-Way ANOVA Statistics Arlo Clark-Foos Conceptual Refresher 1. Standardized z distribution of scores and of means can be represented as percentile rankings. 2. t distribution
Introduction to the Analysis of Variance (ANOVA)
") Introduction to the Analysis of Variance (ANOVA) The Analysis of Variance (ANOVA) The analysis of variance (ANOVA) is a statistical technique for testing for differences between the means of multiple (more
Introduction to the Analysis of Variance (ANOVA) The Analysis of Variance (ANOVA) The analysis of variance (ANOVA) is a statistical technique for testing for differences between the means of multiple (more
One-Way ANOVA Cohen Chapter 12 EDUC/PSY 6600
 One-Way ANOVA Cohen Chapter 1 EDUC/PSY 6600 1 It is easy to lie with statistics. It is hard to tell the truth without statistics. -Andrejs Dunkels Motivating examples Dr. Vito randomly assigns 30 individuals
Unit 27 One-Way Analysis of Variance
 Unit 27 One-Way Analysis of Variance Objectives: To perform the hypothesis test in a one-way analysis of variance for comparing more than two population means Recall that a two sample t test is applied
One-way ANOVA. Experimental Design. One-way ANOVA
 Method to compare more than two samples simultaneously without inflating Type I Error rate (α) Simplicity Few assumptions Adequate for highly complex hypothesis testing 09/30/12 1 Outline of this class
Extensions of One-Way ANOVA.
 Extensions of One-Way ANOVA http://www.pelagicos.net/classes_biometry_fa18.htm What do I want You to Know What are two main limitations of ANOVA? What two approaches can follow a significant ANOVA? How
Two-Sample Inferential Statistics
 The t Test for Two Independent Samples 1 Two-Sample Inferential Statistics In an experiment there are two or more conditions One condition is often called the control condition in which the treatment is
psyc3010 lecture 2 factorial between-ps ANOVA I: omnibus tests
 psyc3010 lecture 2 factorial between-ps ANOVA I: omnibus tests last lecture: introduction to factorial designs next lecture: factorial between-ps ANOVA II: (effect sizes and follow-up tests) 1 general
1. What does the alternate hypothesis ask for a one-way between-subjects analysis of variance?
 1. What does the alternate hypothesis ask for a one-way between-subjects analysis of variance? 2. What is the difference between between-group variability and within-group variability? 3. What does between-group
Analysis of Variance (ANOVA)
") Analysis of Variance (ANOVA) Two types of ANOVA tests: Independent measures and Repeated measures Comparing 2 means: X 1 = 20 t - test X 2 = 30 How can we Compare 3 means?: X 1 = 20 X 2 = 30 X 3 = 35 ANOVA
Analysis of Variance (ANOVA) Two types of ANOVA tests: Independent measures and Repeated measures Comparing 2 means: X 1 = 20 t - test X 2 = 30 How can we Compare 3 means?: X 1 = 20 X 2 = 30 X 3 = 35 ANOVA
OHSU OGI Class ECE-580-DOE :Design of Experiments Steve Brainerd
 Why We Use Analysis of Variance to Compare Group Means and How it Works The question of how to compare the population means of more than two groups is an important one to researchers. Let us suppose that
Hypothesis testing: Steps
 Review for Exam 2 Hypothesis testing: Steps Exam 2 Review 1. Determine appropriate test and hypotheses 2. Use distribution table to find critical statistic value(s) representing rejection region 3. Compute
Introduction to Business Statistics QM 220 Chapter 12
 Department of Quantitative Methods & Information Systems Introduction to Business Statistics QM 220 Chapter 12 Dr. Mohammad Zainal 12.1 The F distribution We already covered this topic in Ch. 10 QM-220,
The t-statistic. Student s t Test
 The t-statistic 1 Student s t Test When the population standard deviation is not known, you cannot use a z score hypothesis test Use Student s t test instead Student s t, or t test is, conceptually, very
8/28/2017. Repeated-Measures ANOVA. 1. Situation/hypotheses. 2. Test statistic. 3.Distribution. 4. Assumptions
 PSY 5101: Advanced Statistics for Psychological and Behavioral Research 1 Rationale of Repeated Measures ANOVA One-way and two-way Benefits Partitioning Variance Statistical Problems with Repeated- Measures
Variance Estimates and the F Ratio. ERSH 8310 Lecture 3 September 2, 2009
 Variance Estimates and the F Ratio ERSH 8310 Lecture 3 September 2, 2009 Today s Class Completing the analysis (the ANOVA table) Evaluating the F ratio Errors in hypothesis testing A complete numerical
Data Analysis and Statistical Methods Statistics 651
 Data Analysis and Statistical Methods Statistics 651 http://www.stat.tamu.edu/~suhasini/teaching.html Suhasini Subba Rao Motivations for the ANOVA We defined the F-distribution, this is mainly used in
Hypothesis testing: Steps
 Review for Exam 2 Hypothesis testing: Steps Repeated-Measures ANOVA 1. Determine appropriate test and hypotheses 2. Use distribution table to find critical statistic value(s) representing rejection region
PSYC 331 STATISTICS FOR PSYCHOLOGISTS
 PSYC 331 STATISTICS FOR PSYCHOLOGISTS Session 4 A PARAMETRIC STATISTICAL TEST FOR MORE THAN TWO POPULATIONS Lecturer: Dr. Paul Narh Doku, Dept of Psychology, UG Contact Information: pndoku@ug.edu.gh College
Independent Samples ANOVA
 Independent Samples ANOVA In this example students were randomly assigned to one of three mnemonics (techniques for improving memory) rehearsal (the control group; simply repeat the words), visual imagery
ANOVA continued. Chapter 11
 ANOVA continued Chapter 11 Zettergren (003) School adjustment in adolescence for previously rejected, average, and popular children. Effect of peer reputation on academic performance and school adjustment
Keppel, G. & Wickens, T.D. Design and Analysis Chapter 2: Sources of Variability and Sums of Squares
 Keppel, G. & Wickens, T.D. Design and Analysis Chapter 2: Sources of Variability and Sums of Squares K&W introduce the notion of a simple experiment with two conditions. Note that the raw data (p. 16)
Chapter 9 Inferences from Two Samples
 Chapter 9 Inferences from Two Samples 9-1 Review and Preview 9-2 Two Proportions 9-3 Two Means: Independent Samples 9-4 Two Dependent Samples (Matched Pairs) 9-5 Two Variances or Standard Deviations Review
ANOVA continued. Chapter 10
 ANOVA continued Chapter 10 Zettergren (003) School adjustment in adolescence for previously rejected, average, and popular children. Effect of peer reputation on academic performance and school adjustment
Comparing the means of more than two groups
 Comparing the means of more than two groups Chapter 15 Analysis of variance (ANOVA) Like a t-test, but can compare more than two groups Asks whether any of two or more means is different from any other.
Department of Economics. Business Statistics. Chapter 12 Chi-square test of independence & Analysis of Variance ECON 509. Dr.
 Department of Economics Business Statistics Chapter 1 Chi-square test of independence & Analysis of Variance ECON 509 Dr. Mohammad Zainal Chapter Goals After completing this chapter, you should be able
Advanced Experimental Design
 Advanced Experimental Design Topic Four Hypothesis testing (z and t tests) & Power Agenda Hypothesis testing Sampling distributions/central limit theorem z test (σ known) One sample z & Confidence intervals
One-Way ANOVA. Some examples of when ANOVA would be appropriate include:
 One-Way ANOVA 1. Purpose Analysis of variance (ANOVA) is used when one wishes to determine whether two or more groups (e.g., classes A, B, and C) differ on some outcome of interest (e.g., an achievement
In a one-way ANOVA, the total sums of squares among observations is partitioned into two components: Sums of squares represent:
 Activity #10: AxS ANOVA (Repeated subjects design) Resources: optimism.sav So far in MATH 300 and 301, we have studied the following hypothesis testing procedures: 1) Binomial test, sign-test, Fisher s
ANOVA continued. Chapter 10
 ANOVA continued Chapter 10 Zettergren (003) School adjustment in adolescence for previously rejected, average, and popular children. Effect of peer reputation on academic performance and school adjustment
CIVL /8904 T R A F F I C F L O W T H E O R Y L E C T U R E - 8
 CIVL - 7904/8904 T R A F F I C F L O W T H E O R Y L E C T U R E - 8 Chi-square Test How to determine the interval from a continuous distribution I = Range 1 + 3.322(logN) I-> Range of the class interval
Summary of Chapter 7 (Sections ) and Chapter 8 (Section 8.1)
 and Chapter 8 (Section 8.1)") Summary of Chapter 7 (Sections 7.2-7.5) and Chapter 8 (Section 8.1) Chapter 7. Tests of Statistical Hypotheses 7.2. Tests about One Mean (1) Test about One Mean Case 1: σ is known. Assume that X N(µ, σ
Summary of Chapter 7 (Sections 7.2-7.5) and Chapter 8 (Section 8.1) Chapter 7. Tests of Statistical Hypotheses 7.2. Tests about One Mean (1) Test about One Mean Case 1: σ is known. Assume that X N(µ, σ
Sampling distribution of t. 2. Sampling distribution of t. 3. Example: Gas mileage investigation. II. Inferential Statistics (8) t =
 t =") 2. The distribution of t values that would be obtained if a value of t were calculated for each sample mean for all possible random of a given size from a population _ t ratio: (X - µ hyp ) t s x The result
2. The distribution of t values that would be obtained if a value of t were calculated for each sample mean for all possible random of a given size from a population _ t ratio: (X - µ hyp ) t s x The result
Statistics Primer. ORC Staff: Jayme Palka Peter Boedeker Marcus Fagan Trey Dejong
 Statistics Primer ORC Staff: Jayme Palka Peter Boedeker Marcus Fagan Trey Dejong 1 Quick Overview of Statistics 2 Descriptive vs. Inferential Statistics Descriptive Statistics: summarize and describe data
Chapter 8 Student Lecture Notes 8-1. Department of Economics. Business Statistics. Chapter 12 Chi-square test of independence & Analysis of Variance
 Chapter 8 Student Lecture Notes 8-1 Department of Economics Business Statistics Chapter 1 Chi-square test of independence & Analysis of Variance ECON 509 Dr. Mohammad Zainal Chapter Goals After completing
Analysis of Variance
 Statistical Techniques II EXST7015 Analysis of Variance 15a_ANOVA_Introduction 1 Design The simplest model for Analysis of Variance (ANOVA) is the CRD, the Completely Randomized Design This model is also
What Does the F-Ratio Tell Us?
 Planned Comparisons What Does the F-Ratio Tell Us? The F-ratio (called an omnibus or overall F) provides a test of whether or not there a treatment effects in an experiment A significant F-ratio suggests
Section 9.5. Testing the Difference Between Two Variances. Bluman, Chapter 9 1
 Section 9.5 Testing the Difference Between Two Variances Bluman, Chapter 9 1 This the last day the class meets before spring break starts. Please make sure to be present for the test or make appropriate
Analysis of Variance: Part 1
 Analysis of Variance: Part 1 Oneway ANOVA When there are more than two means Each time two means are compared the probability (Type I error) =α. When there are more than two means Each time two means are
ANCOVA. Psy 420 Andrew Ainsworth
 ANCOVA Psy 420 Andrew Ainsworth What is ANCOVA? Analysis of covariance an extension of ANOVA in which main effects and interactions are assessed on DV scores after the DV has been adjusted for by the DV
Your schedule of coming weeks. One-way ANOVA, II. Review from last time. Review from last time /22/2004. Create ANOVA table
 Your schedule of coming weeks One-way ANOVA, II 9.07 //00 Today: One-way ANOVA, part II Next week: Two-way ANOVA, parts I and II. One-way ANOVA HW due Thursday Week of May Teacher out of town all week
COSC 341 Human Computer Interaction. Dr. Bowen Hui University of British Columbia Okanagan
 COSC 341 Human Computer Interaction Dr. Bowen Hui University of British Columbia Okanagan 1 Last Topic Distribution of means When it is needed How to build one (from scratch) Determining the characteristics
" M A #M B. Standard deviation of the population (Greek lowercase letter sigma) σ 2
 σ 2") Notation and Equations for Final Exam Symbol Definition X The variable we measure in a scientific study n The size of the sample N The size of the population M The mean of the sample µ The mean of the
Notation and Equations for Final Exam Symbol Definition X The variable we measure in a scientific study n The size of the sample N The size of the population M The mean of the sample µ The mean of the
Analysis of Variance (ANOVA)
") Analysis of Variance (ANOVA) Used for comparing or more means an extension of the t test Independent Variable (factor) = categorical (qualita5ve) predictor should have at least levels, but can have many
Analysis of Variance (ANOVA) Used for comparing or more means an extension of the t test Independent Variable (factor) = categorical (qualita5ve) predictor should have at least levels, but can have many
Chapter 12. ANalysis Of VAriance. Lecture 1 Sections:
 Chapter 1 ANalysis Of VAriance Lecture 1 Sections: 1.1 1. ANOVA test is an extension of two sample independent t-test demonstrated how to compare differences of means between two groups. The t-test is
INTRODUCTION TO ANALYSIS OF VARIANCE
 CHAPTER 22 INTRODUCTION TO ANALYSIS OF VARIANCE Chapter 18 on inferences about population means illustrated two hypothesis testing situations: for one population mean and for the difference between two
Student s t-distribution. The t-distribution, t-tests, & Measures of Effect Size
 Student s t-distribution The t-distribution, t-tests, & Measures of Effect Size Sampling Distributions Redux Chapter 7 opens with a return to the concept of sampling distributions from chapter 4 Sampling
Lab #12: Exam 3 Review Key
 Psychological Statistics Practice Lab#1 Dr. M. Plonsky Page 1 of 7 Lab #1: Exam 3 Review Key 1) a. Probability - Refers to the likelihood that an event will occur. Ranges from 0 to 1. b. Sampling Distribution
Statistical methods for comparing multiple groups. Lecture 7: ANOVA. ANOVA: Definition. ANOVA: Concepts
 Statistical methods for comparing multiple groups Lecture 7: ANOVA Sandy Eckel seckel@jhsph.edu 30 April 2008 Continuous data: comparing multiple means Analysis of variance Binary data: comparing multiple
Note: k = the # of conditions n = # of data points in a condition N = total # of data points
 The ANOVA for2 Dependent Groups -- Analysis of 2-Within (or Matched)-Group Data with a Quantitative Response Variable Application: This statistic has two applications that can appear very different, but
Using SPSS for One Way Analysis of Variance
 Using SPSS for One Way Analysis of Variance This tutorial will show you how to use SPSS version 12 to perform a one-way, between- subjects analysis of variance and related post-hoc tests. This tutorial
PLSC PRACTICE TEST ONE
 PLSC 724 - PRACTICE TEST ONE 1. Discuss briefly the relationship between the shape of the normal curve and the variance. 2. What is the relationship between a statistic and a parameter? 3. How is the α
Lecture 18: Analysis of variance: ANOVA
 Lecture 18: Announcements: Exam has been graded. See website for results. Lecture 18: Announcements: Exam has been graded. See website for results. Reading: Vasilj pp. 83-97. Lecture 18: Announcements:
Analysis of variance (ANOVA) ANOVA. Null hypothesis for simple ANOVA. H 0 : Variance among groups = 0
 ANOVA. Null hypothesis for simple ANOVA. H 0 : Variance among groups = 0") Analysis of variance (ANOVA) ANOVA Comparing the means of more than two groups Like a t-test, but can compare more than two groups Asks whether any of two or more means is different from any other. In
Analysis of variance (ANOVA) ANOVA Comparing the means of more than two groups Like a t-test, but can compare more than two groups Asks whether any of two or more means is different from any other. In
An inferential procedure to use sample data to understand a population Procedures
 Hypothesis Test An inferential procedure to use sample data to understand a population Procedures Hypotheses, the alpha value, the critical region (z-scores), statistics, conclusion Two types of errors
ANALYTICAL COMPARISONS AMONG TREATMENT MEANS (CHAPTER 4)
") ANALYTICAL COMPARISONS AMONG TREATMENT MEANS (CHAPTER 4) ERSH 8310 Fall 2007 September 11, 2007 Today s Class The need for analytic comparisons. Planned comparisons. Comparisons among treatment means.
ANALYTICAL COMPARISONS AMONG TREATMENT MEANS (CHAPTER 4) ERSH 8310 Fall 2007 September 11, 2007 Today s Class The need for analytic comparisons. Planned comparisons. Comparisons among treatment means.
Factorial Analysis of Variance
 Factorial Analysis of Variance Conceptual Example A repeated-measures t-test is more likely to lead to rejection of the null hypothesis if a) *Subjects show considerable variability in their change scores.
Chapter 10: Analysis of variance (ANOVA)
") Chapter 10: Analysis of variance (ANOVA) ANOVA (Analysis of variance) is a collection of techniques for dealing with more general experiments than the previous one-sample or two-sample tests. We first
Chapter 10: Analysis of variance (ANOVA) ANOVA (Analysis of variance) is a collection of techniques for dealing with more general experiments than the previous one-sample or two-sample tests. We first
2 and F Distributions. Barrow, Statistics for Economics, Accounting and Business Studies, 4 th edition Pearson Education Limited 2006
 and F Distributions Lecture 9 Distribution The distribution is used to: construct confidence intervals for a variance compare a set of actual frequencies with expected frequencies test for association
Multiple Regression. More Hypothesis Testing. More Hypothesis Testing The big question: What we really want to know: What we actually know: We know:
 Multiple Regression Ψ320 Ainsworth More Hypothesis Testing What we really want to know: Is the relationship in the population we have selected between X & Y strong enough that we can use the relationship
One-factor analysis of variance (ANOVA)
") One-factor analysis of variance (ANOVA) March 1, 2017 psych10.stanford.edu Announcements / Action Items Schedule update: final R lab moved to Week 10 Optional Survey 5 coming soon, due on Saturday Last
One-factor analysis of variance (ANOVA) March 1, 2017 psych10.stanford.edu Announcements / Action Items Schedule update: final R lab moved to Week 10 Optional Survey 5 coming soon, due on Saturday Last
Analysis of variance
 Analysis of variance 1 Method If the null hypothesis is true, then the populations are the same: they are normal, and they have the same mean and the same variance. We will estimate the numerical value
Analysis Of Variance Compiled by T.O. Antwi-Asare, U.G
 Analysis Of Variance Compiled by T.O. Antwi-Asare, U.G 1 ANOVA Analysis of variance compares two or more population means of interval data. Specifically, we are interested in determining whether differences
CHAPTER 17 CHI-SQUARE AND OTHER NONPARAMETRIC TESTS FROM: PAGANO, R. R. (2007)
") FROM: PAGANO, R. R. (007) I. INTRODUCTION: DISTINCTION BETWEEN PARAMETRIC AND NON-PARAMETRIC TESTS Statistical inference tests are often classified as to whether they are parametric or nonparametric Parameter
FROM: PAGANO, R. R. (007) I. INTRODUCTION: DISTINCTION BETWEEN PARAMETRIC AND NON-PARAMETRIC TESTS Statistical inference tests are often classified as to whether they are parametric or nonparametric Parameter
Hypothesis Testing hypothesis testing approach formulation of the test statistic
 Hypothesis Testing For the next few lectures, we re going to look at various test statistics that are formulated to allow us to test hypotheses in a variety of contexts: In all cases, the hypothesis testing
16.400/453J Human Factors Engineering. Design of Experiments II
 J Human Factors Engineering Design of Experiments II Review Experiment Design and Descriptive Statistics Research question, independent and dependent variables, histograms, box plots, etc. Inferential
Psych 230. Psychological Measurement and Statistics
 Psych 230 Psychological Measurement and Statistics Pedro Wolf December 9, 2009 This Time. Non-Parametric statistics Chi-Square test One-way Two-way Statistical Testing 1. Decide which test to use 2. State
Inferences About the Difference Between Two Means
 7 Inferences About the Difference Between Two Means Chapter Outline 7.1 New Concepts 7.1.1 Independent Versus Dependent Samples 7.1. Hypotheses 7. Inferences About Two Independent Means 7..1 Independent
DISTRIBUTIONS USED IN STATISTICAL WORK
 DISTRIBUTIONS USED IN STATISTICAL WORK In one of the classic introductory statistics books used in Education and Psychology (Glass and Stanley, 1970, Prentice-Hall) there was an excellent chapter on different
Analysis of Variance: Repeated measures
 Repeated-Measures ANOVA: Analysis of Variance: Repeated measures Each subject participates in all conditions in the experiment (which is why it is called repeated measures). A repeated-measures ANOVA is
Assignment #7. Chapter 12: 18, 24 Chapter 13: 28. Due next Friday Nov. 20 th by 2pm in your TA s homework box
 Assignment #7 Chapter 12: 18, 24 Chapter 13: 28 Due next Friday Nov. 20 th by 2pm in your TA s homework box Lab Report Posted on web-site Dates Rough draft due to TAs homework box on Monday Nov. 16 th
Example: Four levels of herbicide strength in an experiment on dry weight of treated plants.
 The idea of ANOVA Reminders: A factor is a variable that can take one of several levels used to differentiate one group from another. An experiment has a one-way, or completely randomized, design if several
Factorial Independent Samples ANOVA
 Factorial Independent Samples ANOVA Liljenquist, Zhong and Galinsky (2010) found that people were more charitable when they were in a clean smelling room than in a neutral smelling room. Based on that
HYPOTHESIS TESTING. Hypothesis Testing
 MBA 605 Business Analytics Don Conant, PhD. HYPOTHESIS TESTING Hypothesis testing involves making inferences about the nature of the population on the basis of observations of a sample drawn from the population.
One-Way Analysis of Variance (ANOVA) Paul K. Strode, Ph.D.
 Paul K. Strode, Ph.D.") One-Way Analysis of Variance (ANOVA) Paul K. Strode, Ph.D. Purpose While the T-test is useful to compare the means of two samples, many biology experiments involve the parallel measurement of three or
One-Way Analysis of Variance (ANOVA) Paul K. Strode, Ph.D. Purpose While the T-test is useful to compare the means of two samples, many biology experiments involve the parallel measurement of three or
Analysis of variance (ANOVA) Comparing the means of more than two groups
 Comparing the means of more than two groups") Analysis of variance (ANOVA) Comparing the means of more than two groups Example: Cost of mating in male fruit flies Drosophila Treatments: place males with and without unmated (virgin) females Five treatments
Analysis of variance (ANOVA) Comparing the means of more than two groups Example: Cost of mating in male fruit flies Drosophila Treatments: place males with and without unmated (virgin) females Five treatments
Advanced Experimental Design
 Advanced Experimental Design Topic 8 Chapter : Repeated Measures Analysis of Variance Overview Basic idea, different forms of repeated measures Partialling out between subjects effects Simple repeated
One-Way ANOVA Source Table J - 1 SS B / J - 1 MS B /MS W. Pairwise Post-Hoc Comparisons of Means
 One-Way ANOVA Source Table ANOVA MODEL: ij = µ* + α j + ε ij H 0 : µ 1 = µ =... = µ j or H 0 : Σα j = 0 Source Sum of Squares df Mean Squares F Between Groups n j ( j - * ) J - 1 SS B / J - 1 MS B /MS
Lecture 11: Two Way Analysis of Variance
 Lecture 11: Two Way Analysis of Variance Review: Hypothesis Testing o ANOVA/F ratio: comparing variances o F = s variance between treatment effect + chance s variance within sampling error (chance effects)
10.4 Hypothesis Testing: Two Independent Samples Proportion
 10.4 Hypothesis Testing: Two Independent Samples Proportion Example 3: Smoking cigarettes has been known to cause cancer and other ailments. One politician believes that a higher tax should be imposed
BIOL Biometry LAB 6 - SINGLE FACTOR ANOVA and MULTIPLE COMPARISON PROCEDURES
 BIOL 458 - Biometry LAB 6 - SINGLE FACTOR ANOVA and MULTIPLE COMPARISON PROCEDURES PART 1: INTRODUCTION TO ANOVA Purpose of ANOVA Analysis of Variance (ANOVA) is an extremely useful statistical method
Chapter 16 One-way Analysis of Variance
 Chapter 16 One-way Analysis of Variance I am assuming that most people would prefer to see the solutions to these problems as computer printout. (I will use R and SPSS for consistency.) 16.1 Analysis of