The t-test: A z-score for a sample mean tells us where in the distribution the particular mean lies
|
|
|
- Jocelyn Diana Gaines
- 5 years ago
- Views:
Transcription
. Benefit of a normal distribution is that we know what proportion of means lie within a certain margin of the mean.")


1 The t-test: So Far: Sampling distribution benefit is that even if the original population is not normal, a sampling distribution based on this population will be normal (for sample size > 30). Benefit of a normal distribution is that we know what proportion of means lie within a certain margin of the mean. The distances from the mean are best understood in terms of z- scores. Example of a non-normal or skewed distribution: Annual income of Americans. Many people in the lower and medium income bracket; very few are ultra rich. (So distribution is NOT normal.) Today: Single sample and Independent-measures (between-subjects) tests Frequency Next week: Repeated-measures (within-subjects) test Low Income High Sampling distribution based on a skewed population distribution A z-score for a sample mean tells us where in the distribution the particular mean lies z = -2 z = -1 z = 0 z = +1 z = +2 µ = mean σ X = standard deviation µ 3σ X µ 2σ X µ σ X µ µ +σ X µ + 2σ X µ + 3σ X From the z-score we can decide how many sample means are above/below that particular mean. 1
2 For example for z = % means lie above it and 84.13% means lie below it z = z = +1 z = From last week: Hypothesis testing 1. Small difference between sample mean and population mean retain null hypothesis (difference has occurred by chance). Large difference reject null hypothesis in favour of alternative hypothesis (difference has not occurred by chance, it is real. (OR a large difference can occur by chance only very rarely). 2. "Large" is a difference that is likely to occur by chance only 5% of the time or less (p <.05) a compromise between Type 1 and Type 2 errors. 3. Directional hypothesis versus non-directional hypothesis. µ 3σ X µ 2σ X µ σ X µ µ +σ X µ + 2σ X µ + 3σ X Two new things today: 1) We use the z-test when we know the population SD. When we don t know the population SD, we calculate SD from the sample, and use the t-test. z = X µ σ X t = X µ 2) We have been discussing single samples. - Reason: Learning how to work single samples is easier (less computation). - Today we ll learn how to deal with two samples. TWO DIFFERENCES between a z-test and a t-test: (1): When population SD (σ) is known we use to compute the error term for the z-test. BUT if we don t know σ, we do a t-test, and we calculate what is called an unbiased sample SD (ŝ) as follows: (X i X ) 2 s ˆ = N 1 2 sum of squares = SS = (X i X ) Then we use ŝ to compute what is called the estimated error term ( ) as follows: estσ = s ˆ X N σ N 2
3 (2): In performing a t-test we use a t-distribution. t-distribution is used the same way as the z-distribution, BUT unlike the z-distribution there are as many different t-distributions. And which one we use will depend on sample size, and the df = degrees of freedom. df = N - 1 Example: Suppose a city s year-four children take a maths exam and produce µ = 75. At the beginning of the year 26 children are chosen at random to take part in an experiment, which involves special teaching methods. At the end of the year this group produces X = 81. Population standard deviation is unknown; the unbiased sample standard deviation is ŝ = Did the special teaching methods work? We choose α = 0.05 WE WILL USE THE t-test. NOTE: POPULATION SD IS NOT KNOWN H 0 : µ s = 75 (no effect) H 1 : µ s 75 (there is an effect) Hypothesis testing from last week: If z-observed z-critical then reject H 0 Finding t-critical from the t-distribution Comparison of t-distributions for df = 4 and df = 25; α = 0.05 Now it is: If t-observed t-critical then reject H 0 Before we find t-critical we need to find out which distribution to look at For sample size 26; df = 25 Portion of a table of critical values of t (two tailed) If t-observed then reject H 0 3
4 Calculating t-observed Calculating t-observed t is computed the same way as z, except we use an estimate of σ X ( ) t = X µ = ˆ s N Computing z-observed versus t-observed z = X µ σ X t = X µ σ X = σ N = ˆ s N t = = =1.88 Since this is smaller than t-critical; we fail to reject the null hypothesis. If our hypothesis was directional (one-tailed): Special teaching methods will improve the maths score Then we would have been successful in rejecting the null hypothesis as t-critical = (for a one-tailed test, at α =.05) two-tailed df = 25 lower t-critical value upper t-critical value t-critical value one-tailed df = Two-Sample Experiment This involves more complex computations, BUT it is much more applicable in everyday life. Independent measures t-test. 4
5 Working with two samples: Using subscripts - Stating the null hypothesis: µ 1 - µ 2 = 0 - Two sample means:, - The error term: 1 - Two sample sizes : N 1, N 2 - Two degrees of freedom df 1, df 2 EXAMPLE: Experiment on the effects of alcohol on task performance (time taken to type 20 words). Measure time taken to perform the task for one set of subjects when under the influence of alcohol, and a different set of subjects when sober. Null hypothesis: alcohol has no effect on time taken: variation between the drunk sample mean and the sober sample mean is due to sampling variation. i.e. The drunk and sober mean performance times are based on samples from the same population. Subject group 1 Subject group 2 Participant Participant Participant Participant Participant Participant Participant Participant Participant Participant Participant Participant Participant Participant Participant Participant Participant Participant Participant Participant t = ( ) (µ 1 µ 2 )hypothesized 1 the difference between samples means (should be close to zero if there is no difference between the two conditions) the predicted average difference between scores in our two samples (usually zero, since we assume the two samples don t differ ) estimated standard error of the difference between means (a measure of how much the difference between means might vary from one occasion to the next). 5
6 1 t = ( ) (µ 1 µ 2 )hypothesized 1 = 4.58 Subject group 1 Subject group 2 Participant Participant Participant Participant Participant Participant Participant Participant Participant Participant Participant Participant Participant Participant Participant Participant Participant Participant Participant Participant =164.4 =16.44 =118.6 =11.86 s p 2 = 2 t = ( ) (µ 1 µ 2 )hypothesized 1 2a Calculating pooled variance 2 ( ) + (X2 ) 2 df 1 + df 2 s p 2 = SS 1 + SS 2 df 1 + df 2 2b Calculating two sample standard error 1 = s 2 p + s 2 p N 1 N 2 2a Participant 1 Participant 2 Participant 3 Participant 4 Participant 5 Participant 6 Participant 7 Participant 8 Participant 9 Participant 10 SS 1 = ( ) = Participant 1 Participant 2 Participant 3 Participant 4 Participant 5 Participant 6 Participant 7 Participant 8 Participant 9 Participant 10 =11.86 Subject group 1 Subject group 2 X ( ) 2 ( ) = SS2 = ( ) = a 2b s p 2 = N 1 = 10; df =9 N 2 = 10; df=9 s p 2 = SS 1 + SS 2 df 1 + df = s 2 p + s 2 p = 3.56 N 1 N = 3.56 = =
 = 5.429, p < 0.")
7 t(observed) = ( ) (µ 1 µ 2 )hypothesized 1 3 Frequently µ 1 µ 2 = 0 6 t = = df = (N 1 1)+(N 2 1) = 18 finding t-critical from the table: t-critical = 2.10; df = 18 7 Decision: t-observed > t-critical Therefore reject the null hypothesis Alcohol has an impact of time taken on the task. t(18) = 5.429, p < 0.05 Data Entry Using SPSS to do an independent measures t-test 7

 t-test) 8")
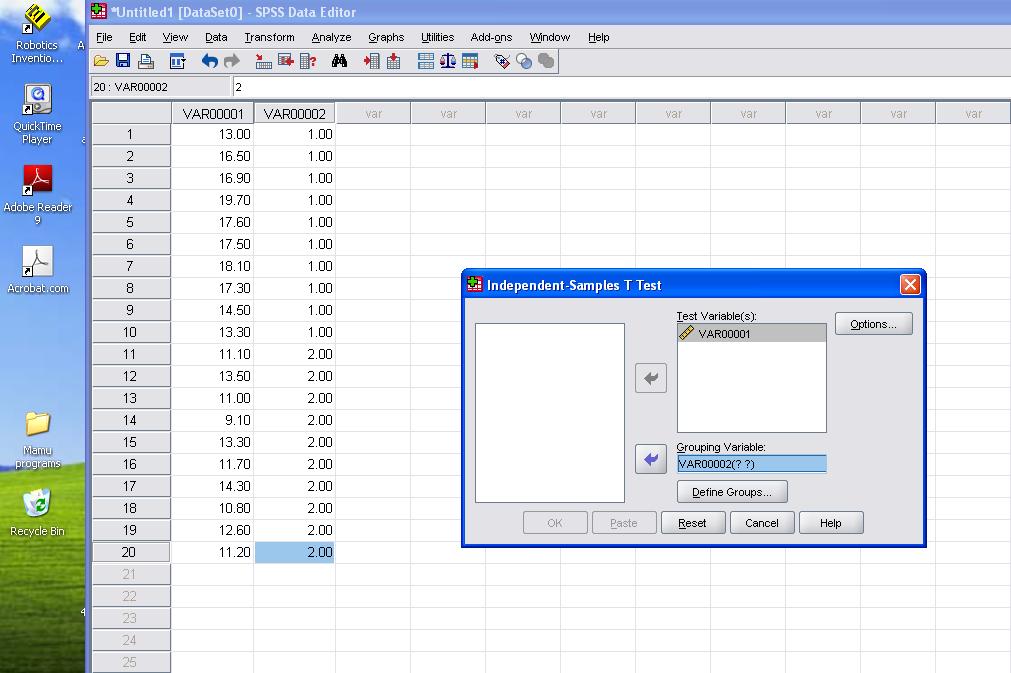
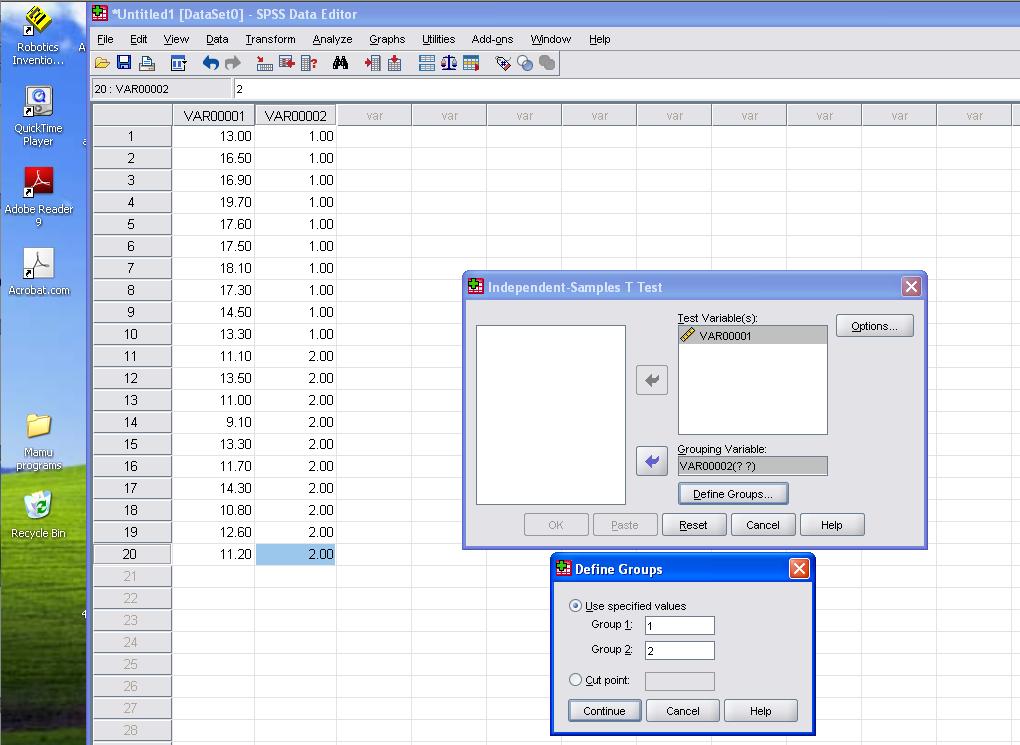
8 Running SPSS (independent measures t-test) Running SPSS (independent measures t-test) Running SPSS (independent measures t-test) Running SPSS (independent measures t-test) 8
9 SPSS output (independent measures t-test) 9
Sampling Distributions: Central Limit Theorem
 Review for Exam 2 Sampling Distributions: Central Limit Theorem Conceptually, we can break up the theorem into three parts: 1. The mean (µ M ) of a population of sample means (M) is equal to the mean (µ)
An inferential procedure to use sample data to understand a population Procedures
 Hypothesis Test An inferential procedure to use sample data to understand a population Procedures Hypotheses, the alpha value, the critical region (z-scores), statistics, conclusion Two types of errors
HYPOTHESIS TESTING. Hypothesis Testing
 MBA 605 Business Analytics Don Conant, PhD. HYPOTHESIS TESTING Hypothesis testing involves making inferences about the nature of the population on the basis of observations of a sample drawn from the population.
CIVL /8904 T R A F F I C F L O W T H E O R Y L E C T U R E - 8
 CIVL - 7904/8904 T R A F F I C F L O W T H E O R Y L E C T U R E - 8 Chi-square Test How to determine the interval from a continuous distribution I = Range 1 + 3.322(logN) I-> Range of the class interval
Analysis of Variance (ANOVA)
") Analysis of Variance (ANOVA) Two types of ANOVA tests: Independent measures and Repeated measures Comparing 2 means: X 1 = 20 t - test X 2 = 30 How can we Compare 3 means?: X 1 = 20 X 2 = 30 X 3 = 35 ANOVA
Analysis of Variance (ANOVA) Two types of ANOVA tests: Independent measures and Repeated measures Comparing 2 means: X 1 = 20 t - test X 2 = 30 How can we Compare 3 means?: X 1 = 20 X 2 = 30 X 3 = 35 ANOVA
PSY 216. Assignment 9 Answers. Under what circumstances is a t statistic used instead of a z-score for a hypothesis test
 PSY 216 Assignment 9 Answers 1. Problem 1 from the text Under what circumstances is a t statistic used instead of a z-score for a hypothesis test The t statistic should be used when the population standard
T.I.H.E. IT 233 Statistics and Probability: Sem. 1: 2013 ESTIMATION AND HYPOTHESIS TESTING OF TWO POPULATIONS
 ESTIMATION AND HYPOTHESIS TESTING OF TWO POPULATIONS In our work on hypothesis testing, we used the value of a sample statistic to challenge an accepted value of a population parameter. We focused only
10/31/2012. One-Way ANOVA F-test
 PSY 511: Advanced Statistics for Psychological and Behavioral Research 1 1. Situation/hypotheses 2. Test statistic 3.Distribution 4. Assumptions One-Way ANOVA F-test One factor J>2 independent samples
Two-Sample Inferential Statistics
 The t Test for Two Independent Samples 1 Two-Sample Inferential Statistics In an experiment there are two or more conditions One condition is often called the control condition in which the treatment is
Hypothesis testing: Steps
 Review for Exam 2 Hypothesis testing: Steps Exam 2 Review 1. Determine appropriate test and hypotheses 2. Use distribution table to find critical statistic value(s) representing rejection region 3. Compute
Student s t-distribution. The t-distribution, t-tests, & Measures of Effect Size
 Student s t-distribution The t-distribution, t-tests, & Measures of Effect Size Sampling Distributions Redux Chapter 7 opens with a return to the concept of sampling distributions from chapter 4 Sampling
CBA4 is live in practice mode this week exam mode from Saturday!
 Announcements CBA4 is live in practice mode this week exam mode from Saturday! Material covered: Confidence intervals (both cases) 1 sample hypothesis tests (both cases) Hypothesis tests for 2 means as
Lab #12: Exam 3 Review Key
 Psychological Statistics Practice Lab#1 Dr. M. Plonsky Page 1 of 7 Lab #1: Exam 3 Review Key 1) a. Probability - Refers to the likelihood that an event will occur. Ranges from 0 to 1. b. Sampling Distribution
Distribution of sample means
 Two types of statistics: and Distribution of sample means Mean Standard deviation Population Sample The relationship between Population and Samples is described in terms of Probability A jar with 100 marbles,
INTERVAL ESTIMATION AND HYPOTHESES TESTING
 INTERVAL ESTIMATION AND HYPOTHESES TESTING 1. IDEA An interval rather than a point estimate is often of interest. Confidence intervals are thus important in empirical work. To construct interval estimates,
Difference in two or more average scores in different groups
 ANOVAs Analysis of Variance (ANOVA) Difference in two or more average scores in different groups Each participant tested once Same outcome tested in each group Simplest is one-way ANOVA (one variable as
Applied Statistics for the Behavioral Sciences
 Applied Statistics for the Behavioral Sciences Chapter 8 One-sample designs Hypothesis testing/effect size Chapter Outline Hypothesis testing null & alternative hypotheses alpha ( ), significance level,
Hypothesis testing: Steps
 Review for Exam 2 Hypothesis testing: Steps Repeated-Measures ANOVA 1. Determine appropriate test and hypotheses 2. Use distribution table to find critical statistic value(s) representing rejection region
Note: k = the # of conditions n = # of data points in a condition N = total # of data points
 The ANOVA for2 Dependent Groups -- Analysis of 2-Within (or Matched)-Group Data with a Quantitative Response Variable Application: This statistic has two applications that can appear very different, but
Variance Estimates and the F Ratio. ERSH 8310 Lecture 3 September 2, 2009
 Variance Estimates and the F Ratio ERSH 8310 Lecture 3 September 2, 2009 Today s Class Completing the analysis (the ANOVA table) Evaluating the F ratio Errors in hypothesis testing A complete numerical
Hypothesis Testing hypothesis testing approach formulation of the test statistic
 Hypothesis Testing For the next few lectures, we re going to look at various test statistics that are formulated to allow us to test hypotheses in a variety of contexts: In all cases, the hypothesis testing
Lectures 5 & 6: Hypothesis Testing
 Lectures 5 & 6: Hypothesis Testing in which you learn to apply the concept of statistical significance to OLS estimates, learn the concept of t values, how to use them in regression work and come across
10/4/2013. Hypothesis Testing & z-test. Hypothesis Testing. Hypothesis Testing
 & z-test Lecture Set 11 We have a coin and are trying to determine if it is biased or unbiased What should we assume? Why? Flip coin n = 100 times E(Heads) = 50 Why? Assume we count 53 Heads... What could
Can you tell the relationship between students SAT scores and their college grades?
 Correlation One Challenge Can you tell the relationship between students SAT scores and their college grades? A: The higher SAT scores are, the better GPA may be. B: The higher SAT scores are, the lower
1 Descriptive statistics. 2 Scores and probability distributions. 3 Hypothesis testing and one-sample t-test. 4 More on t-tests
 Overall Overview INFOWO Statistics lecture S3: Hypothesis testing Peter de Waal Department of Information and Computing Sciences Faculty of Science, Universiteit Utrecht 1 Descriptive statistics 2 Scores
Single Sample Means. SOCY601 Alan Neustadtl
 Single Sample Means SOCY601 Alan Neustadtl The Central Limit Theorem If we have a population measured by a variable with a mean µ and a standard deviation σ, and if all possible random samples of size
COSC 341 Human Computer Interaction. Dr. Bowen Hui University of British Columbia Okanagan
 COSC 341 Human Computer Interaction Dr. Bowen Hui University of British Columbia Okanagan 1 Last Topic Distribution of means When it is needed How to build one (from scratch) Determining the characteristics
Analysis of Variance: Part 1
 Analysis of Variance: Part 1 Oneway ANOVA When there are more than two means Each time two means are compared the probability (Type I error) =α. When there are more than two means Each time two means are
Unit 27 One-Way Analysis of Variance
 Unit 27 One-Way Analysis of Variance Objectives: To perform the hypothesis test in a one-way analysis of variance for comparing more than two population means Recall that a two sample t test is applied
Inferences for Correlation
 Inferences for Correlation Quantitative Methods II Plan for Today Recall: correlation coefficient Bivariate normal distributions Hypotheses testing for population correlation Confidence intervals for population
t-test for 2 matched/related/ dependent samples
 HUMBEHV 3HB3 two-sample t-tests & statistical power Week 9 Prof. Patrick Bennett Concepts from previous lectures t distribution standard error of the mean degrees-of-freedom Null and alternative/research
Population Variance. Concepts from previous lectures. HUMBEHV 3HB3 one-sample t-tests. Week 8
 Concepts from previous lectures HUMBEHV 3HB3 one-sample t-tests Week 8 Prof. Patrick Bennett sampling distributions - sampling error - standard error of the mean - degrees-of-freedom Null and alternative/research
Last two weeks: Sample, population and sampling distributions finished with estimation & confidence intervals
 Past weeks: Measures of central tendency (mean, mode, median) Measures of dispersion (standard deviation, variance, range, etc). Working with the normal curve Last two weeks: Sample, population and sampling
Statistical Inference for Means
 Statistical Inference for Means Jamie Monogan University of Georgia February 18, 2011 Jamie Monogan (UGA) Statistical Inference for Means February 18, 2011 1 / 19 Objectives By the end of this meeting,
Introduction to the Analysis of Variance (ANOVA)
") Introduction to the Analysis of Variance (ANOVA) The Analysis of Variance (ANOVA) The analysis of variance (ANOVA) is a statistical technique for testing for differences between the means of multiple (more
Introduction to the Analysis of Variance (ANOVA) The Analysis of Variance (ANOVA) The analysis of variance (ANOVA) is a statistical technique for testing for differences between the means of multiple (more
AMS7: WEEK 7. CLASS 1. More on Hypothesis Testing Monday May 11th, 2015
 AMS7: WEEK 7. CLASS 1 More on Hypothesis Testing Monday May 11th, 2015 Testing a Claim about a Standard Deviation or a Variance We want to test claims about or 2 Example: Newborn babies from mothers taking
Sampling distribution of t. 2. Sampling distribution of t. 3. Example: Gas mileage investigation. II. Inferential Statistics (8) t =
 t =") 2. The distribution of t values that would be obtained if a value of t were calculated for each sample mean for all possible random of a given size from a population _ t ratio: (X - µ hyp ) t s x The result
2. The distribution of t values that would be obtained if a value of t were calculated for each sample mean for all possible random of a given size from a population _ t ratio: (X - µ hyp ) t s x The result
Business Statistics. Lecture 10: Course Review
 Business Statistics Lecture 10: Course Review 1 Descriptive Statistics for Continuous Data Numerical Summaries Location: mean, median Spread or variability: variance, standard deviation, range, percentiles,
Introduction to Business Statistics QM 220 Chapter 12
 Department of Quantitative Methods & Information Systems Introduction to Business Statistics QM 220 Chapter 12 Dr. Mohammad Zainal 12.1 The F distribution We already covered this topic in Ch. 10 QM-220,
Difference between means - t-test /25
 Difference between means - t-test 1 Discussion Question p492 Ex 9-4 p492 1-3, 6-8, 12 Assume all variances are not equal. Ignore the test for variance. 2 Students will perform hypothesis tests for two
Harvard University. Rigorous Research in Engineering Education
 Statistical Inference Kari Lock Harvard University Department of Statistics Rigorous Research in Engineering Education 12/3/09 Statistical Inference You have a sample and want to use the data collected
Chapter 9 Inferences from Two Samples
 Chapter 9 Inferences from Two Samples 9-1 Review and Preview 9-2 Two Proportions 9-3 Two Means: Independent Samples 9-4 Two Dependent Samples (Matched Pairs) 9-5 Two Variances or Standard Deviations Review
16.400/453J Human Factors Engineering. Design of Experiments II
 J Human Factors Engineering Design of Experiments II Review Experiment Design and Descriptive Statistics Research question, independent and dependent variables, histograms, box plots, etc. Inferential
Analysis of Variance: Repeated measures
 Repeated-Measures ANOVA: Analysis of Variance: Repeated measures Each subject participates in all conditions in the experiment (which is why it is called repeated measures). A repeated-measures ANOVA is
8/23/2018. One-Way ANOVA F-test. 1. Situation/hypotheses. 2. Test statistic. 3.Distribution. 4. Assumptions
 PSY 5101: Advanced Statistics for Psychological and Behavioral Research 1 1. Situation/hypotheses 2. Test statistic One-Way ANOVA F-test One factor J>2 independent samples H o :µ 1 µ 2 µ J F 3.Distribution
Last week: Sample, population and sampling distributions finished with estimation & confidence intervals
 Past weeks: Measures of central tendency (mean, mode, median) Measures of dispersion (standard deviation, variance, range, etc). Working with the normal curve Last week: Sample, population and sampling
Independent Samples ANOVA
 Independent Samples ANOVA In this example students were randomly assigned to one of three mnemonics (techniques for improving memory) rehearsal (the control group; simply repeat the words), visual imagery
Mathematical Notation Math Introduction to Applied Statistics
 Mathematical Notation Math 113 - Introduction to Applied Statistics Name : Use Word or WordPerfect to recreate the following documents. Each article is worth 10 points and should be emailed to the instructor
Multiple Regression Analysis
 Multiple Regression Analysis y = β 0 + β 1 x 1 + β 2 x 2 +... β k x k + u 2. Inference 0 Assumptions of the Classical Linear Model (CLM)! So far, we know: 1. The mean and variance of the OLS estimators
The One-Way Repeated-Measures ANOVA. (For Within-Subjects Designs)
") The One-Way Repeated-Measures ANOVA (For Within-Subjects Designs) Logic of the Repeated-Measures ANOVA The repeated-measures ANOVA extends the analysis of variance to research situations using repeated-measures
The One-Way Repeated-Measures ANOVA (For Within-Subjects Designs) Logic of the Repeated-Measures ANOVA The repeated-measures ANOVA extends the analysis of variance to research situations using repeated-measures
PSY 305. Module 3. Page Title. Introduction to Hypothesis Testing Z-tests. Five steps in hypothesis testing
 Page Title PSY 305 Module 3 Introduction to Hypothesis Testing Z-tests Five steps in hypothesis testing State the research and null hypothesis Determine characteristics of comparison distribution Five
Correlation. A statistics method to measure the relationship between two variables. Three characteristics
 Correlation Correlation A statistics method to measure the relationship between two variables Three characteristics Direction of the relationship Form of the relationship Strength/Consistency Direction
Introduction to the Analysis of Variance (ANOVA) Computing One-Way Independent Measures (Between Subjects) ANOVAs
 Computing One-Way Independent Measures (Between Subjects) ANOVAs") Introduction to the Analysis of Variance (ANOVA) Computing One-Way Independent Measures (Between Subjects) ANOVAs The Analysis of Variance (ANOVA) The analysis of variance (ANOVA) is a statistical technique
Introduction to the Analysis of Variance (ANOVA) Computing One-Way Independent Measures (Between Subjects) ANOVAs The Analysis of Variance (ANOVA) The analysis of variance (ANOVA) is a statistical technique
The t-statistic. Student s t Test
 The t-statistic 1 Student s t Test When the population standard deviation is not known, you cannot use a z score hypothesis test Use Student s t test instead Student s t, or t test is, conceptually, very
Descriptive Statistics-I. Dr Mahmoud Alhussami
 Descriptive Statistics-I Dr Mahmoud Alhussami Biostatistics What is the biostatistics? A branch of applied math. that deals with collecting, organizing and interpreting data using well-defined procedures.
CHAPTER 9: HYPOTHESIS TESTING
 CHAPTER 9: HYPOTHESIS TESTING THE SECOND LAST EXAMPLE CLEARLY ILLUSTRATES THAT THERE IS ONE IMPORTANT ISSUE WE NEED TO EXPLORE: IS THERE (IN OUR TWO SAMPLES) SUFFICIENT STATISTICAL EVIDENCE TO CONCLUDE
Wed, June 26, (Lecture 8-2). Nonlinearity. Significance test for correlation R-squared, SSE, and SST. Correlation in SPSS.
. Nonlinearity. Significance test for correlation R-squared, SSE, and SST. Correlation in SPSS.") Wed, June 26, (Lecture 8-2). Nonlinearity. Significance test for correlation R-squared, SSE, and SST. Correlation in SPSS. Last time, we looked at scatterplots, which show the interaction between two variables,
Wed, June 26, (Lecture 8-2). Nonlinearity. Significance test for correlation R-squared, SSE, and SST. Correlation in SPSS. Last time, we looked at scatterplots, which show the interaction between two variables,
STA 101 Final Review
 STA 101 Final Review Statistics 101 Thomas Leininger June 24, 2013 Announcements All work (besides projects) should be returned to you and should be entered on Sakai. Office Hour: 2 3pm today (Old Chem
Notes for Week 13 Analysis of Variance (ANOVA) continued WEEK 13 page 1
 continued WEEK 13 page 1") Notes for Wee 13 Analysis of Variance (ANOVA) continued WEEK 13 page 1 Exam 3 is on Friday May 1. A part of one of the exam problems is on Predictiontervals : When randomly sampling from a normal population
Notes for Wee 13 Analysis of Variance (ANOVA) continued WEEK 13 page 1 Exam 3 is on Friday May 1. A part of one of the exam problems is on Predictiontervals : When randomly sampling from a normal population
Review. One-way ANOVA, I. What s coming up. Multiple comparisons
 Review One-way ANOVA, I 9.07 /15/00 Earlier in this class, we talked about twosample z- and t-tests for the difference between two conditions of an independent variable Does a trial drug work better than
PHP2510: Principles of Biostatistics & Data Analysis. Lecture X: Hypothesis testing. PHP 2510 Lec 10: Hypothesis testing 1
 PHP2510: Principles of Biostatistics & Data Analysis Lecture X: Hypothesis testing PHP 2510 Lec 10: Hypothesis testing 1 In previous lectures we have encountered problems of estimating an unknown population
Chapter 7 Comparison of two independent samples
 Chapter 7 Comparison of two independent samples 7.1 Introduction Population 1 µ σ 1 1 N 1 Sample 1 y s 1 1 n 1 Population µ σ N Sample y s n 1, : population means 1, : population standard deviations N
The One-Way Independent-Samples ANOVA. (For Between-Subjects Designs)
") The One-Way Independent-Samples ANOVA (For Between-Subjects Designs) Computations for the ANOVA In computing the terms required for the F-statistic, we won t explicitly compute any sample variances or
The One-Way Independent-Samples ANOVA (For Between-Subjects Designs) Computations for the ANOVA In computing the terms required for the F-statistic, we won t explicitly compute any sample variances or
Analysis of Covariance. The following example illustrates a case where the covariate is affected by the treatments.
 Analysis of Covariance In some experiments, the experimental units (subjects) are nonhomogeneous or there is variation in the experimental conditions that are not due to the treatments. For example, a
Statistics Primer. ORC Staff: Jayme Palka Peter Boedeker Marcus Fagan Trey Dejong
 Statistics Primer ORC Staff: Jayme Palka Peter Boedeker Marcus Fagan Trey Dejong 1 Quick Overview of Statistics 2 Descriptive vs. Inferential Statistics Descriptive Statistics: summarize and describe data
CHAPTER 17 CHI-SQUARE AND OTHER NONPARAMETRIC TESTS FROM: PAGANO, R. R. (2007)
") FROM: PAGANO, R. R. (007) I. INTRODUCTION: DISTINCTION BETWEEN PARAMETRIC AND NON-PARAMETRIC TESTS Statistical inference tests are often classified as to whether they are parametric or nonparametric Parameter
FROM: PAGANO, R. R. (007) I. INTRODUCTION: DISTINCTION BETWEEN PARAMETRIC AND NON-PARAMETRIC TESTS Statistical inference tests are often classified as to whether they are parametric or nonparametric Parameter
5 Basic Steps in Any Hypothesis Test
 5 Basic Steps in Any Hypothesis Test Step 1: Determine hypotheses (H0 and Ha). H0: μ d = 0 (μ 1 μ 2 =0) Ha: μ d > 0 (μ 1 μ 2 >0) upper-sided Ha: : μ d 0 (μ 1 μ 2 0) two-sided Step 2: Verify necessary conditions,
Inferential Statistics
 Inferential Statistics Part 1 Sampling Distributions, Point Estimates & Confidence Intervals Inferential statistics are used to draw inferences (make conclusions/judgements) about a population from a sample.
In ANOVA the response variable is numerical and the explanatory variables are categorical.
 1 ANOVA ANOVA means ANalysis Of VAriance. The ANOVA is a tool for studying the influence of one or more qualitative variables on the mean of a numerical variable in a population. In ANOVA the response
psyc3010 lecture 2 factorial between-ps ANOVA I: omnibus tests
 psyc3010 lecture 2 factorial between-ps ANOVA I: omnibus tests last lecture: introduction to factorial designs next lecture: factorial between-ps ANOVA II: (effect sizes and follow-up tests) 1 general
Multiple t Tests. Introduction to Analysis of Variance. Experiments with More than 2 Conditions
 Introduction to Analysis of Variance 1 Experiments with More than 2 Conditions Often the research that psychologists perform has more conditions than just the control and experimental conditions You might
The Chi-Square Distributions
 MATH 03 The Chi-Square Distributions Dr. Neal, Spring 009 The chi-square distributions can be used in statistics to analyze the standard deviation of a normally distributed measurement and to test the
Acknowledge error Smaller samples, less spread
 Hypothesis Testing with t Tests Al Arlo Clark-Foos kf Using Samples to Estimate Population Parameters Acknowledge error Smaller samples, less spread s = Σ ( X M N 1 ) 2 The t Statistic Indicates the distance
The Chi-Square Distributions
 MATH 183 The Chi-Square Distributions Dr. Neal, WKU The chi-square distributions can be used in statistics to analyze the standard deviation σ of a normally distributed measurement and to test the goodness
Using SPSS for One Way Analysis of Variance
 Using SPSS for One Way Analysis of Variance This tutorial will show you how to use SPSS version 12 to perform a one-way, between- subjects analysis of variance and related post-hoc tests. This tutorial
An Analysis of College Algebra Exam Scores December 14, James D Jones Math Section 01
 An Analysis of College Algebra Exam s December, 000 James D Jones Math - Section 0 An Analysis of College Algebra Exam s Introduction Students often complain about a test being too difficult. Are there
Final Exam - Solutions
 Ecn 102 - Analysis of Economic Data University of California - Davis March 19, 2010 Instructor: John Parman Final Exam - Solutions You have until 5:30pm to complete this exam. Please remember to put your
Psychology 282 Lecture #4 Outline Inferences in SLR
 Psychology 282 Lecture #4 Outline Inferences in SLR Assumptions To this point we have not had to make any distributional assumptions. Principle of least squares requires no assumptions. Can use correlations
CHAPTER 10 Comparing Two Populations or Groups
 CHAPTER 10 Comparing Two Populations or Groups 10. Comparing Two Means The Practice of Statistics, 5th Edition Starnes, Tabor, Yates, Moore Bedford Freeman Worth Publishers Comparing Two Means Learning
CHAPTER 10 Comparing Two Populations or Groups
 CHAPTER 10 Comparing Two Populations or Groups 10.2 Comparing Two Means The Practice of Statistics, 5th Edition Starnes, Tabor, Yates, Moore Bedford Freeman Worth Publishers Comparing Two Means Learning
COMPARING SEVERAL MEANS: ANOVA
 LAST UPDATED: November 15, 2012 COMPARING SEVERAL MEANS: ANOVA Objectives 2 Basic principles of ANOVA Equations underlying one-way ANOVA Doing a one-way ANOVA in R Following up an ANOVA: Planned contrasts/comparisons
7.2 One-Sample Correlation ( = a) Introduction. Correlation analysis measures the strength and direction of association between
 Introduction. Correlation analysis measures the strength and direction of association between") 7.2 One-Sample Correlation ( = a) Introduction Correlation analysis measures the strength and direction of association between variables. In this chapter we will test whether the population correlation
7.2 One-Sample Correlation ( = a) Introduction Correlation analysis measures the strength and direction of association between variables. In this chapter we will test whether the population correlation
" M A #M B. Standard deviation of the population (Greek lowercase letter sigma) σ 2
 σ 2") Notation and Equations for Final Exam Symbol Definition X The variable we measure in a scientific study n The size of the sample N The size of the population M The mean of the sample µ The mean of the
Notation and Equations for Final Exam Symbol Definition X The variable we measure in a scientific study n The size of the sample N The size of the population M The mean of the sample µ The mean of the
Review: General Approach to Hypothesis Testing. 1. Define the research question and formulate the appropriate null and alternative hypotheses.
 1 Review: Let X 1, X,..., X n denote n independent random variables sampled from some distribution might not be normal!) with mean µ) and standard deviation σ). Then X µ σ n In other words, X is approximately
y = a + bx 12.1: Inference for Linear Regression Review: General Form of Linear Regression Equation Review: Interpreting Computer Regression Output
 12.1: Inference for Linear Regression Review: General Form of Linear Regression Equation y = a + bx y = dependent variable a = intercept b = slope x = independent variable Section 12.1 Inference for Linear
One sided tests. An example of a two sided alternative is what we ve been using for our two sample tests:
 One sided tests So far all of our tests have been two sided. While this may be a bit easier to understand, this is often not the best way to do a hypothesis test. One simple thing that we can do to get
+ Specify 1 tail / 2 tail
 Week 2: Null hypothesis Aeroplane seat designer wonders how wide to make the plane seats. He assumes population average hip size μ = 43.2cm Sample size n = 50 Question : Is the assumption μ = 43.2cm reasonable?
Advanced Experimental Design
 Advanced Experimental Design Topic Four Hypothesis testing (z and t tests) & Power Agenda Hypothesis testing Sampling distributions/central limit theorem z test (σ known) One sample z & Confidence intervals
In a one-way ANOVA, the total sums of squares among observations is partitioned into two components: Sums of squares represent:
 Activity #10: AxS ANOVA (Repeated subjects design) Resources: optimism.sav So far in MATH 300 and 301, we have studied the following hypothesis testing procedures: 1) Binomial test, sign-test, Fisher s
Simple Linear Regression: One Quantitative IV
 Simple Linear Regression: One Quantitative IV Linear regression is frequently used to explain variation observed in a dependent variable (DV) with theoretically linked independent variables (IV). For example,
Ordinary Least Squares Regression Explained: Vartanian
 Ordinary Least Squares Regression Explained: Vartanian When to Use Ordinary Least Squares Regression Analysis A. Variable types. When you have an interval/ratio scale dependent variable.. When your independent
EXAM 3 Math 1342 Elementary Statistics 6-7
 EXAM 3 Math 1342 Elementary Statistics 6-7 Name Date ********************************************************************************************************************************************** MULTIPLE
Business Analytics and Data Mining Modeling Using R Prof. Gaurav Dixit Department of Management Studies Indian Institute of Technology, Roorkee
 Business Analytics and Data Mining Modeling Using R Prof. Gaurav Dixit Department of Management Studies Indian Institute of Technology, Roorkee Lecture - 04 Basic Statistics Part-1 (Refer Slide Time: 00:33)
Hypothesis testing I. - In particular, we are talking about statistical hypotheses. [get everyone s finger length!] n =
![Hypothesis testing I. - In particular, we are talking about statistical hypotheses. [get everyone s finger length!] n =](/thumbs/86/94764601.jpg "Hypothesis testing I. - In particular, we are talking about statistical hypotheses. [get everyone s finger length!] n =") Hypothesis testing I I. What is hypothesis testing? [Note we re temporarily bouncing around in the book a lot! Things will settle down again in a week or so] - Exactly what it says. We develop a hypothesis,
Hypothesis testing I I. What is hypothesis testing? [Note we re temporarily bouncing around in the book a lot! Things will settle down again in a week or so] - Exactly what it says. We develop a hypothesis,
STA Module 10 Comparing Two Proportions
 STA 2023 Module 10 Comparing Two Proportions Learning Objectives Upon completing this module, you should be able to: 1. Perform large-sample inferences (hypothesis test and confidence intervals) to compare
T-TEST FOR HYPOTHESIS ABOUT
 T-TEST FOR HYPOTHESIS ABOUT Previously we tested the hypothesis that a sample comes from a population with a specified using the normal distribution and a z-test. But the z-test required the population
Review 6. n 1 = 85 n 2 = 75 x 1 = x 2 = s 1 = 38.7 s 2 = 39.2
 Review 6 Use the traditional method to test the given hypothesis. Assume that the samples are independent and that they have been randomly selected ) A researcher finds that of,000 people who said that
Lecture 18: Analysis of variance: ANOVA
 Lecture 18: Announcements: Exam has been graded. See website for results. Lecture 18: Announcements: Exam has been graded. See website for results. Reading: Vasilj pp. 83-97. Lecture 18: Announcements:
Comparing Means from Two-Sample
 Comparing Means from Two-Sample Kwonsang Lee University of Pennsylvania kwonlee@wharton.upenn.edu April 3, 2015 Kwonsang Lee STAT111 April 3, 2015 1 / 22 Inference from One-Sample We have two options to
M(t) = 1 t. (1 t), 6 M (0) = 20 P (95. X i 110) i=1
 = 1 t. (1 t), 6 M (0) = 20 P (95. X i 110) i=1") Math 66/566 - Midterm Solutions NOTE: These solutions are for both the 66 and 566 exam. The problems are the same until questions and 5. 1. The moment generating function of a random variable X is M(t)
Math 66/566 - Midterm Solutions NOTE: These solutions are for both the 66 and 566 exam. The problems are the same until questions and 5. 1. The moment generating function of a random variable X is M(t)