COSC 341 Human Computer Interaction. Dr. Bowen Hui University of British Columbia Okanagan
|
|
|
- Earl Stafford
- 5 years ago
- Views:
Transcription
1 COSC 341 Human Computer Interaction Dr. Bowen Hui University of British Columbia Okanagan 1
2 Last Topic Distribution of means When it is needed How to build one (from scratch) Determining the characteristics of one Z- test Revised hypothesis testing procedure with: Sample of 1+ individuals A distribution of means as comparison distribution Revised formula: Z = (M μ M )/σ M 2
3 This Topic Build on existing concepts Hypothesis testing procedure Distribution of means What s new: Estimate variance/standard deviation t distribution T- test For one sample For dependent means (two samples) 3
4 Scenario: Reported Studies with Mean Course union study found on average, students in COSC spend 2.5 hours studying for their midterms But you think students in this class study more. You randomly pick 16 students from the class and found they studied on average 3.2 hours Can you conclude students in this class are statistically significantly more studious than the average COSC student? 4
5 What s Different? We don t have a known population anymore! For Z- test, we used to: Compare mean of one sample to a population with known mean and known variance What to do now? Comparison of mean of one sample to a population with known mean and unknown variance Solution: Estimate variance using t- test 5
6 What s Different? We don t have a known population anymore! For Z- test, we used to: Compare mean of one sample to a population with known mean and known variance What to do now? Comparison of mean of one sample to a population with known mean and unknown variance Solution: Estimate variance and test using t- test 6
7 1. Setting up Hypotheses Population 1: The kind of students who study COSC 341. Population 2: The kind of students who study COSC generally. H R : Population 1 students study more than Population 2 students. H 0 : Population 1 students study the same amount or less than Population 2 students. 7
8 2. Characteristics of the Comparison Distribution Given, about test sample: N = individual data points X 1, X 2,, X 16 M = 3.2 Given, about population 2: μ = 2.5 σ 2 = need to estimate! Call this estimate S 2 8
9 Computing S 2 Recall: Your sample is a random sample from population Variance of sample ought to reflect variance of population Variance of your sample provides an informed guess about variance of the population However, variance of sample will generally be slightly smaller than variance of its population Creating a biased estimate of population variance Consistently underestimates actual population variance Solution: Create an unbiased estimate of population variance 9
10 Computing S 2 Recall: Your sample is a random sample from population Variance of sample ought to reflect variance of population Variance of your sample provides an informed guess about variance of the population However, variance of sample will generally be slightly smaller than variance of its population Creating a biased estimate of population variance Consistently underestimates actual population variance Solution: Create an unbiased estimate of population variance 10
11 Computing S 2 An unbiased estimate of population variance: S 2 = Σ(X i M) 2 / (N 1) i where: Σ(X i M) 2 = sum of squared deviation scores i N = number of scores N 1 = degrees of freedom (df) Estimated population standard deviation: S = S 2 11
12 2. Characteristics of the Comparison Distribution Given, about test sample: N = 16 M = 3.2 Σ(X i M) 2 = 9.6 (given for simplicity) i Given, about population 2: μ = 2.5 S 2 = Σ(X i M) 2 / (N 1) = 9.6/16 1 = 0.64 i Use your sample data to estimate variance of underlying population 12
13 2. Characteristics of the Comparison Distribution Given, about test sample: N = 16 M = 3.2 Σ(X i M) 2 = 9.6 (given for simplicity) i Given, about population 2: μ = 2.5 S 2 = Σ(X i M) 2 / (N 1) = 9.6/16 1 = 0.64 i Comparison distribution: μ M = μ = 2.5 S 2 M = S 2 / N = 0.64 / 16 = 0.04 same calculation as in z- test, but we use estimates instead of actual population variance 13
14 2. Characteristics of the Comparison Distribution Comparison distribution: μ M = 2.5 S 2 M = 0.04, so S M = 0.20 Shape: t distribution To account for more extreme means 14 fatter tails: need more extreme sample mean to achieve stat. sig.

15 Family of t distributions As a function of df Note: infinite sample size - > t distribution = normal distribution Image taken from statistics.com 15

16 3. Cutoff Sample Score on Comparison Distribution Use 5% or 1%? Is this a one- tailed or two- tailed test? Cutoff t score is Cutoff Z score for df = 15 is? 16
17 4. Determine Sample Score on Comparison Distribution M = 3.5 (test sample s mean from 16 people) Compute t score for μ = 2.5 t = (M μ)/s M = ( )/0.20 = 0.70/0.20 = 3.50 Recall: Z = (M μ M )/σ M 17
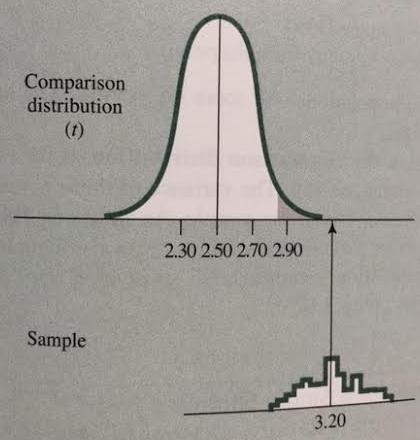
18 18
19 5. Decide to Reject H 0 or Not Is data s t score more extreme than cutoff? Yes: 3.50 > Thus, result of the one sample t test is statistically significance at p < 0.05 level Interpretation: Students in COSC 341 study more for an exam than the average COSC student 19
20 Comparing Two Techniques For each interface from A1 and A2: Interface A and Interface B (your conditions) 8 participants carry out a set of tasks using Interface A then carry out similar tasks using Interface B The same person now has 2 data points Two sets of data Compare the data across the two conditions How to do hypothesis testing? 20
21 What s Different? We don t have a known population at all! For t- test for one sample, we used to: Compare mean of one sample to a population with known mean and unknown variance What to do now? Change two sample scores to one sample scores Comparison of mean of that sample to a population with a mean of zero Solution: Compute difference scores and test using t- test for dependent means 21
22 t Test for Dependent Means t test for dependent means Procedure used when each person in sample is measured twice Also called repeated measures design, within subjects design Example scenarios: Measure change in participant scores before and after treatment Measure difference in participant scores for software 1 and software 2 22
23 Difference Scores and the Comparison Distribution Given two sets of scores: Subtract one score from the other for each person to create a single set of difference scores Mean of population of difference scores is unknown Recall: H 0 indicates no difference between two groups Mean of population of difference scores is 0 Thus, you compare: population of difference scores of your sample to population of difference scores with a mean of 0 23
24 Worked out Example Scenario: Does premarital counseling impact communication quality of husbands before and after marriage One study with 19 husbands in premarital counseling group Scores on next slide 24
25 ß Focus on these columns first On average, these 19 husbands communication quality changed by 229/19 = points Is this decrease statistically significant? 25
26 1. Setting up Hypotheses Population 1: Husbands who receive premarital counseling. Population 2: Husbands whose communication quality does not change from before to after marriage. H R : Population 1 s mean difference score is different from Population 2 s mean difference score. H 0 : There is no difference between the two mean difference scores. 26
27 1. Setting up Hypotheses Population 1: Husbands who receive premarital counseling. Population 2: Husbands whose communication quality does not change from before to after marriage. H R : Population 1 s mean difference score is different from Population 2 s mean difference score. H 0 : There is no difference between the two mean difference scores. 27
28 1. Setting up Hypotheses Population 1: Husbands who receive premarital counseling. Population 2: Husbands whose communication quality does not change from before to after marriage. Note if H R is correct, then Population 2 doesn t exist! H R : Population 1 s mean difference score is different from Population 2 s mean difference score. H 0 : There is no difference between the two mean difference scores. 28
29 2. Characteristics of the Comparison Distribution Given, about test sample: N = 19 M = Given, about population 2: μ = 0 (by definition, with no difference) S 2 = Σ( X M) 2 / (N 1) = see data on next slide 29
")
30 ß same as ( X M) 2 ß same as Σ( X M) 2
31 2. Characteristics of the Comparison Distribution Given, about test sample: N = 19 M = 299 / 19 = Given, about population 2: μ = 0 (by definition, with no difference) S 2 = Σ( X M) 2 / (N 1) = 2, / (19 1) =
32 2. Characteristics of the Comparison Distribution Given, about test sample: N = 19 M = Given, about population 2: μ = 0 (by definition, with no difference) S 2 = Distribution of means: μ M = μ = 0 S 2 M = S 2 /N = / 19 = 8.11 S M = S 2 M = 8.11 =
33 3. Cutoff Sample Score on Comparison Distribution Use 5% or 1%? Not sensitive data so 5% Is this a one- tailed or two- tailed test? H R : Population 1 s mean difference score is different from Population 2 s mean difference score. So two- tailed What is df? Since df = N 1 then df = 18 Cutoff is? 33

34 ß this row 34
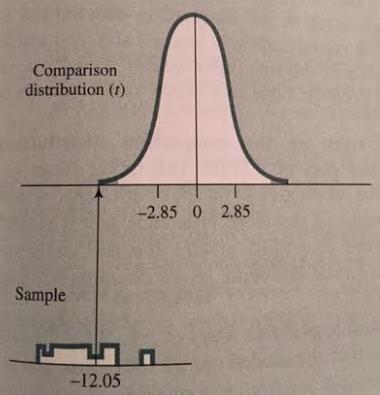
35 3. Cutoff Sample Score on Comparison Distribution Use 5% or 1%? Not sensitive data so 5% Is this a one- tailed or two- tailed test? H R : Population 1 s mean difference score is different from Population 2 s mean difference score. So two- tailed What is df? Since df = N 1 then df = 18 Cutoff is ±
36 We had: 4. Determine Sample Score on Comparison Distribution M = (test sample s mean from 19 people) μ = 0 S M = 2.85 t = (M μ)/s M = ( )/2.85 =
37 37
38 5. Decide to Reject H 0 or Not Is data s t score more extreme than cutoff? Yes: 4.23 < Thus, result of the t test for dependent means is statistically significance at p < 0.05 level Interpretation: Husbands communication quality is different after marriage from what it was before marriage (it is lower) 38
39 Summary One sample t- test Unbiased estimate of population variance t distribution, parameterized by df Look up cutoff Calculate t score Two sample t- test for dependent means Formulate hypothesis Calculate difference scores Apply the above steps Many more statistical analyses in real world 39
40 Exam Expectations Given scenario Identify relevant populations and state the hypotheses Identify which hypothesis testing procedure should be used and why Given scenario and pre- calculated results Indicate whether to reject H 0 Provide the interpretation of the study 40
COSC 341 Human Computer Interaction. Dr. Bowen Hui University of British Columbia Okanagan
 COSC 341 Human Computer Interaction Dr. Bowen Hui University of British Columbia Okanagan 1 Last Class Introduced hypothesis testing Core logic behind it Determining results significance in scenario when:
The t-test: A z-score for a sample mean tells us where in the distribution the particular mean lies
 The t-test: So Far: Sampling distribution benefit is that even if the original population is not normal, a sampling distribution based on this population will be normal (for sample size > 30). Benefit
Questions 3.83, 6.11, 6.12, 6.17, 6.25, 6.29, 6.33, 6.35, 6.50, 6.51, 6.53, 6.55, 6.59, 6.60, 6.65, 6.69, 6.70, 6.77, 6.79, 6.89, 6.
 Chapter 7 Reading 7.1, 7.2 Questions 3.83, 6.11, 6.12, 6.17, 6.25, 6.29, 6.33, 6.35, 6.50, 6.51, 6.53, 6.55, 6.59, 6.60, 6.65, 6.69, 6.70, 6.77, 6.79, 6.89, 6.112 Introduction In Chapter 5 and 6, we emphasized
Sampling Distributions: Central Limit Theorem
 Review for Exam 2 Sampling Distributions: Central Limit Theorem Conceptually, we can break up the theorem into three parts: 1. The mean (µ M ) of a population of sample means (M) is equal to the mean (µ)
Independent Samples ANOVA
 Independent Samples ANOVA In this example students were randomly assigned to one of three mnemonics (techniques for improving memory) rehearsal (the control group; simply repeat the words), visual imagery
The t-statistic. Student s t Test
 The t-statistic 1 Student s t Test When the population standard deviation is not known, you cannot use a z score hypothesis test Use Student s t test instead Student s t, or t test is, conceptually, very
Student s t-distribution. The t-distribution, t-tests, & Measures of Effect Size
 Student s t-distribution The t-distribution, t-tests, & Measures of Effect Size Sampling Distributions Redux Chapter 7 opens with a return to the concept of sampling distributions from chapter 4 Sampling
10/31/2012. One-Way ANOVA F-test
 PSY 511: Advanced Statistics for Psychological and Behavioral Research 1 1. Situation/hypotheses 2. Test statistic 3.Distribution 4. Assumptions One-Way ANOVA F-test One factor J>2 independent samples
Hypothesis testing: Steps
 Review for Exam 2 Hypothesis testing: Steps Exam 2 Review 1. Determine appropriate test and hypotheses 2. Use distribution table to find critical statistic value(s) representing rejection region 3. Compute
Chapter 9 Inferences from Two Samples
 Chapter 9 Inferences from Two Samples 9-1 Review and Preview 9-2 Two Proportions 9-3 Two Means: Independent Samples 9-4 Two Dependent Samples (Matched Pairs) 9-5 Two Variances or Standard Deviations Review
Two-Sample Inferential Statistics
 The t Test for Two Independent Samples 1 Two-Sample Inferential Statistics In an experiment there are two or more conditions One condition is often called the control condition in which the treatment is
7.2 One-Sample Correlation ( = a) Introduction. Correlation analysis measures the strength and direction of association between
 Introduction. Correlation analysis measures the strength and direction of association between") 7.2 One-Sample Correlation ( = a) Introduction Correlation analysis measures the strength and direction of association between variables. In this chapter we will test whether the population correlation
7.2 One-Sample Correlation ( = a) Introduction Correlation analysis measures the strength and direction of association between variables. In this chapter we will test whether the population correlation
Harvard University. Rigorous Research in Engineering Education
 Statistical Inference Kari Lock Harvard University Department of Statistics Rigorous Research in Engineering Education 12/3/09 Statistical Inference You have a sample and want to use the data collected
M(t) = 1 t. (1 t), 6 M (0) = 20 P (95. X i 110) i=1
 = 1 t. (1 t), 6 M (0) = 20 P (95. X i 110) i=1") Math 66/566 - Midterm Solutions NOTE: These solutions are for both the 66 and 566 exam. The problems are the same until questions and 5. 1. The moment generating function of a random variable X is M(t)
Math 66/566 - Midterm Solutions NOTE: These solutions are for both the 66 and 566 exam. The problems are the same until questions and 5. 1. The moment generating function of a random variable X is M(t)
Introduction to Business Statistics QM 220 Chapter 12
 Department of Quantitative Methods & Information Systems Introduction to Business Statistics QM 220 Chapter 12 Dr. Mohammad Zainal 12.1 The F distribution We already covered this topic in Ch. 10 QM-220,
CIVL /8904 T R A F F I C F L O W T H E O R Y L E C T U R E - 8
 CIVL - 7904/8904 T R A F F I C F L O W T H E O R Y L E C T U R E - 8 Chi-square Test How to determine the interval from a continuous distribution I = Range 1 + 3.322(logN) I-> Range of the class interval
HYPOTHESIS TESTING. Hypothesis Testing
 MBA 605 Business Analytics Don Conant, PhD. HYPOTHESIS TESTING Hypothesis testing involves making inferences about the nature of the population on the basis of observations of a sample drawn from the population.
Objectives Simple linear regression. Statistical model for linear regression. Estimating the regression parameters
 Objectives 10.1 Simple linear regression Statistical model for linear regression Estimating the regression parameters Confidence interval for regression parameters Significance test for the slope Confidence
Hypothesis testing: Steps
 Review for Exam 2 Hypothesis testing: Steps Repeated-Measures ANOVA 1. Determine appropriate test and hypotheses 2. Use distribution table to find critical statistic value(s) representing rejection region
10/4/2013. Hypothesis Testing & z-test. Hypothesis Testing. Hypothesis Testing
 & z-test Lecture Set 11 We have a coin and are trying to determine if it is biased or unbiased What should we assume? Why? Flip coin n = 100 times E(Heads) = 50 Why? Assume we count 53 Heads... What could
Sampling Distributions
 Sampling Error As you may remember from the first lecture, samples provide incomplete information about the population In particular, a statistic (e.g., M, s) computed on any particular sample drawn from
Quantitative Analysis and Empirical Methods
 Hypothesis testing Sciences Po, Paris, CEE / LIEPP Introduction Hypotheses Procedure of hypothesis testing Two-tailed and one-tailed tests Statistical tests with categorical variables A hypothesis A testable
Testing a Claim about the Difference in 2 Population Means Independent Samples. (there is no difference in Population Means µ 1 µ 2 = 0) against
 against") Section 9 2A Lecture Testing a Claim about the Difference i Population Means Independent Samples Test H 0 : µ 1 = µ 2 (there is no difference in Population Means µ 1 µ 2 = 0) against H 1 : µ 1 > µ 2 or
Section 9 2A Lecture Testing a Claim about the Difference i Population Means Independent Samples Test H 0 : µ 1 = µ 2 (there is no difference in Population Means µ 1 µ 2 = 0) against H 1 : µ 1 > µ 2 or
The goodness-of-fit test Having discussed how to make comparisons between two proportions, we now consider comparisons of multiple proportions.
 The goodness-of-fit test Having discussed how to make comparisons between two proportions, we now consider comparisons of multiple proportions. A common problem of this type is concerned with determining
Comparing Means from Two-Sample
 Comparing Means from Two-Sample Kwonsang Lee University of Pennsylvania kwonlee@wharton.upenn.edu April 3, 2015 Kwonsang Lee STAT111 April 3, 2015 1 / 22 Inference from One-Sample We have two options to
Difference in two or more average scores in different groups
 ANOVAs Analysis of Variance (ANOVA) Difference in two or more average scores in different groups Each participant tested once Same outcome tested in each group Simplest is one-way ANOVA (one variable as
Stats Review Chapter 14. Mary Stangler Center for Academic Success Revised 8/16
 Stats Review Chapter 14 Revised 8/16 Note: This review is meant to highlight basic concepts from the course. It does not cover all concepts presented by your instructor. Refer back to your notes, unit
Mock Exam - 2 hours - use of basic (non-programmable) calculator is allowed - all exercises carry the same marks - exam is strictly individual
 calculator is allowed - all exercises carry the same marks - exam is strictly individual") Mock Exam - 2 hours - use of basic (non-programmable) calculator is allowed - all exercises carry the same marks - exam is strictly individual Question 1. Suppose you want to estimate the percentage of
Mock Exam - 2 hours - use of basic (non-programmable) calculator is allowed - all exercises carry the same marks - exam is strictly individual Question 1. Suppose you want to estimate the percentage of
Lab #12: Exam 3 Review Key
 Psychological Statistics Practice Lab#1 Dr. M. Plonsky Page 1 of 7 Lab #1: Exam 3 Review Key 1) a. Probability - Refers to the likelihood that an event will occur. Ranges from 0 to 1. b. Sampling Distribution
Relating Graph to Matlab
 There are two related course documents on the web Probability and Statistics Review -should be read by people without statistics background and it is helpful as a review for those with prior statistics
Chapter 12 - Lecture 2 Inferences about regression coefficient
 Chapter 12 - Lecture 2 Inferences about regression coefficient April 19th, 2010 Facts about slope Test Statistic Confidence interval Hypothesis testing Test using ANOVA Table Facts about slope In previous
8/23/2018. One-Way ANOVA F-test. 1. Situation/hypotheses. 2. Test statistic. 3.Distribution. 4. Assumptions
 PSY 5101: Advanced Statistics for Psychological and Behavioral Research 1 1. Situation/hypotheses 2. Test statistic One-Way ANOVA F-test One factor J>2 independent samples H o :µ 1 µ 2 µ J F 3.Distribution
Single Sample Means. SOCY601 Alan Neustadtl
 Single Sample Means SOCY601 Alan Neustadtl The Central Limit Theorem If we have a population measured by a variable with a mean µ and a standard deviation σ, and if all possible random samples of size
COGS 14B: INTRODUCTION TO STATISTICAL ANALYSIS
 COGS 14B: INTRODUCTION TO STATISTICAL ANALYSIS TA: Sai Chowdary Gullapally scgullap@eng.ucsd.edu Office Hours: Thursday (Mandeville) 3:30PM - 4:30PM (or by appointment) Slides: I am using the amazing slides
Factorial Independent Samples ANOVA
 Factorial Independent Samples ANOVA Liljenquist, Zhong and Galinsky (2010) found that people were more charitable when they were in a clean smelling room than in a neutral smelling room. Based on that
Section 9.4. Notation. Requirements. Definition. Inferences About Two Means (Matched Pairs) Examples
 Examples") Objective Section 9.4 Inferences About Two Means (Matched Pairs) Compare of two matched-paired means using two samples from each population. Hypothesis Tests and Confidence Intervals of two dependent means
Objective Section 9.4 Inferences About Two Means (Matched Pairs) Compare of two matched-paired means using two samples from each population. Hypothesis Tests and Confidence Intervals of two dependent means
Statistics Introductory Correlation
 Statistics Introductory Correlation Session 10 oscardavid.barrerarodriguez@sciencespo.fr April 9, 2018 Outline 1 Statistics are not used only to describe central tendency and variability for a single variable.
Chapter 23: Inferences About Means
 Chapter 3: Inferences About Means Sample of Means: number of observations in one sample the population mean (theoretical mean) sample mean (observed mean) is the theoretical standard deviation of the population
CBA4 is live in practice mode this week exam mode from Saturday!
 Announcements CBA4 is live in practice mode this week exam mode from Saturday! Material covered: Confidence intervals (both cases) 1 sample hypothesis tests (both cases) Hypothesis tests for 2 means as
Multiple t Tests. Introduction to Analysis of Variance. Experiments with More than 2 Conditions
 Introduction to Analysis of Variance 1 Experiments with More than 2 Conditions Often the research that psychologists perform has more conditions than just the control and experimental conditions You might
16.3 One-Way ANOVA: The Procedure
 16.3 One-Way ANOVA: The Procedure Tom Lewis Fall Term 2009 Tom Lewis () 16.3 One-Way ANOVA: The Procedure Fall Term 2009 1 / 10 Outline 1 The background 2 Computing formulas 3 The ANOVA Identity 4 Tom
Two sided, two sample t-tests. a) IQ = 100 b) Average height for men = c) Average number of white blood cells per cubic millimeter is 7,000.
 IQ = 100 b) Average height for men = c) Average number of white blood cells per cubic millimeter is 7,000.") Two sided, two sample t-tests. I. Brief review: 1) We are interested in how a sample compares to some pre-conceived notion. For example: a) IQ = 100 b) Average height for men = 5 10. c) Average number
Two sided, two sample t-tests. I. Brief review: 1) We are interested in how a sample compares to some pre-conceived notion. For example: a) IQ = 100 b) Average height for men = 5 10. c) Average number
AMS 7 Correlation and Regression Lecture 8
 AMS 7 Correlation and Regression Lecture 8 Department of Applied Mathematics and Statistics, University of California, Santa Cruz Suumer 2014 1 / 18 Correlation pairs of continuous observations. Correlation
Statistical Inference: Estimation and Confidence Intervals Hypothesis Testing
 Statistical Inference: Estimation and Confidence Intervals Hypothesis Testing 1 In most statistics problems, we assume that the data have been generated from some unknown probability distribution. We desire
AMS7: WEEK 7. CLASS 1. More on Hypothesis Testing Monday May 11th, 2015
 AMS7: WEEK 7. CLASS 1 More on Hypothesis Testing Monday May 11th, 2015 Testing a Claim about a Standard Deviation or a Variance We want to test claims about or 2 Example: Newborn babies from mothers taking
Basic Linear Model. Chapters 4 and 4: Part II. Basic Linear Model
 Basic Linear Model Chapters 4 and 4: Part II Statistical Properties of Least Square Estimates Y i = α+βx i + ε I Want to chooses estimates for α and β that best fit the data Objective minimize the sum
An inferential procedure to use sample data to understand a population Procedures
 Hypothesis Test An inferential procedure to use sample data to understand a population Procedures Hypotheses, the alpha value, the critical region (z-scores), statistics, conclusion Two types of errors
STAT Chapter 9: Two-Sample Problems. Paired Differences (Section 9.3)
") STAT 515 -- Chapter 9: Two-Sample Problems Paired Differences (Section 9.3) Examples of Paired Differences studies: Similar subjects are paired off and one of two treatments is given to each subject in
STAT 515 -- Chapter 9: Two-Sample Problems Paired Differences (Section 9.3) Examples of Paired Differences studies: Similar subjects are paired off and one of two treatments is given to each subject in
Correlation and Regression
 Correlation and Regression October 25, 2017 STAT 151 Class 9 Slide 1 Outline of Topics 1 Associations 2 Scatter plot 3 Correlation 4 Regression 5 Testing and estimation 6 Goodness-of-fit STAT 151 Class
ONE FACTOR COMPLETELY RANDOMIZED ANOVA
 MALLOY PSYCH 3000 1-ANOVA PAGE 1 ONE FACTOR COMPLETELY RANDOMIZED ANOVA Sampling Distribution of F F is a test statistic [ ][ ][ ][ ] Test Statistic: F = MALLOY PSYCH 3000 1-ANOVA PAGE 2 ONE WAY ANOVA
Rama Nada. -Ensherah Mokheemer. 1 P a g e
 - 9 - Rama Nada -Ensherah Mokheemer - 1 P a g e Quick revision: Remember from the last lecture that chi square is an example of nonparametric test, other examples include Kruskal Wallis, Mann Whitney and
POLI 443 Applied Political Research
 POLI 443 Applied Political Research Session 4 Tests of Hypotheses The Normal Curve Lecturer: Prof. A. Essuman-Johnson, Dept. of Political Science Contact Information: aessuman-johnson@ug.edu.gh College
The Chi-Square Distributions
 MATH 03 The Chi-Square Distributions Dr. Neal, Spring 009 The chi-square distributions can be used in statistics to analyze the standard deviation of a normally distributed measurement and to test the
Slides for Data Mining by I. H. Witten and E. Frank
 Slides for Data Mining by I. H. Witten and E. Frank Predicting performance Assume the estimated error rate is 5%. How close is this to the true error rate? Depends on the amount of test data Prediction
An Analysis of College Algebra Exam Scores December 14, James D Jones Math Section 01
 An Analysis of College Algebra Exam s December, 000 James D Jones Math - Section 0 An Analysis of College Algebra Exam s Introduction Students often complain about a test being too difficult. Are there
6.4 Type I and Type II Errors
 6.4 Type I and Type II Errors Ulrich Hoensch Friday, March 22, 2013 Null and Alternative Hypothesis Neyman-Pearson Approach to Statistical Inference: A statistical test (also known as a hypothesis test)
t-test for b Copyright 2000 Tom Malloy. All rights reserved. Regression
 t-test for b Copyright 2000 Tom Malloy. All rights reserved. Regression Recall, back some time ago, we used a descriptive statistic which allowed us to draw the best fit line through a scatter plot. We
Hint: The following equation converts Celsius to Fahrenheit: F = C where C = degrees Celsius F = degrees Fahrenheit
 Amherst College Department of Economics Economics 360 Fall 2014 Exam 1: Solutions 1. (10 points) The following table in reports the summary statistics for high and low temperatures in Key West, FL from
The Chi-Square Distributions
 MATH 183 The Chi-Square Distributions Dr. Neal, WKU The chi-square distributions can be used in statistics to analyze the standard deviation σ of a normally distributed measurement and to test the goodness
Confidence Intervals 1
 Confidence Intervals 1 November 1, 2017 1 HMS, 2017, v1.1 Chapter References Diez: Chapter 4.2 Navidi, Chapter 5.0, 5.1, (Self read, 5.2), 5.3, 5.4, 5.6, not 5.7, 5.8 Chapter References 2 Terminology Point
Soc3811 Second Midterm Exam
 Soc38 Second Midterm Exam SEMI-OPE OTE: One sheet of paper, signed & turned in with exam booklet Bring our Own Pencil with Eraser and a Hand Calculator! Standardized Scores & Probability If we know the
The independent-means t-test:
 The independent-means t-test: Answers the question: is there a "real" difference between the two conditions in my experiment? Or is the difference due to chance? Previous lecture: (a) Dependent-means t-test:
Chapter 22. Comparing Two Proportions 1 /29
 Chapter 22 Comparing Two Proportions 1 /29 Homework p519 2, 4, 12, 13, 15, 17, 18, 19, 24 2 /29 Objective Students test null and alternate hypothesis about two population proportions. 3 /29 Comparing Two
The One-Way Repeated-Measures ANOVA. (For Within-Subjects Designs)
") The One-Way Repeated-Measures ANOVA (For Within-Subjects Designs) Logic of the Repeated-Measures ANOVA The repeated-measures ANOVA extends the analysis of variance to research situations using repeated-measures
The One-Way Repeated-Measures ANOVA (For Within-Subjects Designs) Logic of the Repeated-Measures ANOVA The repeated-measures ANOVA extends the analysis of variance to research situations using repeated-measures
Last week: Sample, population and sampling distributions finished with estimation & confidence intervals
 Past weeks: Measures of central tendency (mean, mode, median) Measures of dispersion (standard deviation, variance, range, etc). Working with the normal curve Last week: Sample, population and sampling
Problem #1 #2 #3 #4 #5 #6 Total Points /6 /8 /14 /10 /8 /10 /56
 STAT 391 - Spring Quarter 2017 - Midterm 1 - April 27, 2017 Name: Student ID Number: Problem #1 #2 #3 #4 #5 #6 Total Points /6 /8 /14 /10 /8 /10 /56 Directions. Read directions carefully and show all your
Multiple Regression Analysis
 Multiple Regression Analysis y = β 0 + β 1 x 1 + β 2 x 2 +... β k x k + u 2. Inference 0 Assumptions of the Classical Linear Model (CLM)! So far, we know: 1. The mean and variance of the OLS estimators
Deciphering Math Notation. Billy Skorupski Associate Professor, School of Education
 Deciphering Math Notation Billy Skorupski Associate Professor, School of Education Agenda General overview of data, variables Greek and Roman characters in math and statistics Parameters vs. Statistics
Difference between means - t-test /25
 Difference between means - t-test 1 Discussion Question p492 Ex 9-4 p492 1-3, 6-8, 12 Assume all variances are not equal. Ignore the test for variance. 2 Students will perform hypothesis tests for two
Chapter 5 Confidence Intervals
 Chapter 5 Confidence Intervals Confidence Intervals about a Population Mean, σ, Known Abbas Motamedi Tennessee Tech University A point estimate: a single number, calculated from a set of data, that is
Unit 27 One-Way Analysis of Variance
 Unit 27 One-Way Analysis of Variance Objectives: To perform the hypothesis test in a one-way analysis of variance for comparing more than two population means Recall that a two sample t test is applied
MATH 10 INTRODUCTORY STATISTICS
 MATH 10 INTRODUCTORY STATISTICS Tommy Khoo Your friendly neighbourhood graduate student. It is Time for Homework! ( ω `) First homework + data will be posted on the website, under the homework tab. And
COMPARING SEVERAL MEANS: ANOVA
 LAST UPDATED: November 15, 2012 COMPARING SEVERAL MEANS: ANOVA Objectives 2 Basic principles of ANOVA Equations underlying one-way ANOVA Doing a one-way ANOVA in R Following up an ANOVA: Planned contrasts/comparisons
STA Module 10 Comparing Two Proportions
 STA 2023 Module 10 Comparing Two Proportions Learning Objectives Upon completing this module, you should be able to: 1. Perform large-sample inferences (hypothesis test and confidence intervals) to compare
Table of z values and probabilities for the standard normal distribution. z is the first column plus the top row. Each cell shows P(X z).
.") Table of z values and probabilities for the standard normal distribution. z is the first column plus the top row. Each cell shows P(X z). For example P(X.04) =.8508. For z < 0 subtract the value from,
Table of z values and probabilities for the standard normal distribution. z is the first column plus the top row. Each cell shows P(X z). For example P(X.04) =.8508. For z < 0 subtract the value from,
Acknowledge error Smaller samples, less spread
 Hypothesis Testing with t Tests Al Arlo Clark-Foos kf Using Samples to Estimate Population Parameters Acknowledge error Smaller samples, less spread s = Σ ( X M N 1 ) 2 The t Statistic Indicates the distance
Chapter 22. Comparing Two Proportions 1 /30
 Chapter 22 Comparing Two Proportions 1 /30 Homework p519 2, 4, 12, 13, 15, 17, 18, 19, 24 2 /30 3 /30 Objective Students test null and alternate hypothesis about two population proportions. 4 /30 Comparing
Topic 3: Sampling Distributions, Confidence Intervals & Hypothesis Testing. Road Map Sampling Distributions, Confidence Intervals & Hypothesis Testing
 Topic 3: Sampling Distributions, Confidence Intervals & Hypothesis Testing ECO22Y5Y: Quantitative Methods in Economics Dr. Nick Zammit University of Toronto Department of Economics Room KN3272 n.zammit
The Simple Linear Regression Model
 The Simple Linear Regression Model Lesson 3 Ryan Safner 1 1 Department of Economics Hood College ECON 480 - Econometrics Fall 2017 Ryan Safner (Hood College) ECON 480 - Lesson 3 Fall 2017 1 / 77 Bivariate
1 Descriptive statistics. 2 Scores and probability distributions. 3 Hypothesis testing and one-sample t-test. 4 More on t-tests
 Overall Overview INFOWO Statistics lecture S3: Hypothesis testing Peter de Waal Department of Information and Computing Sciences Faculty of Science, Universiteit Utrecht 1 Descriptive statistics 2 Scores
Chapter 8. Inferences Based on a Two Samples Confidence Intervals and Tests of Hypothesis
 Chapter 8 Inferences Based on a Two Samples Confidence Intervals and Tests of Hypothesis Copyright 2018, 2014, and 2011 Pearson Education, Inc. Slide - 1 Content 1. Identifying the Target Parameter 2.
Area1 Scaled Score (NAPLEX) .535 ** **.000 N. Sig. (2-tailed)
 .535 ** **.000 N. Sig. (2-tailed)") Institutional Assessment Report Texas Southern University College of Pharmacy and Health Sciences "An Analysis of 2013 NAPLEX, P4-Comp. Exams and P3 courses The following analysis illustrates relationships
Institutional Assessment Report Texas Southern University College of Pharmacy and Health Sciences "An Analysis of 2013 NAPLEX, P4-Comp. Exams and P3 courses The following analysis illustrates relationships
Lecture 14. Analysis of Variance * Correlation and Regression. The McGraw-Hill Companies, Inc., 2000
 Lecture 14 Analysis of Variance * Correlation and Regression Outline Analysis of Variance (ANOVA) 11-1 Introduction 11-2 Scatter Plots 11-3 Correlation 11-4 Regression Outline 11-5 Coefficient of Determination
Lecture 14. Outline. Outline. Analysis of Variance * Correlation and Regression Analysis of Variance (ANOVA)
") Outline Lecture 14 Analysis of Variance * Correlation and Regression Analysis of Variance (ANOVA) 11-1 Introduction 11- Scatter Plots 11-3 Correlation 11-4 Regression Outline 11-5 Coefficient of Determination
Outline Lecture 14 Analysis of Variance * Correlation and Regression Analysis of Variance (ANOVA) 11-1 Introduction 11- Scatter Plots 11-3 Correlation 11-4 Regression Outline 11-5 Coefficient of Determination
Last two weeks: Sample, population and sampling distributions finished with estimation & confidence intervals
 Past weeks: Measures of central tendency (mean, mode, median) Measures of dispersion (standard deviation, variance, range, etc). Working with the normal curve Last two weeks: Sample, population and sampling
Probability and Statistics Notes
 Probability and Statistics Notes Chapter Seven Jesse Crawford Department of Mathematics Tarleton State University Spring 2011 (Tarleton State University) Chapter Seven Notes Spring 2011 1 / 42 Outline
Review. One-way ANOVA, I. What s coming up. Multiple comparisons
 Review One-way ANOVA, I 9.07 /15/00 Earlier in this class, we talked about twosample z- and t-tests for the difference between two conditions of an independent variable Does a trial drug work better than
Chapter 26: Comparing Counts (Chi Square)
") Chapter 6: Comparing Counts (Chi Square) We ve seen that you can turn a qualitative variable into a quantitative one (by counting the number of successes and failures), but that s a compromise it forces
Chapter 6: Comparing Counts (Chi Square) We ve seen that you can turn a qualitative variable into a quantitative one (by counting the number of successes and failures), but that s a compromise it forces
2011 Pearson Education, Inc
 Statistics for Business and Economics Chapter 7 Inferences Based on Two Samples: Confidence Intervals & Tests of Hypotheses Content 1. Identifying the Target Parameter 2. Comparing Two Population Means:
Comparing Several Means: ANOVA
 Comparing Several Means: ANOVA Understand the basic principles of ANOVA Why it is done? What it tells us? Theory of one way independent ANOVA Following up an ANOVA: Planned contrasts/comparisons Choosing
3. (a) (8 points) There is more than one way to correctly express the null hypothesis in matrix form. One way to state the null hypothesis is
 (8 points) There is more than one way to correctly express the null hypothesis in matrix form. One way to state the null hypothesis is") Stat 501 Solutions and Comments on Exam 1 Spring 005-4 0-4 1. (a) (5 points) Y ~ N, -1-4 34 (b) (5 points) X (X,X ) = (5,8) ~ N ( 11.5, 0.9375 ) 3 1 (c) (10 points, for each part) (i), (ii), and (v) are
Stat 501 Solutions and Comments on Exam 1 Spring 005-4 0-4 1. (a) (5 points) Y ~ N, -1-4 34 (b) (5 points) X (X,X ) = (5,8) ~ N ( 11.5, 0.9375 ) 3 1 (c) (10 points, for each part) (i), (ii), and (v) are
Statistical Distribution Assumptions of General Linear Models
 Statistical Distribution Assumptions of General Linear Models Applied Multilevel Models for Cross Sectional Data Lecture 4 ICPSR Summer Workshop University of Colorado Boulder Lecture 4: Statistical Distributions
Let us think of the situation as having a 50 sided fair die; any one number is equally likely to appear.
 Probability_Homework Answers. Let the sample space consist of the integers through. {, 2, 3,, }. Consider the following events from that Sample Space. Event A: {a number is a multiple of 5 5, 0, 5,, }
STAT Chapter 8: Hypothesis Tests
 STAT 515 -- Chapter 8: Hypothesis Tests CIs are possibly the most useful forms of inference because they give a range of reasonable values for a parameter. But sometimes we want to know whether one particular
Name: Exam: In-term Two Page: 1 of 8 Date: 12/07/2018. University of Texas at Austin, Department of Mathematics M358K - Applied Statistics TRUE/FALSE
 Exam: In-term Two Page: 1 of 8 Date: 12/07/2018 Name: TRUE/FALSE 1.1 TRUE FALSE University of Texas at Austin, Department of Mathematics M358K - Applied Statistics MULTIPLE CHOICE 1.2 TRUE FALSE 1.3 TRUE
Analysis of Variance (ANOVA)
") Analysis of Variance (ANOVA) Two types of ANOVA tests: Independent measures and Repeated measures Comparing 2 means: X 1 = 20 t - test X 2 = 30 How can we Compare 3 means?: X 1 = 20 X 2 = 30 X 3 = 35 ANOVA
Analysis of Variance (ANOVA) Two types of ANOVA tests: Independent measures and Repeated measures Comparing 2 means: X 1 = 20 t - test X 2 = 30 How can we Compare 3 means?: X 1 = 20 X 2 = 30 X 3 = 35 ANOVA
Psy 420 Final Exam Fall 06 Ainsworth. Key Name
 Psy 40 Final Exam Fall 06 Ainsworth Key Name Psy 40 Final A researcher is studying the effect of Yoga, Meditation, Anti-Anxiety Drugs and taking Psy 40 and the anxiety levels of the participants. Twenty
EC2001 Econometrics 1 Dr. Jose Olmo Room D309
 EC2001 Econometrics 1 Dr. Jose Olmo Room D309 J.Olmo@City.ac.uk 1 Revision of Statistical Inference 1.1 Sample, observations, population A sample is a number of observations drawn from a population. Population:
Ch. 7. One sample hypothesis tests for µ and σ
 Ch. 7. One sample hypothesis tests for µ and σ Prof. Tesler Math 18 Winter 2019 Prof. Tesler Ch. 7: One sample hypoth. tests for µ, σ Math 18 / Winter 2019 1 / 23 Introduction Data Consider the SAT math
Chapter 7. Inference for Distributions. Introduction to the Practice of STATISTICS SEVENTH. Moore / McCabe / Craig. Lecture Presentation Slides
 Chapter 7 Inference for Distributions Introduction to the Practice of STATISTICS SEVENTH EDITION Moore / McCabe / Craig Lecture Presentation Slides Chapter 7 Inference for Distributions 7.1 Inference for