Last two weeks: Sample, population and sampling distributions finished with estimation & confidence intervals
|
|
|
- Maryann Townsend
- 5 years ago
- Views:
Transcription
.")

1 Past weeks: Measures of central tendency (mean, mode, median) Measures of dispersion (standard deviation, variance, range, etc). Working with the normal curve Last two weeks: Sample, population and sampling distributions finished with estimation & confidence intervals Today: move onto Chapter 7: Hypothesis Testing and the One Sample test.. 8-1
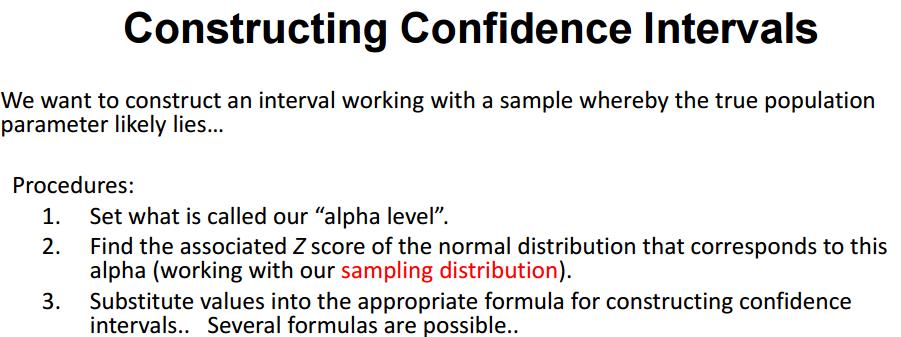
2 Recall with Confidence Intervals, I gave you three formulas that are appropriate when calculating:
3
4 8-4
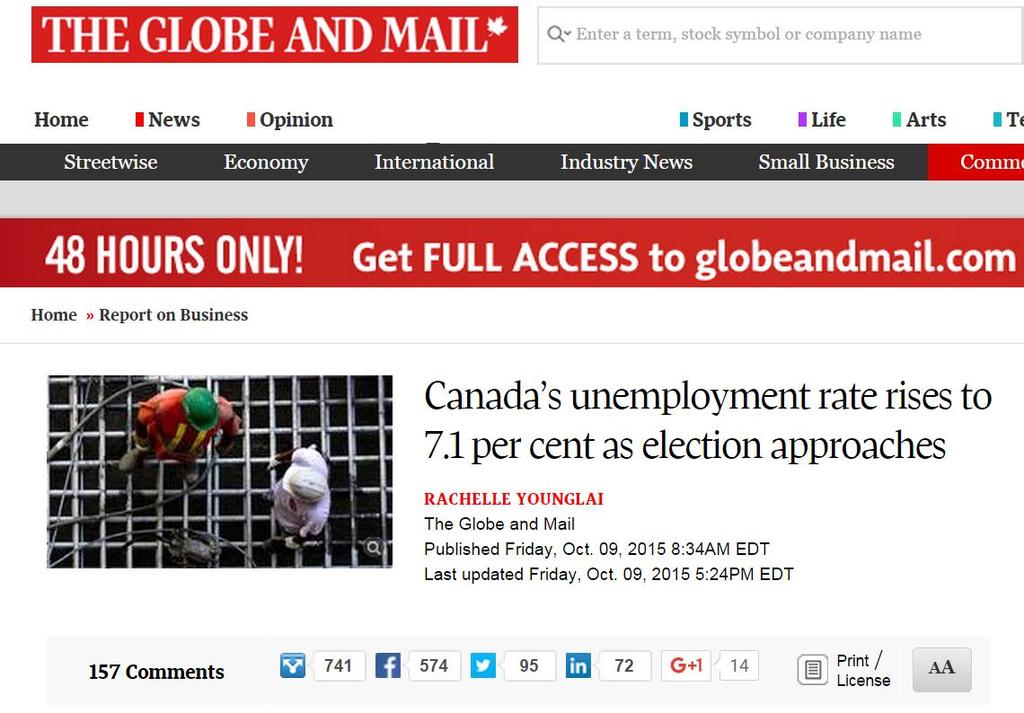
5 A random sample of 100,000 Canadians (this is roughly the size of Canada s Labour Force Survey) estimates that 7.1% of Canada s population is unemployed. Create a 95% CI on this statistic: N=100,000 Ps = Set alpha:.05, we are working with a 95% confidence interval 2. Set your appropriate Z score : Z = 1.96
6 A random sample of 100,000 Canadians (this is roughly the size of Canada s Labour Force Survey) estimates that 7.1% of Canada s population is unemployed. Create a 95% CI on this statistic: N=100,000 Ps = Set alpha:.05, we are working with a 95% confidence interval 2. Set your appropriate Z score : Z = Use appropriate formula: C.I. =.071 +/ C.I. =.071 +/ C.I. =.071 +/ C.I. =.071 +/ ( ) CI: 95% of the time, we anticipate that Canada s unemployment rate falls somewhere between 7.07 and 7.13
 -> calculate a CI Could be asked for a: 95% CI or a 90 % CI or a 99% CI The only difference relates to the Z value used: 1.96 or 1.")
7 In addition to working with proportions (and %s) Might be given a mean, and its sample standard deviation (with sample size) -> calculate a CI Might be given a mean, with its population standard deviation (with sample size) -> calculate a CI Could be asked for a: 95% CI or a 90 % CI or a 99% CI The only difference relates to the Z value used: 1.96 or or 2.575
8 Chapter 7 Hypothesis Testing I: The One-Sample Case Idea: Obtain a statistic for a specific sample,.. Does it differ significantly from a given population parameter? 8-8
9 Eg. We take a sample of university students from a specific college calculate their mean GPA Does this sample differ significantly from all students in Ontario?? 8-9
10 In this presentation you will learn about: The basic logic of hypothesis testing Hypothesis testing for single sample means The Five-Step Model Other material covered: One- vs. Two- tailed tests Student s t distribution Hypothesis testing for single sample proportions Type I vs. Type II error
11 Hypothesis Testing Hypothesis testing is designed to detect significant differences: differences that did not occur by random chance. Is an observed difference real, or is it merely sampling error or random noise in our data?
12 8-12
13 Hypothesis Testing for Single Sample Means: An Example Brock University has been accused of inconsistent grading policies. Why? Grade inflation The rumor is: their majors have much different GPAs than students in general even though the work requirements & apparent motivation appear to be no different from other universities (if not weaker) We have data from Stats Can on all university students, i.e. the full population (but nothing specifically for Brock) We can only draw a sample of Brock students, and we want to do a single sample test, comparing the sample statistic with the population parameter. 8-13
, with a standard deviation of 0.")
14 Suppose we know from Stats Can: The value of the parameter, average GPA for all University students across Ontario, is 2.70 (μ = 2.70), with a standard deviation of 0.70 (σ =.70).
15 Suppose we know from Stats Can: The value of the parameter, average GPA for all University students across Ontario, is 2.70 (μ = 2.70), with a standard deviation of 0.70 (σ =.70). Then we take a random sample of 117 Brock majors, & we document a mean = 3.00 There is a difference between the parameter (2.70) and the statistic (3.00)., but is it real??? Is it a significant difference? The observed difference may have been caused by random chance.
16 Formally, we can state the two hypotheses as: Null Hypothesis (H 0 ) The difference is caused by random chance. Note: The Null Hypothesis always states there is no significant difference. OR Alternative hypothesis (H 1 ) The difference is real. Note: The Alternate hypothesis always contradicts the H
17 In other words: H 0 : The sample mean (3.00 with this specific sample) is the same as the pop. mean (2.70). The difference is merely caused by random chance (sampling error) Note: more likely with small samples, right? H 1 : The difference is real (significant). Brock majors are different from all students. We can test H 0 given our knowledge of the sampling distribution and Z scores 8-17
18 How do we do significance tests? We always begin by assuming the H 0 is true (no real difference). & then ask, What is the probability of getting a sample statistic if in fact H0 is true? In other words, in this case: What is the probability of this sample of Brock students having a mean of 3.00 if in fact all Brock majors in reality have a mean of 2.70 (i.e. no different from the mean of all Canadian students)?
19 How do we determine this probability? We always work with our sampling distribution and use the Z score formula to identify specific statistics on our sampling distribution, NOTE: this formula is equivalent to dividing the difference between the sample statistic and the population parameter by the standard error We can then use Appendix A to determine the probability of getting the observed difference in our sampling distribution. 8-19
20 With our example, The sample mean = 3.00 (GPA for sample of Brock students) With: μ = 2.70; σ=0.70 (population mean & standard deviation) Z = = A mean of 3.0 is fully 4.6 standard errors (Z scores) above our population mean.. We can estimate the probability of scoring this high on this sampling distribution
21 Our sampling distribution Z score (also referred to as Z obtained) In significance tests 4.6
22 The probability of getting Such an outcome is <.0001! <
23 The chances of this sort of outcome (a mean of 3.0 in a sample of Brock students) when in reality their mean is expected to be 2.7 is extremely slim less than.0001 chance Here, we can be safe in rejecting our null hypothesis Accept our H1 research hypothesis.. A significant difference appears to be documented.. Brock students are significantly different!! 8-23
24 Hypothesis Testing: The Five Step Model All the elements used in the example above can be formally organized into a five-step model: 1. Making assumptions and meeting test requirements. 2. Stating the null hypothesis. 3. Selecting the sampling distribution and establishing the critical region. 4. Computing the test statistic. 5. Making a decision and interpreting the results of the test. 8-24
25 Step 1: Make Assumptions and Meet Test Requirements Random sampling Hypothesis testing assumes samples were selected according to EPSEM (equal probability of selection method: random) The sample of 117 was randomly selected from all Brock majors. Level of Measurement is Interval-Ratio GPA is Interval-Ratio so the mean is an appropriate statistic. Sampling Distribution is normal in shape This assumption is satisfied by using a large enough sample (n>100). 8-25
26 Step 2: State the Null Hypothesis H 0 : μ = 2.7 The sample of 117 comes from a population that has a GPA of 2.7. The difference between 2.7 and 3.0 is trivial and caused by random chance. H 1 : μ 2.7 The sample of 117 comes from a population that does not have a GPA of 2.7. The difference between 2.7 and 3.0 reflects an actual difference between Brock majors and other students 8-26
27 Step 3: Select Sampling Distribution and Establish the Critical Region Sampling Distribution= Z 8-27
28 Hypothesis Testing for Single Sample Means By convention, we use the.05 value as a guideline to identify differences that would be rare if H 0 is true. If the probability is less than.05 of obtaining the sample statistic, assuming that the null hypothesis is true, then the calculated or obtained Z score will be beyond ±1.96 Shaded tails here Represent our critical region
29 Step 3: Select Sampling Distribution and Establish the Critical Region Sampling Distribution= Z Alpha (α) =.05 α is the indicator of rare events. Any difference with a probability less than α is rare and will cause us to reject the H 0. Critical Region (C.R) begins at ± 1.96 This is the critical Z score associated with α =.05, two-tailed test. If the obtained Z score falls in the C.R., reject the H
30 Step 4: Compute the Test Statistic & draw the Z distribution With our example, The sample mean = 3.00 (GPA for sample of Brock students) With: μ = 2.70; σ=0.70 (population mean & standard deviation) Z (obtained) = =
31 Step 4: Compute the Test Statistic & draw the Z distribution With our example, The sample mean = 3.00 (GPA for sample of Brock students) With: μ = 2.70; σ=0.70 (population mean & standard deviation) Z (obtained) = = Draw it: Z (critical) Z (critical)
32 Step 5: Make Decision and Interpret Results OR:
33 Step 5: Make Decision and Interpret Results (continued) The obtained Z score fell in the C.R., so we reject the H 0. If the H 0 were true, a sample outcome of 3.00 would be highly unlikely. Therefore, the H 0 is false and must be rejected. Brock majors have a GPA that is significantly different from the general student body. 8-33
 Mean IQ = 95 We know: Population mean is 100, with a standard deviation of 15 on this standard IQ test. Are they significantly different?")
34 Hypothesis Testing for Single Sample Means: Example with one tailed test The rumor is: Toronto Maple leaf fans have a different level of intelligence than other Canadians? Sample: n=101 Maple Leaf Fans (SRS) Mean IQ = 95 We know: Population mean is 100, with a standard deviation of 15 on this standard IQ test. Are they significantly different? 8-34
35 Step 1: Make Assumptions and Meet Test Requirements Random sampling The sample of 101 Maple leaf fans was randomly selected from all Maple leaf fans. Level of Measurement is Interval-Ratio IQ test score is Interval-Ratio so the mean is an appropriate statistic. Sampling Distribution is normal in shape This assumption is satisfied by using a large enough sample (n>100). 8-35
36 Step 2: State the Null Hypothesis H 0 : μ = 100 The sample of 101 comes from a population that has an IQ of 100 (i.e. all Maple Leaf fans). The difference between 95 and 100 is trivial and caused by random chance. H 1 : μ 100 The sample of 101 comes from a population that has an IQ different than 100. The difference between 95 and 100 is real! 8-36
37 Step 3: Select Sampling Distribution and Establish the Critical Region Sampling Distribution= Z Alpha (α) =.05 α is the indicator of rare events. Any difference with a probability less than α is rare and will cause us to reject the H 0. Critical Region (C.R) begins at +/ This is the critical Z score associated with α =.05, two-tailed test. If the obtained Z score falls in the C.R., reject the H
38 Step 4: Compute the Test Statistic & draw So, substituting the values into Formula 7.1, With: μ = 100; σ=15 and N= Z (obtained) = = Draw it: Z (critical) Z (critical)
39 Step 5: Make Decision and Interpret Results OR:
40 Step 5: Make Decision and Interpret Results (continued) The obtained Z score fell in the C.R., so we reject the H 0. If the H 0 were true, a sample outcome of 95 would be highly unlikely. Therefore, the H 0 is false and must be rejected. Toronto Maple Leaf fans are significantly different than other Canadians 8-40
41 Crucial Choices in the Five Step Model Model is fairly rigid, but there are two crucial choices: 1. One-tailed or two-tailed test (Section 7.4) 2. Alpha (α) level (Section 7.5) 8-41
42 One- and Two-Tailed Hypothesis Two-tailed: States that population mean is not equal to value stated in null hypothesis. Example: Tests H 1 : μ 2.7, where means not equal to. Note: the GPA example illustrated above was a two-tailed test, with two critical regions Alternatively: one-tailed tests are possible: Differences in a specific direction. Example: H 1 : μ>2.7, where > signifies greater than 8-42
43 The Curve for Two- vs. One-tailed Tests at α =.05: Two-tailed test: is there a significant difference? One-tailed tests: is the sample mean greater than µ? is the sample mean less than µ?
44 Tails affect Critical Region in Step 3: 8-44
45 Hypothesis Testing for Single Sample Means: Example with one tailed test Previous research has established that immigrants earn less than other Canadians: Sample: n=101 recent immigrants Mean employment earnings = $36,000 We know: Population mean is $40,000, with a standard deviation of $15,000 Are they earning significantly less? 8-45
46 Step 1: Make Assumptions and Meet Test Requirements Random sampling The sample of 101 immigrants was randomly selected from all immigrants. Level of Measurement is Interval-Ratio Earnings is Interval-Ratio so the mean is an appropriate statistic. Sampling Distribution is normal in shape This assumption is satisfied by using a large enough sample (n>100). 8-46
47 Step 2: State the Null Hypothesis H 0 : μ = $40,000 The sample of 101 immigrants comes from a population that has a mean income of $40,000 (i.e. all Canadians). The difference between $36,000 and $40,000 is caused by random chance. H 1 : μ<$40,000 The sample of 101 comes from a population that has a mean income less than $40,000. The difference between $36,000 and $40,000 reflects lower earnings among new Canadians relative to all Canadians. 8-47
48 Step 3: Select Sampling Distribution and Establish the Critical Region Sampling Distribution= Z Alpha (α) =.05 α is the indicator of rare events. Any difference with a probability less than α is rare and will cause us to reject the H 0. Critical Region (C.R) begins at This is the critical Z score associated with α =.05, one-tailed test. If the obtained Z score falls in the C.R., reject the H
49 Step 4: Compute the Test Statistic So, substituting the values into Formula 7.1, With: μ = 40,000; σ=15,000 and N=101 Z (obtained) = =-2.68 Draw it: Z (critical) 8-49
50 Step 5: Make Decision and Interpret Results OR:
51 Step 5: Make Decision and Interpret Results (continued) The obtained Z score fell in the C.R., so we reject the H 0. If the H 0 were true, a sample outcome of $36,000 would be highly unlikely. Therefore, the H 0 is false and must be rejected. New Canadians are earning less than other Canadians 8-51
52 Note: In previous examples, I have used the formula: What if our population standard deviation is unknown? 8-52
53 What if our population standard deviation is unknown? How can we test a hypothesis if σ is not known, as is usually the case? For large samples (N>100), we use s as an estimator of σ and use standard normal distribution (Z scores), suitably corrected for the bias (n is replaced by n-1 to correct for the fact that s is a biased estimator of σ. 8-53
54 What if our sample size is small? Less than 100? The statistician s nightmare.. Really small samples Much more sampling error!!! Harder to document significant differences!!! When the sample size is small (< 100) then the Student s t distribution should be used
55 The test statistic is known as t. The curve of the t distribution is flatter than that of the Z distribution but as the sample size increases, the t-curve starts to resemble the normal curve Normal Curve df =18 df = 50
56 The Student s t distribution A similar formula as for Z (obtained) is used in hypothesis testing: The logic of the five-step model for hypothesis testing is followed. However in testing hypothesis we use the t table (Appendix B), not the Z table (Appendix A). 8-56
57 NOTE: The t table differs from the Z table in the following ways: 8-57
58 1. Column at left for degrees of freedom (df) (df = N 1) i.e. the smaller the sample, the flatter the distribution 1. Alpha levels along top two rows: one- and two-tailed 2. Entries in table are actual scores: t (critical) i.e. they mark beginning of critical region, not areas under the curve 8-58

59 Example A random sample of 30 students at Kings reported drinking on average 8 bottles of beer per week, with a standard deviation of 5. Is this significantly different from the population average (µ = 6 bottles)?
60 Solution (using five step model) Step 1: Make Assumptions and Meet Test Requirements: Random sample Level of measurement is interval-ratio The sample is small (<100), so we can t work with a normal distribution
61 Solution (cont.) Step 2: State the null and alternate hypotheses. H 0 : µ = 6 Kings students are no different from the population overall H 1 : µ 6 Kings students differ from other Canadians in their beer consumption
62 Solution (cont.) Step 3: Select Sampling Distribution and Establish the Critical Region 1. Small sample, I-R level, so use t distribution. 2. Alpha (α) = Degrees of Freedom = N-1 = 30-1 = Critical t =?
63
64 Solution (cont.) Step 3: Select Sampling Distribution and Establish the Critical Region 1. Small sample, I-R level, so use t distribution. 2. Alpha (α) = Degrees of Freedom = N-1 = 30-1 = t (critical)=? = 2.045
65 Solution (cont.) Step 4: Use Formula to Compute the Test Statistic t (obtained) S n
66 Looking at the curve for the Z distribution Alpha (α) =.05 t= t = c
67 Step 5 Make a Decision and Interpret Results The obtained t score fell in the Critical Region, so we reject the H 0 (t (obtained) > t (critical) If the H 0 were true, a sample outcome of 8 would be unlikely. Therefore, we consider H 0 to be false and must be rejected. Kings students likely have drinking habits (beer consumption) that are significant different from other Canadians (t = 2.15, df = 29, α =.05).
68 Testing Sample Proportions (n>100): Formula 7.3 Beyond this, if working with a large sample, same essential 5 steps as with testing sample means 8-68

69 Testing Sample Proportions: Example: 48% of a sample of 250 Kings students report being Catholic. Data is available from the Census indicate that 43% of all residents of Ontario report being Catholic. Are Kings students significantly more likely to be Catholic than other Ontario residents? If the data are in % format, convert to a proportion first (48% ->.48) The method is virtually identical as the one sample Z-test for means, except we work with proportions and a slightly different formula for Z (obtained) -> Follow the 5 step model.
70 Solution (using five step model) Step 1: Make Assumptions and Meet Test Requirements: Random sample Level of measurement is nominal -> use proportions The sample is large (>100), so we can work with a normal distribution as our sampling distribution
71 Solution (cont.) Step 2: State the null and alternate hypotheses. H 0 : P µ =.43 The full population of Kings students are no different from the Ontario population overall H 1 : P µ >.43 Kings students are more likely to be Catholic than other Ontario residents
72 Solution (cont.) Step 3: Select Sampling Distribution and Establish the Critical Region 1. Sampling distribution = Z distribution 2. Alpha (α) = Critical Z =? = (why? one tailed test)
73 Solution (cont.) Step 4: Use Formula to Compute the Test Statistic Z (obtained) Ps P (1 P P ) / n (1.43) /
74 Looking at the curve for the Z distribution Alpha (α) =
75 Step 5 Make a Decision and Interpret Results The obtained Z score did not fall in the Critical Region, so we fail to reject the H 0 Kings students do not appear to be significantly more likely to be Catholic than the population over all (Z = 1.60, α =.05, n=250 ).
76 NOTE: What if we had the exact same data, but this time with N=1000, rather than 250? With original sample (N=250) Z (obtained) Ps P P (1 P ) / n.43(1.43) / 250 With a larger sample (N=1000) Z (obtained) Ps P P (1 P ) / n.43(1.43) /1000
77 Looking at the curve for the Z distribution Alpha (α) = with n= with n=1000 WITH A MUCH LARGER SAMPLE, THE SAME PROPORTIONAL DIFFERENCE CANBECOME SIGNIFICANT!!! (WE KNOW FOR SURE IT IS A REAL DIFFERENCE)
78 Alpha levels affect Critical Region in Step 3: 8-78
79 Alpha Levels By assigning an alpha level, α, one defines an unlikely sample outcome. Alpha level is the probability that the decision to reject the null hypothesis, H 0, is incorrect. Incorrectly rejecting a true null hypothesis: Type I or alpha error There is a very small chance that I just committed a Type I error,.. i.e. incorrectly concluded that recent immigrants are earning significantly less than other Canadians when in reality they aren t!! 8-79
80 Alpha Levels (continued) Type I, or alpha error: Rejecting a true null hypothesis Type II, or beta error: Failing to reject a false null hypothesis (i.e. in reality there is a significant difference, but I don t conclude this to be the case) 8-80
81 There is a relationship between decision making and error: An alpha =.10 leads to a greater chance of a Type 1 error An alpha =.01 leads to a greater chance of a Type II error Setting our alpha at.05 is usually considered a relatively good compromise in light of the possibility of both types of errors

82 Is there a significant difference?
Last week: Sample, population and sampling distributions finished with estimation & confidence intervals
 Past weeks: Measures of central tendency (mean, mode, median) Measures of dispersion (standard deviation, variance, range, etc). Working with the normal curve Last week: Sample, population and sampling
Single Sample Means. SOCY601 Alan Neustadtl
 Single Sample Means SOCY601 Alan Neustadtl The Central Limit Theorem If we have a population measured by a variable with a mean µ and a standard deviation σ, and if all possible random samples of size
HYPOTHESIS TESTING. Hypothesis Testing
 MBA 605 Business Analytics Don Conant, PhD. HYPOTHESIS TESTING Hypothesis testing involves making inferences about the nature of the population on the basis of observations of a sample drawn from the population.
CIVL /8904 T R A F F I C F L O W T H E O R Y L E C T U R E - 8
 CIVL - 7904/8904 T R A F F I C F L O W T H E O R Y L E C T U R E - 8 Chi-square Test How to determine the interval from a continuous distribution I = Range 1 + 3.322(logN) I-> Range of the class interval
1 Descriptive statistics. 2 Scores and probability distributions. 3 Hypothesis testing and one-sample t-test. 4 More on t-tests
 Overall Overview INFOWO Statistics lecture S3: Hypothesis testing Peter de Waal Department of Information and Computing Sciences Faculty of Science, Universiteit Utrecht 1 Descriptive statistics 2 Scores
PSY 305. Module 3. Page Title. Introduction to Hypothesis Testing Z-tests. Five steps in hypothesis testing
 Page Title PSY 305 Module 3 Introduction to Hypothesis Testing Z-tests Five steps in hypothesis testing State the research and null hypothesis Determine characteristics of comparison distribution Five
The t-test: A z-score for a sample mean tells us where in the distribution the particular mean lies
 The t-test: So Far: Sampling distribution benefit is that even if the original population is not normal, a sampling distribution based on this population will be normal (for sample size > 30). Benefit
AMS7: WEEK 7. CLASS 1. More on Hypothesis Testing Monday May 11th, 2015
 AMS7: WEEK 7. CLASS 1 More on Hypothesis Testing Monday May 11th, 2015 Testing a Claim about a Standard Deviation or a Variance We want to test claims about or 2 Example: Newborn babies from mothers taking
Review of Statistics 101
 Review of Statistics 101 We review some important themes from the course 1. Introduction Statistics- Set of methods for collecting/analyzing data (the art and science of learning from data). Provides methods
QUEEN S UNIVERSITY FINAL EXAMINATION FACULTY OF ARTS AND SCIENCE DEPARTMENT OF ECONOMICS APRIL 2018
 Page 1 of 4 QUEEN S UNIVERSITY FINAL EXAMINATION FACULTY OF ARTS AND SCIENCE DEPARTMENT OF ECONOMICS APRIL 2018 ECONOMICS 250 Introduction to Statistics Instructor: Gregor Smith Instructions: The exam
Statistics Primer. ORC Staff: Jayme Palka Peter Boedeker Marcus Fagan Trey Dejong
 Statistics Primer ORC Staff: Jayme Palka Peter Boedeker Marcus Fagan Trey Dejong 1 Quick Overview of Statistics 2 Descriptive vs. Inferential Statistics Descriptive Statistics: summarize and describe data
Lab #12: Exam 3 Review Key
 Psychological Statistics Practice Lab#1 Dr. M. Plonsky Page 1 of 7 Lab #1: Exam 3 Review Key 1) a. Probability - Refers to the likelihood that an event will occur. Ranges from 0 to 1. b. Sampling Distribution
Quantitative Analysis and Empirical Methods
 Hypothesis testing Sciences Po, Paris, CEE / LIEPP Introduction Hypotheses Procedure of hypothesis testing Two-tailed and one-tailed tests Statistical tests with categorical variables A hypothesis A testable
Sampling Distributions: Central Limit Theorem
 Review for Exam 2 Sampling Distributions: Central Limit Theorem Conceptually, we can break up the theorem into three parts: 1. The mean (µ M ) of a population of sample means (M) is equal to the mean (µ)
Two-Sample Inferential Statistics
 The t Test for Two Independent Samples 1 Two-Sample Inferential Statistics In an experiment there are two or more conditions One condition is often called the control condition in which the treatment is
7.2 One-Sample Correlation ( = a) Introduction. Correlation analysis measures the strength and direction of association between
 Introduction. Correlation analysis measures the strength and direction of association between") 7.2 One-Sample Correlation ( = a) Introduction Correlation analysis measures the strength and direction of association between variables. In this chapter we will test whether the population correlation
7.2 One-Sample Correlation ( = a) Introduction Correlation analysis measures the strength and direction of association between variables. In this chapter we will test whether the population correlation
First we look at some terms to be used in this section.
 8 Hypothesis Testing 8.1 Introduction MATH1015 Biostatistics Week 8 In Chapter 7, we ve studied the estimation of parameters, point or interval estimates. The construction of CI relies on the sampling
POLI 443 Applied Political Research
 POLI 443 Applied Political Research Session 4 Tests of Hypotheses The Normal Curve Lecturer: Prof. A. Essuman-Johnson, Dept. of Political Science Contact Information: aessuman-johnson@ug.edu.gh College
Statistical Inference. Section 9.1 Significance Tests: The Basics. Significance Test. The Reasoning of Significance Tests.
 Section 9.1 Significance Tests: The Basics Significance Test A significance test is a formal procedure for comparing observed data with a claim (also called a hypothesis) whose truth we want to assess.
ECO220Y Review and Introduction to Hypothesis Testing Readings: Chapter 12
 ECO220Y Review and Introduction to Hypothesis Testing Readings: Chapter 12 Winter 2012 Lecture 13 (Winter 2011) Estimation Lecture 13 1 / 33 Review of Main Concepts Sampling Distribution of Sample Mean
INTERVAL ESTIMATION AND HYPOTHESES TESTING
 INTERVAL ESTIMATION AND HYPOTHESES TESTING 1. IDEA An interval rather than a point estimate is often of interest. Confidence intervals are thus important in empirical work. To construct interval estimates,
Harvard University. Rigorous Research in Engineering Education
 Statistical Inference Kari Lock Harvard University Department of Statistics Rigorous Research in Engineering Education 12/3/09 Statistical Inference You have a sample and want to use the data collected
Statistical Inference. Why Use Statistical Inference. Point Estimates. Point Estimates. Greg C Elvers
 Statistical Inference Greg C Elvers 1 Why Use Statistical Inference Whenever we collect data, we want our results to be true for the entire population and not just the sample that we used But our sample
Inferential statistics
 Inferential statistics Inference involves making a Generalization about a larger group of individuals on the basis of a subset or sample. Ahmed-Refat-ZU Null and alternative hypotheses In hypotheses testing,
Chapter 23. Inferences About Means. Monday, May 6, 13. Copyright 2009 Pearson Education, Inc.
 Chapter 23 Inferences About Means Sampling Distributions of Means Now that we know how to create confidence intervals and test hypotheses about proportions, we do the same for means. Just as we did before,
Business Statistics: Lecture 8: Introduction to Estimation & Hypothesis Testing
 Business Statistics: Lecture 8: Introduction to Estimation & Hypothesis Testing Agenda Introduction to Estimation Point estimation Interval estimation Introduction to Hypothesis Testing Concepts en terminology
Chapter 23. Inference About Means
 Chapter 23 Inference About Means 1 /57 Homework p554 2, 4, 9, 10, 13, 15, 17, 33, 34 2 /57 Objective Students test null and alternate hypotheses about a population mean. 3 /57 Here We Go Again Now that
Class 24. Daniel B. Rowe, Ph.D. Department of Mathematics, Statistics, and Computer Science. Marquette University MATH 1700
 Class 4 Daniel B. Rowe, Ph.D. Department of Mathematics, Statistics, and Computer Science Copyright 013 by D.B. Rowe 1 Agenda: Recap Chapter 9. and 9.3 Lecture Chapter 10.1-10.3 Review Exam 6 Problem Solving
ME3620. Theory of Engineering Experimentation. Spring Chapter IV. Decision Making for a Single Sample. Chapter IV
 Theory of Engineering Experimentation Chapter IV. Decision Making for a Single Sample Chapter IV 1 4 1 Statistical Inference The field of statistical inference consists of those methods used to make decisions
Can you tell the relationship between students SAT scores and their college grades?
 Correlation One Challenge Can you tell the relationship between students SAT scores and their college grades? A: The higher SAT scores are, the better GPA may be. B: The higher SAT scores are, the lower
Chapter 7 Comparison of two independent samples
 Chapter 7 Comparison of two independent samples 7.1 Introduction Population 1 µ σ 1 1 N 1 Sample 1 y s 1 1 n 1 Population µ σ N Sample y s n 1, : population means 1, : population standard deviations N
Simple Linear Regression: One Quantitative IV
 Simple Linear Regression: One Quantitative IV Linear regression is frequently used to explain variation observed in a dependent variable (DV) with theoretically linked independent variables (IV). For example,
UNIVERSITY OF TORONTO MISSISSAUGA. SOC222 Measuring Society In-Class Test. November 11, 2011 Duration 11:15a.m. 13 :00p.m.
 UNIVERSITY OF TORONTO MISSISSAUGA SOC222 Measuring Society In-Class Test November 11, 2011 Duration 11:15a.m. 13 :00p.m. Location: DV2074 Aids Allowed You may be charged with an academic offence for possessing
Difference between means - t-test /25
 Difference between means - t-test 1 Discussion Question p492 Ex 9-4 p492 1-3, 6-8, 12 Assume all variances are not equal. Ignore the test for variance. 2 Students will perform hypothesis tests for two
7 Estimation. 7.1 Population and Sample (P.91-92)
") 7 Estimation MATH1015 Biostatistics Week 7 7.1 Population and Sample (P.91-92) Suppose that we wish to study a particular health problem in Australia, for example, the average serum cholesterol level for
7 Estimation MATH1015 Biostatistics Week 7 7.1 Population and Sample (P.91-92) Suppose that we wish to study a particular health problem in Australia, for example, the average serum cholesterol level for
Hypothesis testing: Steps
 Review for Exam 2 Hypothesis testing: Steps Exam 2 Review 1. Determine appropriate test and hypotheses 2. Use distribution table to find critical statistic value(s) representing rejection region 3. Compute
Applied Statistics for the Behavioral Sciences
 Applied Statistics for the Behavioral Sciences Chapter 8 One-sample designs Hypothesis testing/effect size Chapter Outline Hypothesis testing null & alternative hypotheses alpha ( ), significance level,
THE SAMPLING DISTRIBUTION OF THE MEAN
 THE SAMPLING DISTRIBUTION OF THE MEAN COGS 14B JANUARY 26, 2017 TODAY Sampling Distributions Sampling Distribution of the Mean Central Limit Theorem INFERENTIAL STATISTICS Inferential statistics: allows
Sampling distribution of t. 2. Sampling distribution of t. 3. Example: Gas mileage investigation. II. Inferential Statistics (8) t =
 t =") 2. The distribution of t values that would be obtained if a value of t were calculated for each sample mean for all possible random of a given size from a population _ t ratio: (X - µ hyp ) t s x The result
2. The distribution of t values that would be obtained if a value of t were calculated for each sample mean for all possible random of a given size from a population _ t ratio: (X - µ hyp ) t s x The result
Chapter 2 Descriptive Statistics
 Chapter 2 Descriptive Statistics The Mean "When she told me I was average, she was just being mean". The mean is probably the most often used parameter or statistic used to describe the central tendency
Chapter 12: Estimation
 Chapter 12: Estimation Estimation In general terms, estimation uses a sample statistic as the basis for estimating the value of the corresponding population parameter. Although estimation and hypothesis
Variance Estimates and the F Ratio. ERSH 8310 Lecture 3 September 2, 2009
 Variance Estimates and the F Ratio ERSH 8310 Lecture 3 September 2, 2009 Today s Class Completing the analysis (the ANOVA table) Evaluating the F ratio Errors in hypothesis testing A complete numerical
Statistics for IT Managers
 Statistics for IT Managers 95-796, Fall 2012 Module 2: Hypothesis Testing and Statistical Inference (5 lectures) Reading: Statistics for Business and Economics, Ch. 5-7 Confidence intervals Given the sample
The t-statistic. Student s t Test
 The t-statistic 1 Student s t Test When the population standard deviation is not known, you cannot use a z score hypothesis test Use Student s t test instead Student s t, or t test is, conceptually, very
10/4/2013. Hypothesis Testing & z-test. Hypothesis Testing. Hypothesis Testing
 & z-test Lecture Set 11 We have a coin and are trying to determine if it is biased or unbiased What should we assume? Why? Flip coin n = 100 times E(Heads) = 50 Why? Assume we count 53 Heads... What could
Chapter 24. Comparing Means
 Chapter 4 Comparing Means!1 /34 Homework p579, 5, 7, 8, 10, 11, 17, 31, 3! /34 !3 /34 Objective Students test null and alternate hypothesis about two!4 /34 Plot the Data The intuitive display for comparing
Hypothesis testing: Steps
 Review for Exam 2 Hypothesis testing: Steps Repeated-Measures ANOVA 1. Determine appropriate test and hypotheses 2. Use distribution table to find critical statistic value(s) representing rejection region
HYPOTHESIS TESTING II TESTS ON MEANS. Sorana D. Bolboacă
 HYPOTHESIS TESTING II TESTS ON MEANS Sorana D. Bolboacă OBJECTIVES Significance value vs p value Parametric vs non parametric tests Tests on means: 1 Dec 14 2 SIGNIFICANCE LEVEL VS. p VALUE Materials and
Comparing Means from Two-Sample
 Comparing Means from Two-Sample Kwonsang Lee University of Pennsylvania kwonlee@wharton.upenn.edu April 3, 2015 Kwonsang Lee STAT111 April 3, 2015 1 / 22 Inference from One-Sample We have two options to
In the previous chapter, we learned how to use the method of least-squares
 03-Kahane-45364.qxd 11/9/2007 4:40 PM Page 37 3 Model Performance and Evaluation In the previous chapter, we learned how to use the method of least-squares to find a line that best fits a scatter of points.
Chapter 10. Correlation and Regression. McGraw-Hill, Bluman, 7th ed., Chapter 10 1
 Chapter 10 Correlation and Regression McGraw-Hill, Bluman, 7th ed., Chapter 10 1 Chapter 10 Overview Introduction 10-1 Scatter Plots and Correlation 10- Regression 10-3 Coefficient of Determination and
CENTRAL LIMIT THEOREM (CLT)
") CENTRAL LIMIT THEOREM (CLT) A sampling distribution is the probability distribution of the sample statistic that is formed when samples of size n are repeatedly taken from a population. If the sample statistic
CENTRAL LIMIT THEOREM (CLT) A sampling distribution is the probability distribution of the sample statistic that is formed when samples of size n are repeatedly taken from a population. If the sample statistic
Notes 3: Statistical Inference: Sampling, Sampling Distributions Confidence Intervals, and Hypothesis Testing
 Notes 3: Statistical Inference: Sampling, Sampling Distributions Confidence Intervals, and Hypothesis Testing 1. Purpose of statistical inference Statistical inference provides a means of generalizing
LECTURE 5. Introduction to Econometrics. Hypothesis testing
 LECTURE 5 Introduction to Econometrics Hypothesis testing October 18, 2016 1 / 26 ON TODAY S LECTURE We are going to discuss how hypotheses about coefficients can be tested in regression models We will
Introduction to Business Statistics QM 220 Chapter 12
 Department of Quantitative Methods & Information Systems Introduction to Business Statistics QM 220 Chapter 12 Dr. Mohammad Zainal 12.1 The F distribution We already covered this topic in Ch. 10 QM-220,
Section 10.1 (Part 2 of 2) Significance Tests: Power of a Test
 Significance Tests: Power of a Test") 1 Section 10.1 (Part 2 of 2) Significance Tests: Power of a Test Learning Objectives After this section, you should be able to DESCRIBE the relationship between the significance level of a test, P(Type
1 Section 10.1 (Part 2 of 2) Significance Tests: Power of a Test Learning Objectives After this section, you should be able to DESCRIBE the relationship between the significance level of a test, P(Type
Sampling Distributions
 Sampling Distributions Sampling Distribution of the Mean & Hypothesis Testing Remember sampling? Sampling Part 1 of definition Selecting a subset of the population to create a sample Generally random sampling
Samples and Populations Confidence Intervals Hypotheses One-sided vs. two-sided Statistical Significance Error Types. Statistiek I.
 Statistiek I Sampling John Nerbonne CLCG, Rijksuniversiteit Groningen http://www.let.rug.nl/nerbonne/teach/statistiek-i/ John Nerbonne 1/41 Overview 1 Samples and Populations 2 Confidence Intervals 3 Hypotheses
STAT 515 fa 2016 Lec Statistical inference - hypothesis testing
 STAT 515 fa 2016 Lec 20-21 Statistical inference - hypothesis testing Karl B. Gregory Wednesday, Oct 12th Contents 1 Statistical inference 1 1.1 Forms of the null and alternate hypothesis for µ and p....................
Hypothesis Testing. We normally talk about two types of hypothesis: the null hypothesis and the research or alternative hypothesis.
 Hypothesis Testing Today, we are going to begin talking about the idea of hypothesis testing how we can use statistics to show that our causal models are valid or invalid. We normally talk about two types
9/2/2010. Wildlife Management is a very quantitative field of study. throughout this course and throughout your career.
 Introduction to Data and Analysis Wildlife Management is a very quantitative field of study Results from studies will be used throughout this course and throughout your career. Sampling design influences
Statistics for Managers Using Microsoft Excel/SPSS Chapter 8 Fundamentals of Hypothesis Testing: One-Sample Tests
 Statistics for Managers Using Microsoft Excel/SPSS Chapter 8 Fundamentals of Hypothesis Testing: One-Sample Tests 1999 Prentice-Hall, Inc. Chap. 8-1 Chapter Topics Hypothesis Testing Methodology Z Test
Hypothesis Testing hypothesis testing approach formulation of the test statistic
 Hypothesis Testing For the next few lectures, we re going to look at various test statistics that are formulated to allow us to test hypotheses in a variety of contexts: In all cases, the hypothesis testing
Sociology 593 Exam 2 Answer Key March 28, 2002
 Sociology 59 Exam Answer Key March 8, 00 I. True-False. (0 points) Indicate whether the following statements are true or false. If false, briefly explain why.. A variable is called CATHOLIC. This probably
An inferential procedure to use sample data to understand a population Procedures
 Hypothesis Test An inferential procedure to use sample data to understand a population Procedures Hypotheses, the alpha value, the critical region (z-scores), statistics, conclusion Two types of errors
Lecture 14. Analysis of Variance * Correlation and Regression. The McGraw-Hill Companies, Inc., 2000
 Lecture 14 Analysis of Variance * Correlation and Regression Outline Analysis of Variance (ANOVA) 11-1 Introduction 11-2 Scatter Plots 11-3 Correlation 11-4 Regression Outline 11-5 Coefficient of Determination
Lecture 14. Outline. Outline. Analysis of Variance * Correlation and Regression Analysis of Variance (ANOVA)
") Outline Lecture 14 Analysis of Variance * Correlation and Regression Analysis of Variance (ANOVA) 11-1 Introduction 11- Scatter Plots 11-3 Correlation 11-4 Regression Outline 11-5 Coefficient of Determination
Outline Lecture 14 Analysis of Variance * Correlation and Regression Analysis of Variance (ANOVA) 11-1 Introduction 11- Scatter Plots 11-3 Correlation 11-4 Regression Outline 11-5 Coefficient of Determination
Hypothesis testing. Data to decisions
 Hypothesis testing Data to decisions The idea Null hypothesis: H 0 : the DGP/population has property P Under the null, a sample statistic has a known distribution If, under that that distribution, the
hypothesis a claim about the value of some parameter (like p)
") Testing hypotheses hypothesis a claim about the value of some parameter (like p) significance test procedure to assess the strength of evidence provided by a sample of data against the claim of a hypothesized
Testing hypotheses hypothesis a claim about the value of some parameter (like p) significance test procedure to assess the strength of evidence provided by a sample of data against the claim of a hypothesized
Inferences for Correlation
 Inferences for Correlation Quantitative Methods II Plan for Today Recall: correlation coefficient Bivariate normal distributions Hypotheses testing for population correlation Confidence intervals for population
Inferential Statistics
 Inferential Statistics Part 1 Sampling Distributions, Point Estimates & Confidence Intervals Inferential statistics are used to draw inferences (make conclusions/judgements) about a population from a sample.
COSC 341 Human Computer Interaction. Dr. Bowen Hui University of British Columbia Okanagan
 COSC 341 Human Computer Interaction Dr. Bowen Hui University of British Columbia Okanagan 1 Last Class Introduced hypothesis testing Core logic behind it Determining results significance in scenario when:
Area1 Scaled Score (NAPLEX) .535 ** **.000 N. Sig. (2-tailed)
 .535 ** **.000 N. Sig. (2-tailed)") Institutional Assessment Report Texas Southern University College of Pharmacy and Health Sciences "An Analysis of 2013 NAPLEX, P4-Comp. Exams and P3 courses The following analysis illustrates relationships
Institutional Assessment Report Texas Southern University College of Pharmacy and Health Sciences "An Analysis of 2013 NAPLEX, P4-Comp. Exams and P3 courses The following analysis illustrates relationships
Introduction to Estimation. Martina Litschmannová K210
 Introduction to Estimation Martina Litschmannová martina.litschmannova@vsb.cz K210 Populations vs. Sample A population includes each element from the set of observations that can be made. A sample consists
Student s t-distribution. The t-distribution, t-tests, & Measures of Effect Size
 Student s t-distribution The t-distribution, t-tests, & Measures of Effect Size Sampling Distributions Redux Chapter 7 opens with a return to the concept of sampling distributions from chapter 4 Sampling
Multiple Regression Analysis
 Multiple Regression Analysis y = β 0 + β 1 x 1 + β 2 x 2 +... β k x k + u 2. Inference 0 Assumptions of the Classical Linear Model (CLM)! So far, we know: 1. The mean and variance of the OLS estimators
Quantitative Methods for Economics, Finance and Management (A86050 F86050)
") Quantitative Methods for Economics, Finance and Management (A86050 F86050) Matteo Manera matteo.manera@unimib.it Marzio Galeotti marzio.galeotti@unimi.it 1 This material is taken and adapted from Guy Judge
Quantitative Methods for Economics, Finance and Management (A86050 F86050) Matteo Manera matteo.manera@unimib.it Marzio Galeotti marzio.galeotti@unimi.it 1 This material is taken and adapted from Guy Judge
Ordinary Least Squares Regression Explained: Vartanian
 Ordinary Least Squares Regression Explained: Vartanian When to Use Ordinary Least Squares Regression Analysis A. Variable types. When you have an interval/ratio scale dependent variable.. When your independent
y = a + bx 12.1: Inference for Linear Regression Review: General Form of Linear Regression Equation Review: Interpreting Computer Regression Output
 12.1: Inference for Linear Regression Review: General Form of Linear Regression Equation y = a + bx y = dependent variable a = intercept b = slope x = independent variable Section 12.1 Inference for Linear
Question. Hypothesis testing. Example. Answer: hypothesis. Test: true or not? Question. Average is not the mean! μ average. Random deviation or not?
 Hypothesis testing Question Very frequently: what is the possible value of μ? Sample: we know only the average! μ average. Random deviation or not? Standard error: the measure of the random deviation.
REED TUTORIALS (Pty) LTD ECS3706 EXAM PACK
 LTD ECS3706 EXAM PACK") REED TUTORIALS (Pty) LTD ECS3706 EXAM PACK 1 ECONOMETRICS STUDY PACK MAY/JUNE 2016 Question 1 (a) (i) Describing economic reality (ii) Testing hypothesis about economic theory (iii) Forecasting future
REED TUTORIALS (Pty) LTD ECS3706 EXAM PACK 1 ECONOMETRICS STUDY PACK MAY/JUNE 2016 Question 1 (a) (i) Describing economic reality (ii) Testing hypothesis about economic theory (iii) Forecasting future
Inferences About Two Proportions
 Inferences About Two Proportions Quantitative Methods II Plan for Today Sampling two populations Confidence intervals for differences of two proportions Testing the difference of proportions Examples 1
Hypothesis Tests and Estimation for Population Variances. Copyright 2014 Pearson Education, Inc.
 Hypothesis Tests and Estimation for Population Variances 11-1 Learning Outcomes Outcome 1. Formulate and carry out hypothesis tests for a single population variance. Outcome 2. Develop and interpret confidence
Sociology 593 Exam 2 March 28, 2002
 Sociology 59 Exam March 8, 00 I. True-False. (0 points) Indicate whether the following statements are true or false. If false, briefly explain why.. A variable is called CATHOLIC. This probably means that
MBA 605, Business Analytics Donald D. Conant, Ph.D. Master of Business Administration
 t-distribution Summary MBA 605, Business Analytics Donald D. Conant, Ph.D. Types of t-tests There are several types of t-test. In this course we discuss three. The single-sample t-test The two-sample t-test
Lecture on Null Hypothesis Testing & Temporal Correlation
 Lecture on Null Hypothesis Testing & Temporal Correlation CS 590.21 Analysis and Modeling of Brain Networks Department of Computer Science University of Crete Acknowledgement Resources used in the slides
Statistical Inference for Means
 Statistical Inference for Means Jamie Monogan University of Georgia February 18, 2011 Jamie Monogan (UGA) Statistical Inference for Means February 18, 2011 1 / 19 Objectives By the end of this meeting,
Stat 529 (Winter 2011) Experimental Design for the Two-Sample Problem. Motivation: Designing a new silver coins experiment
 Experimental Design for the Two-Sample Problem. Motivation: Designing a new silver coins experiment") Stat 529 (Winter 2011) Experimental Design for the Two-Sample Problem Reading: 2.4 2.6. Motivation: Designing a new silver coins experiment Sample size calculations Margin of error for the pooled two sample
Stat 529 (Winter 2011) Experimental Design for the Two-Sample Problem Reading: 2.4 2.6. Motivation: Designing a new silver coins experiment Sample size calculations Margin of error for the pooled two sample
Data analysis and Geostatistics - lecture VI
 Data analysis and Geostatistics - lecture VI Statistical testing with population distributions Statistical testing - the steps 1. Define a hypothesis to test in statistics only a hypothesis rejection is
INTRODUCTION TO ANALYSIS OF VARIANCE
 CHAPTER 22 INTRODUCTION TO ANALYSIS OF VARIANCE Chapter 18 on inferences about population means illustrated two hypothesis testing situations: for one population mean and for the difference between two
Chapter 9 Inferences from Two Samples
 Chapter 9 Inferences from Two Samples 9-1 Review and Preview 9-2 Two Proportions 9-3 Two Means: Independent Samples 9-4 Two Dependent Samples (Matched Pairs) 9-5 Two Variances or Standard Deviations Review
Time: 1 hour 30 minutes
 Paper Reference(s) 6684/01 Edexcel GCE Statistics S2 Gold Level G3 Time: 1 hour 30 minutes Materials required for examination papers Mathematical Formulae (Green) Items included with question Nil Candidates
Questions 3.83, 6.11, 6.12, 6.17, 6.25, 6.29, 6.33, 6.35, 6.50, 6.51, 6.53, 6.55, 6.59, 6.60, 6.65, 6.69, 6.70, 6.77, 6.79, 6.89, 6.
 Chapter 7 Reading 7.1, 7.2 Questions 3.83, 6.11, 6.12, 6.17, 6.25, 6.29, 6.33, 6.35, 6.50, 6.51, 6.53, 6.55, 6.59, 6.60, 6.65, 6.69, 6.70, 6.77, 6.79, 6.89, 6.112 Introduction In Chapter 5 and 6, we emphasized
Psychology 282 Lecture #4 Outline Inferences in SLR
 Psychology 282 Lecture #4 Outline Inferences in SLR Assumptions To this point we have not had to make any distributional assumptions. Principle of least squares requires no assumptions. Can use correlations
A3. Statistical Inference
 Appendi / A3. Statistical Inference / Mean, One Sample-1 A3. Statistical Inference Population Mean μ of a Random Variable with known standard deviation σ, and random sample of size n 1 Before selecting
Section 9.4. Notation. Requirements. Definition. Inferences About Two Means (Matched Pairs) Examples
 Examples") Objective Section 9.4 Inferences About Two Means (Matched Pairs) Compare of two matched-paired means using two samples from each population. Hypothesis Tests and Confidence Intervals of two dependent means
Objective Section 9.4 Inferences About Two Means (Matched Pairs) Compare of two matched-paired means using two samples from each population. Hypothesis Tests and Confidence Intervals of two dependent means
STAT Chapter 8: Hypothesis Tests
 STAT 515 -- Chapter 8: Hypothesis Tests CIs are possibly the most useful forms of inference because they give a range of reasonable values for a parameter. But sometimes we want to know whether one particular
H0: Tested by k-grp ANOVA
 Pairwise Comparisons ANOVA for multiple condition designs Pairwise comparisons and RH Testing Alpha inflation & Correction LSD & HSD procedures Alpha estimation reconsidered H0: Tested by k-grp ANOVA Regardless
H0: Tested by k-grp ANOVA
 Analyses of K-Group Designs : Omnibus F, Pairwise Comparisons & Trend Analyses ANOVA for multiple condition designs Pairwise comparisons and RH Testing Alpha inflation & Correction LSD & HSD procedures
Inference for the mean of a population. Testing hypotheses about a single mean (the one sample t-test). The sign test for matched pairs
. The sign test for matched pairs") Stat 528 (Autumn 2008) Inference for the mean of a population (One sample t procedures) Reading: Section 7.1. Inference for the mean of a population. The t distribution for a normal population. Small sample
Stat 528 (Autumn 2008) Inference for the mean of a population (One sample t procedures) Reading: Section 7.1. Inference for the mean of a population. The t distribution for a normal population. Small sample