Chapter 5 Confidence Intervals
|
|
|
- Maurice Tyler
- 6 years ago
- Views:
Transcription
1 Chapter 5 Confidence Intervals Confidence Intervals about a Population Mean, σ, Known Abbas Motamedi Tennessee Tech University

2 A point estimate: a single number, calculated from a set of data, that is the best guess for the parameter. (Common notation: put a hat on the parameter.)
3 A point estimate is a single number, How much uncertainty is associated with a point estimate of a population parameter? An interval estimate provides more information about a population characteristic than does a point estimate. It provides a confidence level for the estimate. Such interval estimates are called confidence intervals Lower Confidence Limit Point Estimate Width of confidence interval Upper Confidence Limit
4 A confidence interval estimate: A range of numbers around the point estimate within which the parameter is believed to fall. Also called a confidence interval.
5 An interval gives a range of values: Takes into consideration variation in sample statistics from sample to sample Gives information about closeness to unknown population parameters Stated in terms of level of confidence. (Can never be 100% confident) The general formula for all confidence intervals is equal to: Point Estimate ± (Critical Value)(Standard Error)
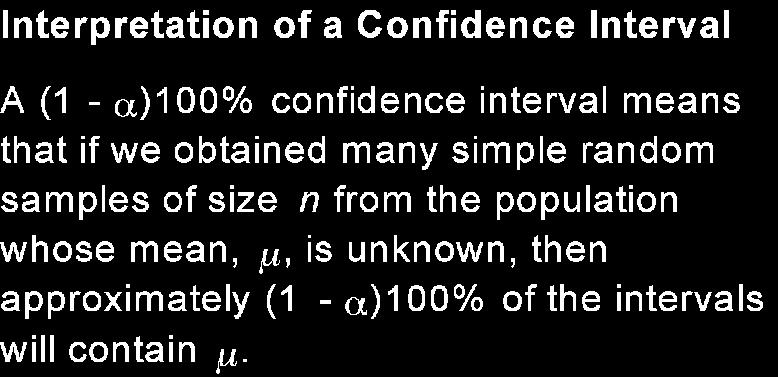
6 The level of confidence in a confidence interval is a probability that represents the percentage of intervals that will contain if a large number of repeated samples are obtained. The level of confidence is denoted Example: 95% confidence, 99% confidence Can never be 100% confident
7 For example, a 95% level of confidence would mean that if 100 confidence intervals were constructed, each based on a different sample from the same population, we would expect 95 of the intervals to contain the population mean.

8 The construction of a confidence interval for the population mean depends upon three factors q The point estimate of the population q The level of confidence q The standard deviation of the sample mean
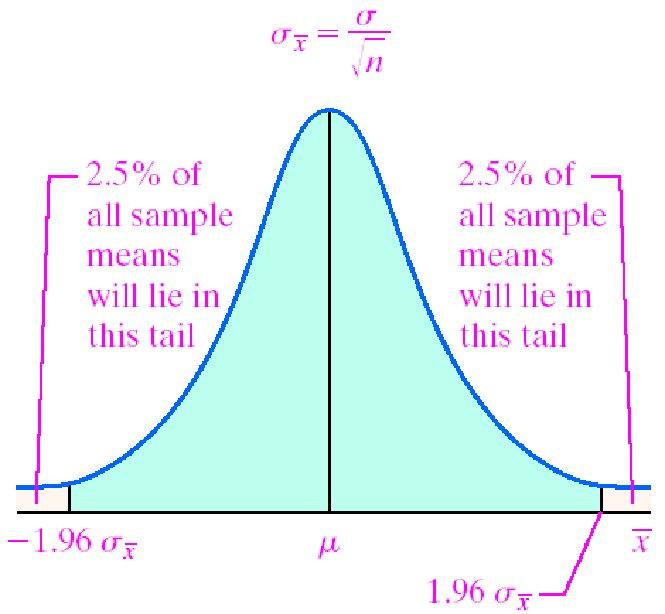
9 Suppose we obtain a simple random sample from a population. Provided that the population is normally distributed or the sample size is large, the distribution of the sample mean will be normal with
10
11
12
13 95% of all sample means are in the interval With a little algebraic manipulation, we can rewrite this inequality and obtain:
14
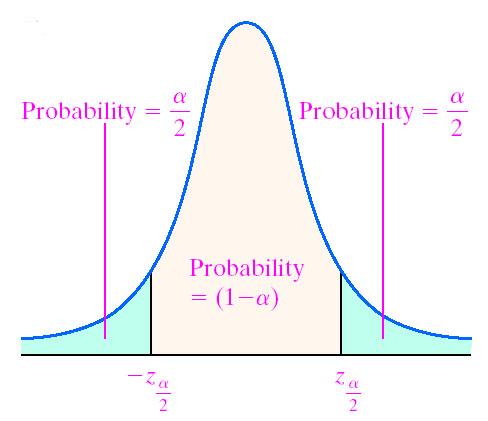
15 q The level of significance, or α risk is the chance we take that the true population parameter is not contained in the confidence interval. q Therefore, a 95% confidence interval would have an α of 5%.
16
17
18 The Level of Significance (α) If α =.05, then each tail has.025 area The critical values of z that define the α areas are and % Confidence Interval a = z z a = Point Estimate.9750 Z Z α is the proportion in the tails of the sampling distribution that is outside the established confidence interval.

19 The z Table.0250 of the area under the standardized normal distribution corresponds to z.


20 The z Table.9750 of the area under the standardized normal distribution corresponds to z.
21
22 Recall: Single population mean (large n) Hypothesis test: Z = observed mean null s n mean Confidence Interval confidence interval = observed mean ± Z /2 α *( s n )
23 Single population mean (small n, normally distributed trait) Hypothesis test: T n 1 observed mean null = s n mean Confidence Interval confidence interval = observed mean ± Tn 1, /2 α *( s n )
24 What is a T-distribution? A t-distribution is like a Z distribution, except has slightly fatter tails to reflect the uncertainty added by estimating σ. The bigger the sample size (i.e., the bigger the sample size used to estimate σ), then the closer t becomes to Z. If n>100, t approaches Z.
25 T-distribution with only 1 degree of freedom.
26 T-distribution with 4 degrees of freedom.
27 T-distribution with 9 degrees of freedom.
28 T-distribution with 29 degrees of freedom.

29 T-distribution with 99 degrees of freedom. Looks a lot like Z!!
30 Student s t Distribution Note: t Z as n increases Standard Normal (t with df = ) t-distributions are bellshaped and symmetric, but have fatter tails than the normal t (df = 13) t (df = 5) from Statistics for Managers Using Microsoft Excel 4 th Edition, Prentice-Hall t
31 Student s t Table Upper Tail Area df Let: n = 3 df = n - 1 = 2 α =.10 α/2 = α/2 =.05 The body of the table contains t values, not probabilities t from Statistics for Managers Using Microsoft Excel 4 th Edition, Prentice-Hall 2004

32 Confidence Intervals for the Difference between Two Population Means µ 1 - µ 2 : Independent Samples Two random samples are drawn from the two populations of interest. Because we compare two population means, we use the statistic. x 1 x 2 32
33 Population 1 Population 2 Parameters: µ 1 and σ 1 2 Parameters: µ 2 and σ 2 2 (values are unknown) (values are unknown) Sample size: n 1 Sample size: n 2 Statistics: x 1 and s 1 2 Statistics: x 2 and s 2 2 Estimate µ 1 - µ 2 with x 1 - x 2 33
34 Confidence Interval for µ 1 µ 2 Confidence interval ( x x ) z 1 2 where * ± + z * σ 2 σ n n 1 2 is the value from the z-table that corresponds to the confidence level Note: when the values of σ 1 2 and σ 2 2 are unknown, the sample variances s 1 2 and s 2 2 computed from the data can be used. 34
35 Inference about Two Populations We are interested in: Confidence intervals for the difference between two proportions. 35


36 Point Estimator: pˆ pˆ 1 2 Two random samples are drawn from two populations. The number of successes in each sample is recorded. The sample proportions are computed. Sample 1 Sample size n 1 Number of successes x 1 Sample proportion ˆ = p 1 x n 1 1 Sample 2 Sample size n 2 Number of successes x 2 Sample proportion x2 pˆ 2 = n 2 36
37 37 Confidence Interval for p 1 - p 2 confidence level the z - table that depends on the where z*is the appropriate value from ) ˆ (1 ˆ ) ˆ (1 ˆ ) ˆ ˆ ( * 2 1 n p p n p p z p p + ±
Statistics for Managers Using Microsoft Excel 7 th Edition
 Statistics for Managers Using Microsoft Excel 7 th Edition Chapter 8 Confidence Interval Estimation Statistics for Managers Using Microsoft Excel 7e Copyright 2014 Pearson Education, Inc. Chap 8-1 Learning
T.I.H.E. IT 233 Statistics and Probability: Sem. 1: 2013 ESTIMATION AND HYPOTHESIS TESTING OF TWO POPULATIONS
 ESTIMATION AND HYPOTHESIS TESTING OF TWO POPULATIONS In our work on hypothesis testing, we used the value of a sample statistic to challenge an accepted value of a population parameter. We focused only
Single Sample Means. SOCY601 Alan Neustadtl
 Single Sample Means SOCY601 Alan Neustadtl The Central Limit Theorem If we have a population measured by a variable with a mean µ and a standard deviation σ, and if all possible random samples of size
Percentage point z /2
 Chapter 8: Statistical Intervals Why? point estimate is not reliable under resampling. Interval Estimates: Bounds that represent an interval of plausible values for a parameter There are three types of
Lecture 2. Estimating Single Population Parameters 8-1
 Lecture 2 Estimating Single Population Parameters 8-1 8.1 Point and Confidence Interval Estimates for a Population Mean Point Estimate A single statistic, determined from a sample, that is used to estimate
Harvard University. Rigorous Research in Engineering Education
 Statistical Inference Kari Lock Harvard University Department of Statistics Rigorous Research in Engineering Education 12/3/09 Statistical Inference You have a sample and want to use the data collected
7.2 One-Sample Correlation ( = a) Introduction. Correlation analysis measures the strength and direction of association between
 Introduction. Correlation analysis measures the strength and direction of association between") 7.2 One-Sample Correlation ( = a) Introduction Correlation analysis measures the strength and direction of association between variables. In this chapter we will test whether the population correlation
7.2 One-Sample Correlation ( = a) Introduction Correlation analysis measures the strength and direction of association between variables. In this chapter we will test whether the population correlation
Lecture Slides. Elementary Statistics Tenth Edition. by Mario F. Triola. and the Triola Statistics Series
 Lecture Slides Elementary Statistics Tenth Edition and the Triola Statistics Series by Mario F. Triola Slide 1 Chapter 7 Estimates and Sample Sizes 7-1 Overview 7-2 Estimating a Population Proportion 7-3
Chapter 9 Inferences from Two Samples
 Chapter 9 Inferences from Two Samples 9-1 Review and Preview 9-2 Two Proportions 9-3 Two Means: Independent Samples 9-4 Two Dependent Samples (Matched Pairs) 9-5 Two Variances or Standard Deviations Review
Two-Sample Inferential Statistics
 The t Test for Two Independent Samples 1 Two-Sample Inferential Statistics In an experiment there are two or more conditions One condition is often called the control condition in which the treatment is
Business Statistics. Lecture 5: Confidence Intervals
 Business Statistics Lecture 5: Confidence Intervals Goals for this Lecture Confidence intervals The t distribution 2 Welcome to Interval Estimation! Moments Mean 815.0340 Std Dev 0.8923 Std Error Mean
STA Module 10 Comparing Two Proportions
 STA 2023 Module 10 Comparing Two Proportions Learning Objectives Upon completing this module, you should be able to: 1. Perform large-sample inferences (hypothesis test and confidence intervals) to compare
EC2001 Econometrics 1 Dr. Jose Olmo Room D309
 EC2001 Econometrics 1 Dr. Jose Olmo Room D309 J.Olmo@City.ac.uk 1 Revision of Statistical Inference 1.1 Sample, observations, population A sample is a number of observations drawn from a population. Population:
HYPOTHESIS TESTING. Hypothesis Testing
 MBA 605 Business Analytics Don Conant, PhD. HYPOTHESIS TESTING Hypothesis testing involves making inferences about the nature of the population on the basis of observations of a sample drawn from the population.
Questions 3.83, 6.11, 6.12, 6.17, 6.25, 6.29, 6.33, 6.35, 6.50, 6.51, 6.53, 6.55, 6.59, 6.60, 6.65, 6.69, 6.70, 6.77, 6.79, 6.89, 6.
 Chapter 7 Reading 7.1, 7.2 Questions 3.83, 6.11, 6.12, 6.17, 6.25, 6.29, 6.33, 6.35, 6.50, 6.51, 6.53, 6.55, 6.59, 6.60, 6.65, 6.69, 6.70, 6.77, 6.79, 6.89, 6.112 Introduction In Chapter 5 and 6, we emphasized
STAT Chapter 8: Hypothesis Tests
 STAT 515 -- Chapter 8: Hypothesis Tests CIs are possibly the most useful forms of inference because they give a range of reasonable values for a parameter. But sometimes we want to know whether one particular
Statistical Inference for Means
 Statistical Inference for Means Jamie Monogan University of Georgia February 18, 2011 Jamie Monogan (UGA) Statistical Inference for Means February 18, 2011 1 / 19 Objectives By the end of this meeting,
Lecture Slides. Elementary Statistics Eleventh Edition. by Mario F. Triola. and the Triola Statistics Series 9.1-1
 Lecture Slides Elementary Statistics Eleventh Edition and the Triola Statistics Series by Mario F. Triola Copyright 2010, 2007, 2004 Pearson Education, Inc. All Rights Reserved. 9.1-1 Chapter 9 Inferences
Chapter 24. Comparing Means. Copyright 2010 Pearson Education, Inc.
 Chapter 24 Comparing Means Copyright 2010 Pearson Education, Inc. Plot the Data The natural display for comparing two groups is boxplots of the data for the two groups, placed side-by-side. For example:
Statistical Analysis for QBIC Genetics Adapted by Ellen G. Dow 2017
 Statistical Analysis for QBIC Genetics Adapted by Ellen G. Dow 2017 I. χ 2 or chi-square test Objectives: Compare how close an experimentally derived value agrees with an expected value. One method to
An inferential procedure to use sample data to understand a population Procedures
 Hypothesis Test An inferential procedure to use sample data to understand a population Procedures Hypotheses, the alpha value, the critical region (z-scores), statistics, conclusion Two types of errors
Chapter 8 - Statistical intervals for a single sample
 Chapter 8 - Statistical intervals for a single sample 8-1 Introduction In statistics, no quantity estimated from data is known for certain. All estimated quantities have probability distributions of their
Quantitative Methods for Economics, Finance and Management (A86050 F86050)
") Quantitative Methods for Economics, Finance and Management (A86050 F86050) Matteo Manera matteo.manera@unimib.it Marzio Galeotti marzio.galeotti@unimi.it 1 This material is taken and adapted from Guy Judge
Quantitative Methods for Economics, Finance and Management (A86050 F86050) Matteo Manera matteo.manera@unimib.it Marzio Galeotti marzio.galeotti@unimi.it 1 This material is taken and adapted from Guy Judge
CIVL /8904 T R A F F I C F L O W T H E O R Y L E C T U R E - 8
 CIVL - 7904/8904 T R A F F I C F L O W T H E O R Y L E C T U R E - 8 Chi-square Test How to determine the interval from a continuous distribution I = Range 1 + 3.322(logN) I-> Range of the class interval
Mathematical Notation Math Introduction to Applied Statistics
 Mathematical Notation Math 113 - Introduction to Applied Statistics Name : Use Word or WordPerfect to recreate the following documents. Each article is worth 10 points and should be emailed to the instructor
Lectures 5 & 6: Hypothesis Testing
 Lectures 5 & 6: Hypothesis Testing in which you learn to apply the concept of statistical significance to OLS estimates, learn the concept of t values, how to use them in regression work and come across
CHAPTER 10 Comparing Two Populations or Groups
 CHAPTER 10 Comparing Two Populations or Groups 10.1 Comparing Two Proportions The Practice of Statistics, 5th Edition Starnes, Tabor, Yates, Moore Bedford Freeman Worth Publishers Comparing Two Proportions
Chapter 23. Inferences About Means. Monday, May 6, 13. Copyright 2009 Pearson Education, Inc.
 Chapter 23 Inferences About Means Sampling Distributions of Means Now that we know how to create confidence intervals and test hypotheses about proportions, we do the same for means. Just as we did before,
Psychology 282 Lecture #4 Outline Inferences in SLR
 Psychology 282 Lecture #4 Outline Inferences in SLR Assumptions To this point we have not had to make any distributional assumptions. Principle of least squares requires no assumptions. Can use correlations
Chapter 10. Regression. Understandable Statistics Ninth Edition By Brase and Brase Prepared by Yixun Shi Bloomsburg University of Pennsylvania
 Chapter 10 Regression Understandable Statistics Ninth Edition By Brase and Brase Prepared by Yixun Shi Bloomsburg University of Pennsylvania Scatter Diagrams A graph in which pairs of points, (x, y), are
Section 9.4. Notation. Requirements. Definition. Inferences About Two Means (Matched Pairs) Examples
 Examples") Objective Section 9.4 Inferences About Two Means (Matched Pairs) Compare of two matched-paired means using two samples from each population. Hypothesis Tests and Confidence Intervals of two dependent means
Objective Section 9.4 Inferences About Two Means (Matched Pairs) Compare of two matched-paired means using two samples from each population. Hypothesis Tests and Confidence Intervals of two dependent means
Sections 7.1 and 7.2. This chapter presents the beginning of inferential statistics. The two major applications of inferential statistics
 Sections 7.1 and 7.2 This chapter presents the beginning of inferential statistics. The two major applications of inferential statistics Estimate the value of a population parameter Test some claim (or
A proportion is the fraction of individuals having a particular attribute. Can range from 0 to 1!
 Proportions A proportion is the fraction of individuals having a particular attribute. It is also the probability that an individual randomly sampled from the population will have that attribute Can range
Confidence intervals
 Confidence intervals We now want to take what we ve learned about sampling distributions and standard errors and construct confidence intervals. What are confidence intervals? Simply an interval for which
y ˆ i = ˆ " T u i ( i th fitted value or i th fit)
") 1 2 INFERENCE FOR MULTIPLE LINEAR REGRESSION Recall Terminology: p predictors x 1, x 2,, x p Some might be indicator variables for categorical variables) k-1 non-constant terms u 1, u 2,, u k-1 Each u
1 2 INFERENCE FOR MULTIPLE LINEAR REGRESSION Recall Terminology: p predictors x 1, x 2,, x p Some might be indicator variables for categorical variables) k-1 non-constant terms u 1, u 2,, u k-1 Each u
Review: General Approach to Hypothesis Testing. 1. Define the research question and formulate the appropriate null and alternative hypotheses.
 1 Review: Let X 1, X,..., X n denote n independent random variables sampled from some distribution might not be normal!) with mean µ) and standard deviation σ). Then X µ σ n In other words, X is approximately
CBA4 is live in practice mode this week exam mode from Saturday!
 Announcements CBA4 is live in practice mode this week exam mode from Saturday! Material covered: Confidence intervals (both cases) 1 sample hypothesis tests (both cases) Hypothesis tests for 2 means as
Correlation Analysis
 Simple Regression Correlation Analysis Correlation analysis is used to measure strength of the association (linear relationship) between two variables Correlation is only concerned with strength of the
Review of Statistics 101
 Review of Statistics 101 We review some important themes from the course 1. Introduction Statistics- Set of methods for collecting/analyzing data (the art and science of learning from data). Provides methods
Lecture 7: Hypothesis Testing and ANOVA
 Lecture 7: Hypothesis Testing and ANOVA Goals Overview of key elements of hypothesis testing Review of common one and two sample tests Introduction to ANOVA Hypothesis Testing The intent of hypothesis
Econometrics. 4) Statistical inference
 Statistical inference") 30C00200 Econometrics 4) Statistical inference Timo Kuosmanen Professor, Ph.D. http://nomepre.net/index.php/timokuosmanen Today s topics Confidence intervals of parameter estimates Student s t-distribution
30C00200 Econometrics 4) Statistical inference Timo Kuosmanen Professor, Ph.D. http://nomepre.net/index.php/timokuosmanen Today s topics Confidence intervals of parameter estimates Student s t-distribution
Preliminary Statistics Lecture 5: Hypothesis Testing (Outline)
") 1 School of Oriental and African Studies September 2015 Department of Economics Preliminary Statistics Lecture 5: Hypothesis Testing (Outline) Gujarati D. Basic Econometrics, Appendix A.8 Barrow M. Statistics
1 School of Oriental and African Studies September 2015 Department of Economics Preliminary Statistics Lecture 5: Hypothesis Testing (Outline) Gujarati D. Basic Econometrics, Appendix A.8 Barrow M. Statistics
Regression Models. Chapter 4. Introduction. Introduction. Introduction
 Chapter 4 Regression Models Quantitative Analysis for Management, Tenth Edition, by Render, Stair, and Hanna 008 Prentice-Hall, Inc. Introduction Regression analysis is a very valuable tool for a manager
Statistical Inference: Estimation and Confidence Intervals Hypothesis Testing
 Statistical Inference: Estimation and Confidence Intervals Hypothesis Testing 1 In most statistics problems, we assume that the data have been generated from some unknown probability distribution. We desire
CHAPTER 10 Comparing Two Populations or Groups
 CHAPTER 10 Comparing Two Populations or Groups 10. Comparing Two Means The Practice of Statistics, 5th Edition Starnes, Tabor, Yates, Moore Bedford Freeman Worth Publishers Comparing Two Means Learning
CHAPTER 10 Comparing Two Populations or Groups
 CHAPTER 10 Comparing Two Populations or Groups 10.2 Comparing Two Means The Practice of Statistics, 5th Edition Starnes, Tabor, Yates, Moore Bedford Freeman Worth Publishers Comparing Two Means Learning
Lecture 3: Inference in SLR
 Lecture 3: Inference in SLR STAT 51 Spring 011 Background Reading KNNL:.1.6 3-1 Topic Overview This topic will cover: Review of hypothesis testing Inference about 1 Inference about 0 Confidence Intervals
AMS7: WEEK 7. CLASS 1. More on Hypothesis Testing Monday May 11th, 2015
 AMS7: WEEK 7. CLASS 1 More on Hypothesis Testing Monday May 11th, 2015 Testing a Claim about a Standard Deviation or a Variance We want to test claims about or 2 Example: Newborn babies from mothers taking
Inferences About Two Proportions
 Inferences About Two Proportions Quantitative Methods II Plan for Today Sampling two populations Confidence intervals for differences of two proportions Testing the difference of proportions Examples 1
Confidence Intervals. - simply, an interval for which we have a certain confidence.
 Confidence Intervals I. What are confidence intervals? - simply, an interval for which we have a certain confidence. - for example, we are 90% certain that an interval contains the true value of something
Econ 325: Introduction to Empirical Economics
 Econ 325: Introduction to Empirical Economics Lecture 6 Sampling and Sampling Distributions Ch. 6-1 Populations and Samples A Population is the set of all items or individuals of interest Examples: All
Performance Evaluation and Comparison
 Outline Hong Chang Institute of Computing Technology, Chinese Academy of Sciences Machine Learning Methods (Fall 2012) Outline Outline I 1 Introduction 2 Cross Validation and Resampling 3 Interval Estimation
How do we compare the relative performance among competing models?
 How do we compare the relative performance among competing models? 1 Comparing Data Mining Methods Frequent problem: we want to know which of the two learning techniques is better How to reliably say Model
Inference for Regression Simple Linear Regression
 Inference for Regression Simple Linear Regression IPS Chapter 10.1 2009 W.H. Freeman and Company Objectives (IPS Chapter 10.1) Simple linear regression p Statistical model for linear regression p Estimating
Analysis of Variance
 Statistical Techniques II EXST7015 Analysis of Variance 15a_ANOVA_Introduction 1 Design The simplest model for Analysis of Variance (ANOVA) is the CRD, the Completely Randomized Design This model is also
LECTURE 12 CONFIDENCE INTERVAL AND HYPOTHESIS TESTING
 LECTURE 1 CONFIDENCE INTERVAL AND HYPOTHESIS TESTING INTERVAL ESTIMATION Point estimation of : The inference is a guess of a single value as the value of. No accuracy associated with it. Interval estimation
Population Variance. Concepts from previous lectures. HUMBEHV 3HB3 one-sample t-tests. Week 8
 Concepts from previous lectures HUMBEHV 3HB3 one-sample t-tests Week 8 Prof. Patrick Bennett sampling distributions - sampling error - standard error of the mean - degrees-of-freedom Null and alternative/research
Chapter 7. Inference for Distributions. Introduction to the Practice of STATISTICS SEVENTH. Moore / McCabe / Craig. Lecture Presentation Slides
 Chapter 7 Inference for Distributions Introduction to the Practice of STATISTICS SEVENTH EDITION Moore / McCabe / Craig Lecture Presentation Slides Chapter 7 Inference for Distributions 7.1 Inference for
Chapter 27 Summary Inferences for Regression
 Chapter 7 Summary Inferences for Regression What have we learned? We have now applied inference to regression models. Like in all inference situations, there are conditions that we must check. We can test
Lecture Slides. Elementary Statistics. Tenth Edition. by Mario F. Triola. and the Triola Statistics Series
 Lecture Slides Elementary Statistics Tenth Edition and the Triola Statistics Series by Mario F. Triola Slide 1 Chapter 7 Estimates and Sample Sizes 7-1 Overview 7-2 Estimating a Population Proportion 7-3
Chapter 23. Inference About Means
 Chapter 23 Inference About Means 1 /57 Homework p554 2, 4, 9, 10, 13, 15, 17, 33, 34 2 /57 Objective Students test null and alternate hypotheses about a population mean. 3 /57 Here We Go Again Now that
Class 24. Daniel B. Rowe, Ph.D. Department of Mathematics, Statistics, and Computer Science. Marquette University MATH 1700
 Class 4 Daniel B. Rowe, Ph.D. Department of Mathematics, Statistics, and Computer Science Copyright 013 by D.B. Rowe 1 Agenda: Recap Chapter 9. and 9.3 Lecture Chapter 10.1-10.3 Review Exam 6 Problem Solving
Business Statistics. Lecture 10: Course Review
 Business Statistics Lecture 10: Course Review 1 Descriptive Statistics for Continuous Data Numerical Summaries Location: mean, median Spread or variability: variance, standard deviation, range, percentiles,
Note that we are looking at the true mean, μ, not y. The problem for us is that we need to find the endpoints of our interval (a, b).
.") Confidence Intervals 1) What are confidence intervals? Simply, an interval for which we have a certain confidence. For example, we are 90% certain that an interval contains the true value of something
Confidence Intervals 1) What are confidence intervals? Simply, an interval for which we have a certain confidence. For example, we are 90% certain that an interval contains the true value of something
Chapter 8. Inferences Based on a Two Samples Confidence Intervals and Tests of Hypothesis
 Chapter 8 Inferences Based on a Two Samples Confidence Intervals and Tests of Hypothesis Copyright 2018, 2014, and 2011 Pearson Education, Inc. Slide - 1 Content 1. Identifying the Target Parameter 2.
Inference for Regression Inference about the Regression Model and Using the Regression Line
 Inference for Regression Inference about the Regression Model and Using the Regression Line PBS Chapter 10.1 and 10.2 2009 W.H. Freeman and Company Objectives (PBS Chapter 10.1 and 10.2) Inference about
Estimating σ 2. We can do simple prediction of Y and estimation of the mean of Y at any value of X.
 Estimating σ 2 We can do simple prediction of Y and estimation of the mean of Y at any value of X. To perform inferences about our regression line, we must estimate σ 2, the variance of the error term.
Biostatistics. Chapter 11 Simple Linear Correlation and Regression. Jing Li
 Biostatistics Chapter 11 Simple Linear Correlation and Regression Jing Li jing.li@sjtu.edu.cn http://cbb.sjtu.edu.cn/~jingli/courses/2018fall/bi372/ Dept of Bioinformatics & Biostatistics, SJTU Review
Chapter 7: Sampling Distributions
 + Chapter 7: Sampling Distributions Section 7.2 The Practice of Statistics, 4 th edition For AP* STARNES, YATES, MOORE + Chapter 7 Sampling Distributions n 7.1 What is a Sampling Distribution? n 7.2 n
Business Statistics. Lecture 10: Correlation and Linear Regression
 Business Statistics Lecture 10: Correlation and Linear Regression Scatterplot A scatterplot shows the relationship between two quantitative variables measured on the same individuals. It displays the Form
4.1 Hypothesis Testing
 4.1 Hypothesis Testing z-test for a single value double-sided and single-sided z-test for one average z-test for two averages double-sided and single-sided t-test for one average the F-parameter and F-table
Statistics for Managers Using Microsoft Excel Chapter 9 Two Sample Tests With Numerical Data
 Statistics for Managers Using Microsoft Excel Chapter 9 Two Sample Tests With Numerical Data 999 Prentice-Hall, Inc. Chap. 9 - Chapter Topics Comparing Two Independent Samples: Z Test for the Difference
Statistics for Business and Economics
 Statistics for Business and Economics Chapter 6 Sampling and Sampling Distributions Ch. 6-1 6.1 Tools of Business Statistics n Descriptive statistics n Collecting, presenting, and describing data n Inferential
LAB 2. HYPOTHESIS TESTING IN THE BIOLOGICAL SCIENCES- Part 2
 LAB 2. HYPOTHESIS TESTING IN THE BIOLOGICAL SCIENCES- Part 2 Data Analysis: The mean egg masses (g) of the two different types of eggs may be exactly the same, in which case you may be tempted to accept
Statistics for Managers Using Microsoft Excel Chapter 10 ANOVA and Other C-Sample Tests With Numerical Data
 Statistics for Managers Using Microsoft Excel Chapter 10 ANOVA and Other C-Sample Tests With Numerical Data 1999 Prentice-Hall, Inc. Chap. 10-1 Chapter Topics The Completely Randomized Model: One-Factor
A3. Statistical Inference Hypothesis Testing for General Population Parameters
 Appendix / A3. Statistical Inference / General Parameters- A3. Statistical Inference Hypothesis Testing for General Population Parameters POPULATION H 0 : θ = θ 0 θ is a generic parameter of interest (e.g.,
2011 Pearson Education, Inc
 Statistics for Business and Economics Chapter 7 Inferences Based on Two Samples: Confidence Intervals & Tests of Hypotheses Content 1. Identifying the Target Parameter 2. Comparing Two Population Means:
Mathematical Notation Math Introduction to Applied Statistics
 Mathematical Notation Math 113 - Introduction to Applied Statistics Name : Use Word or WordPerfect to recreate the following documents. Each article is worth 10 points and can be printed and given to the
Estimating a Population Mean
 Estimating a Population Mean MATH 130, Elements of Statistics I J. Robert Buchanan Department of Mathematics Fall 2017 Objectives At the end of this lesson we will be able to: obtain a point estimate for
Bayesian Inference for Normal Mean
 Al Nosedal. University of Toronto. November 18, 2015 Likelihood of Single Observation The conditional observation distribution of y µ is Normal with mean µ and variance σ 2, which is known. Its density
The t-statistic. Student s t Test
 The t-statistic 1 Student s t Test When the population standard deviation is not known, you cannot use a z score hypothesis test Use Student s t test instead Student s t, or t test is, conceptually, very
Chapter 12 - Lecture 2 Inferences about regression coefficient
 Chapter 12 - Lecture 2 Inferences about regression coefficient April 19th, 2010 Facts about slope Test Statistic Confidence interval Hypothesis testing Test using ANOVA Table Facts about slope In previous
DISTRIBUTIONS USED IN STATISTICAL WORK
 DISTRIBUTIONS USED IN STATISTICAL WORK In one of the classic introductory statistics books used in Education and Psychology (Glass and Stanley, 1970, Prentice-Hall) there was an excellent chapter on different
Chapter 7 Comparison of two independent samples
 Chapter 7 Comparison of two independent samples 7.1 Introduction Population 1 µ σ 1 1 N 1 Sample 1 y s 1 1 n 1 Population µ σ N Sample y s n 1, : population means 1, : population standard deviations N
7 Estimation. 7.1 Population and Sample (P.91-92)
") 7 Estimation MATH1015 Biostatistics Week 7 7.1 Population and Sample (P.91-92) Suppose that we wish to study a particular health problem in Australia, for example, the average serum cholesterol level for
7 Estimation MATH1015 Biostatistics Week 7 7.1 Population and Sample (P.91-92) Suppose that we wish to study a particular health problem in Australia, for example, the average serum cholesterol level for
Lecture 17: Small-Sample Inferences for Normal Populations. Confidence intervals for µ when σ is unknown
 Lecture 17: Small-Sample Inferences for Normal Populations Confidence intervals for µ when σ is unknown If the population distribution is normal, then X µ σ/ n has a standard normal distribution. If σ
Note that we are looking at the true mean, μ, not y. The problem for us is that we need to find the endpoints of our interval (a, b).
.") Confidence Intervals 1) What are confidence intervals? Simply, an interval for which we have a certain confidence. For example, we are 90% certain that an interval contains the true value of something
Confidence Intervals 1) What are confidence intervals? Simply, an interval for which we have a certain confidence. For example, we are 90% certain that an interval contains the true value of something
Probability Methods in Civil Engineering Prof. Dr. Rajib Maity Department of Civil Engineering Indian Institution of Technology, Kharagpur
 Probability Methods in Civil Engineering Prof. Dr. Rajib Maity Department of Civil Engineering Indian Institution of Technology, Kharagpur Lecture No. # 36 Sampling Distribution and Parameter Estimation
Multiple Regression Analysis
 Multiple Regression Analysis y = β 0 + β 1 x 1 + β 2 x 2 +... β k x k + u 2. Inference 0 Assumptions of the Classical Linear Model (CLM)! So far, we know: 1. The mean and variance of the OLS estimators
HYPOTHESIS TESTING II TESTS ON MEANS. Sorana D. Bolboacă
 HYPOTHESIS TESTING II TESTS ON MEANS Sorana D. Bolboacă OBJECTIVES Significance value vs p value Parametric vs non parametric tests Tests on means: 1 Dec 14 2 SIGNIFICANCE LEVEL VS. p VALUE Materials and
CHAPTER 17 CHI-SQUARE AND OTHER NONPARAMETRIC TESTS FROM: PAGANO, R. R. (2007)
") FROM: PAGANO, R. R. (007) I. INTRODUCTION: DISTINCTION BETWEEN PARAMETRIC AND NON-PARAMETRIC TESTS Statistical inference tests are often classified as to whether they are parametric or nonparametric Parameter
FROM: PAGANO, R. R. (007) I. INTRODUCTION: DISTINCTION BETWEEN PARAMETRIC AND NON-PARAMETRIC TESTS Statistical inference tests are often classified as to whether they are parametric or nonparametric Parameter
10.1. Comparing Two Proportions. Section 10.1
 /6/04 0. Comparing Two Proportions Sectio0. Comparing Two Proportions After this section, you should be able to DETERMINE whether the conditions for performing inference are met. CONSTRUCT and INTERPRET
Ch. 17. DETERMINATION OF SAMPLE SIZE
 LOGO Ch. 17. DETERMINATION OF SAMPLE SIZE Dr. Werner R. Murhadi www.wernermurhadi.wordpress.com Descriptive and Inferential Statistics descriptive statistics is Statistics which summarize and describe
DATA IN SERIES AND TIME I. Several different techniques depending on data and what one wants to do
 DATA IN SERIES AND TIME I Several different techniques depending on data and what one wants to do Data can be a series of events scaled to time or not scaled to time (scaled to space or just occurrence)
Summary: the confidence interval for the mean (σ 2 known) with gaussian assumption
 with gaussian assumption") Summary: the confidence interval for the mean (σ known) with gaussian assumption on X Let X be a Gaussian r.v. with mean µ and variance σ. If X 1, X,..., X n is a random sample drawn from X then the confidence
Summary: the confidence interval for the mean (σ known) with gaussian assumption on X Let X be a Gaussian r.v. with mean µ and variance σ. If X 1, X,..., X n is a random sample drawn from X then the confidence
Chapter 4. Regression Models. Learning Objectives
 Chapter 4 Regression Models To accompany Quantitative Analysis for Management, Eleventh Edition, by Render, Stair, and Hanna Power Point slides created by Brian Peterson Learning Objectives After completing
Chapter 8 Heteroskedasticity
 Chapter 8 Walter R. Paczkowski Rutgers University Page 1 Chapter Contents 8.1 The Nature of 8. Detecting 8.3 -Consistent Standard Errors 8.4 Generalized Least Squares: Known Form of Variance 8.5 Generalized
Chapter 6 Estimation and Sample Sizes
 Chapter 6 Estimation and Sample Sizes This chapter presents the beginning of inferential statistics.! The two major applications of inferential statistics! Estimate the value of a population parameter!
Note on Bivariate Regression: Connecting Practice and Theory. Konstantin Kashin
 Note on Bivariate Regression: Connecting Practice and Theory Konstantin Kashin Fall 2012 1 This note will explain - in less theoretical terms - the basics of a bivariate linear regression, including testing
Hypothesis testing. Data to decisions
 Hypothesis testing Data to decisions The idea Null hypothesis: H 0 : the DGP/population has property P Under the null, a sample statistic has a known distribution If, under that that distribution, the