Analyses of Variance. Block 2b
|
|
|
- Eustacia Little
- 5 years ago
- Views:
Transcription


1 Analyses of Variance Block 2b
2 Types of analyses 1 way ANOVA For more than 2 levels of a factor between subjects ANCOVA For continuous co-varying factor, between subjects ANOVA for factorial design Multiple factors and between subjects. Repeated measures ANOVA Multiple factors and within subjects Contrasts and Post-hocs
3 ANOVA Analysis of Variance Similar to t-test in that it also calculates a Signal-to-noise ratio, F. Signal = variance between conditions Noise = variance within conditions Can analyze more than 2 levels of a factor. Can analyze more than 1 factor. Can reveal interactions between factors.
4 Types of effects Each factor in your analysis can reveal a main effect. This is the effect of a variable averaged over all values of another variable. Within factor comparisons can also reveal simple effects, the effect of an IV in only one level of an another IV. Between factor comparison can reveal interactions, when the effect of one IV depends on the level of another IV.
5 Main effects and interactions Let s assume we have 2 factors with 2 levels each that we manipulated in an experiment: Factor one: lexical frequency of words (high frequency and low frequency) Factor two: word length (long words and short words) We measured reaction times for a naming task. In an ANOVA we can potentially find 2 main effects and an interaction
6 Main effects and interactions Main effect of word length (long words 350 ms, short words 250 ms) No main effect of frequency (high frequency 300 ms, low frequency 300 ms) Interaction between word length and frequency (i.e., frequency has a different influence on long words and short words) high frequency low frequency short words long words
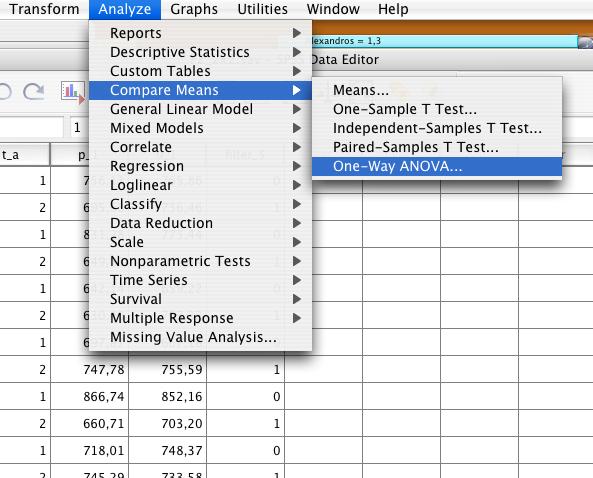
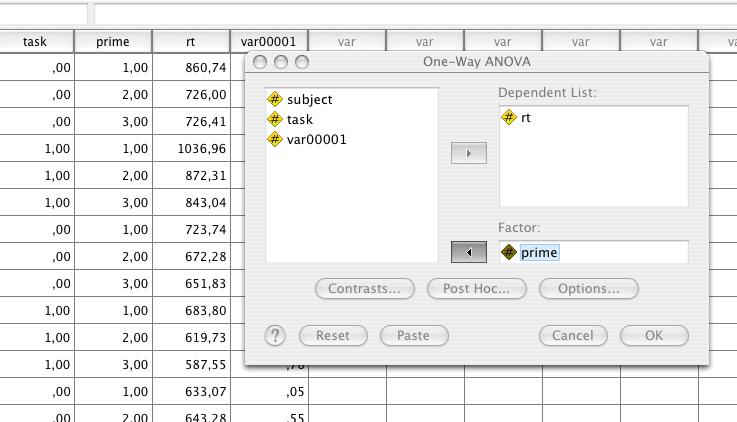
7 1-way ANOVA Analogue to independent groups t-test for 3 or more levels of one factor. A 1-way anova with 2 levels is equivalent to a t- test. P-values the same: F=t 2 Data must be in two columns One for DV and one to code levels of IV. This analysis is found under compare means Non-parametric = k-independent samples

8 Task & prime Are IV s and Grouping variables RT is DV Var00001 is covariate
9
10 options
11 Options Descriptives: means, standard deviations, etc. Estimates of Effect Size: eta-squared larger = better Observed power: 1-β Homogeneity tests: Levene s test
12 One way Anova F (2, 141) = 8.97, p <.001
13 ANCOVA Analysis of Covariance If you have a continuous variable that was not manipulated but that might add variance, like word frequency, subject age, years of programming experience, sentence length, ect you can factor out the variance attributed to this covariate. This removes the error variance and makes a large ratio more likely.

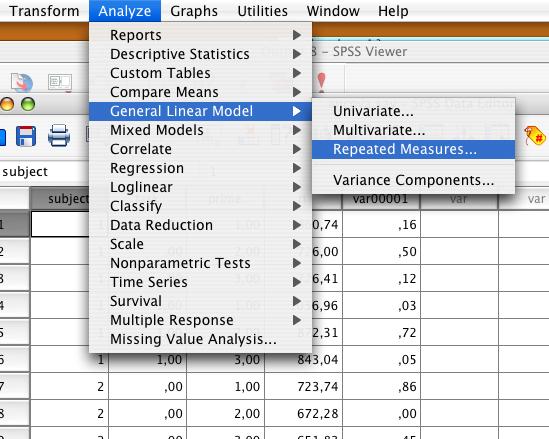
14 Univariate can be used if you only have 1 dependent measure. Multivariate is used if you have multiple dependent measures

15 Dependent measure Independent variables covariates Options and plots
16 Factorial ANOVA When you have more than one IV but the analysis remains between subjects, you can use the univariate interface for the analysis. This analysis allows you to test the main effect of each independent variable but also the interaction between the variables.
17 F (2, 137) = 9,76 p <.001 Df for factor Df for Error Main effect of Prime Main effect of Task Effect of covariate Interaction of two factors
18 Same analysis without covariate Old prime F = 9.76 Old task F = 2.09 Old interaction =.028
19 Interactions Interactions indicate that independent variable X influences the dependent variable differently depending on the level of independent variable Y. Interpret your main effects with the consideration of the interaction. You can have an interaction with no main effects.
20 Repeated measures design Within subjects Data must be entered into separate columns for each condition in the experiment. No coding variable needed. This analysis is appropriate for data from just 1 IV or multiple IVs and for mixed designs.

21 Each column is a different condition; no grouping variable
22

23

24 between factors here Covariates here You move the columns in the correct order to the right. Numbers represent levels of conditions, like + and -. Make sure you map correctly!!!

25 Using the plot option button, you can ask for graphs of the data.
26
27

28 1 factor with 4 levels
29 This analysis shows that we have a significant effect of our IV, but which levels are significantly different from other levels? Look at the graph. The analysis doesn t tell us if 1 > 2 or 1 < 4. For that, we have to do either contrasts or paired comparisons.
30
31
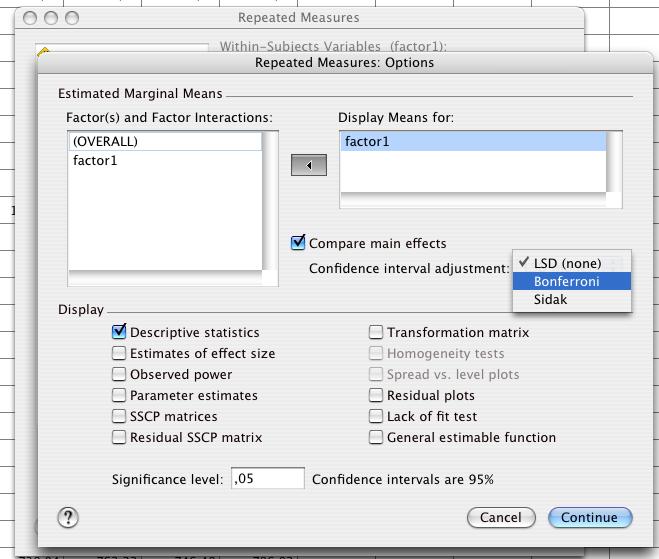
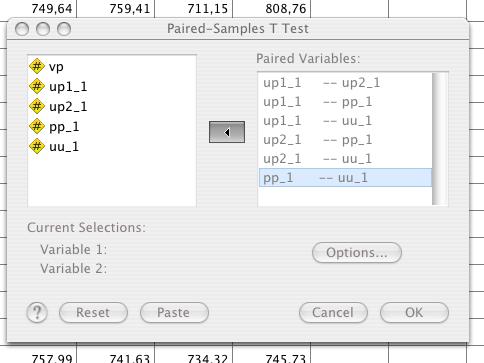
32 Pairwise comparisons Similar in principle to running multiple t- tests on all combinations of conditions. Under the options window if you want all comparisions. chose the comparisons that are interesting to you and run t-tests. Then correct alpha based on number of t- tests performed. (e.g.,.05/x, x=# of tests)).
33
34 I conducted 6 tests, so.05/6 = of my tests are still significant.
35 Summary If you have 1 factor with K levels all between subjects: 1-way ANOVA If you have a covarying factor and a between subjects manipulated factor, use univariate ANOVA If you have more than one between subjects factor and they are factorially related, use univariate ANOVA If you have repeated measures design, with 1 or more manipulated factors, with or without a covariate or an additional between subjects factor, use Repeated Measures
Repeated-Measures ANOVA in SPSS Correct data formatting for a repeated-measures ANOVA in SPSS involves having a single line of data for each
 Repeated-Measures ANOVA in SPSS Correct data formatting for a repeated-measures ANOVA in SPSS involves having a single line of data for each participant, with the repeated measures entered as separate
Prepared by: Prof. Dr Bahaman Abu Samah Department of Professional Development and Continuing Education Faculty of Educational Studies Universiti
 Prepared by: Prof. Dr Bahaman Abu Samah Department of Professional Development and Continuing Education Faculty of Educational Studies Universiti Putra Malaysia Serdang Use in experiment, quasi-experiment
ANCOVA. Lecture 9 Andrew Ainsworth
 ANCOVA Lecture 9 Andrew Ainsworth What is ANCOVA? Analysis of covariance an extension of ANOVA in which main effects and interactions are assessed on DV scores after the DV has been adjusted for by the
Workshop Research Methods and Statistical Analysis
 Workshop Research Methods and Statistical Analysis Session 2 Data Analysis Sandra Poeschl 08.04.2013 Page 1 Research process Research Question State of Research / Theoretical Background Design Data Collection
MANOVA is an extension of the univariate ANOVA as it involves more than one Dependent Variable (DV). The following are assumptions for using MANOVA:
. The following are assumptions for using MANOVA:") MULTIVARIATE ANALYSIS OF VARIANCE MANOVA is an extension of the univariate ANOVA as it involves more than one Dependent Variable (DV). The following are assumptions for using MANOVA: 1. Cell sizes : o
MULTIVARIATE ANALYSIS OF VARIANCE MANOVA is an extension of the univariate ANOVA as it involves more than one Dependent Variable (DV). The following are assumptions for using MANOVA: 1. Cell sizes : o
Factorial Independent Samples ANOVA
 Factorial Independent Samples ANOVA Liljenquist, Zhong and Galinsky (2010) found that people were more charitable when they were in a clean smelling room than in a neutral smelling room. Based on that
Neuendorf MANOVA /MANCOVA. Model: MAIN EFFECTS: X1 (Factor A) X2 (Factor B) INTERACTIONS : X1 x X2 (A x B Interaction) Y4. Like ANOVA/ANCOVA:
 X2 (Factor B) INTERACTIONS : X1 x X2 (A x B Interaction) Y4. Like ANOVA/ANCOVA:") 1 Neuendorf MANOVA /MANCOVA Model: MAIN EFFECTS: X1 (Factor A) X2 (Factor B) Y1 Y2 INTERACTIONS : Y3 X1 x X2 (A x B Interaction) Y4 Like ANOVA/ANCOVA: 1. Assumes equal variance (equal covariance matrices)
1 Neuendorf MANOVA /MANCOVA Model: MAIN EFFECTS: X1 (Factor A) X2 (Factor B) Y1 Y2 INTERACTIONS : Y3 X1 x X2 (A x B Interaction) Y4 Like ANOVA/ANCOVA: 1. Assumes equal variance (equal covariance matrices)
Neuendorf MANOVA /MANCOVA. Model: X1 (Factor A) X2 (Factor B) X1 x X2 (Interaction) Y4. Like ANOVA/ANCOVA:
 X2 (Factor B) X1 x X2 (Interaction) Y4. Like ANOVA/ANCOVA:") 1 Neuendorf MANOVA /MANCOVA Model: X1 (Factor A) X2 (Factor B) X1 x X2 (Interaction) Y1 Y2 Y3 Y4 Like ANOVA/ANCOVA: 1. Assumes equal variance (equal covariance matrices) across cells (groups defined by
1 Neuendorf MANOVA /MANCOVA Model: X1 (Factor A) X2 (Factor B) X1 x X2 (Interaction) Y1 Y2 Y3 Y4 Like ANOVA/ANCOVA: 1. Assumes equal variance (equal covariance matrices) across cells (groups defined by
Analysis of Variance (ANOVA)
") Analysis of Variance (ANOVA) Two types of ANOVA tests: Independent measures and Repeated measures Comparing 2 means: X 1 = 20 t - test X 2 = 30 How can we Compare 3 means?: X 1 = 20 X 2 = 30 X 3 = 35 ANOVA
Analysis of Variance (ANOVA) Two types of ANOVA tests: Independent measures and Repeated measures Comparing 2 means: X 1 = 20 t - test X 2 = 30 How can we Compare 3 means?: X 1 = 20 X 2 = 30 X 3 = 35 ANOVA
Comparing Several Means: ANOVA
 Comparing Several Means: ANOVA Understand the basic principles of ANOVA Why it is done? What it tells us? Theory of one way independent ANOVA Following up an ANOVA: Planned contrasts/comparisons Choosing
Independent Samples ANOVA
 Independent Samples ANOVA In this example students were randomly assigned to one of three mnemonics (techniques for improving memory) rehearsal (the control group; simply repeat the words), visual imagery
M A N O V A. Multivariate ANOVA. Data
 M A N O V A Multivariate ANOVA V. Čekanavičius, G. Murauskas 1 Data k groups; Each respondent has m measurements; Observations are from the multivariate normal distribution. No outliers. Covariance matrices
Repeated Measures Analysis of Variance
 Repeated Measures Analysis of Variance Review Univariate Analysis of Variance Group A Group B Group C Repeated Measures Analysis of Variance Condition A Condition B Condition C Repeated Measures Analysis
One-way between-subjects ANOVA. Comparing three or more independent means
 One-way between-subjects ANOVA Comparing three or more independent means Data files SpiderBG.sav Attractiveness.sav Homework: sourcesofself-esteem.sav ANOVA: A Framework Understand the basic principles
Two-Way ANOVA. Chapter 15
 Two-Way ANOVA Chapter 15 Interaction Defined An interaction is present when the effects of one IV depend upon a second IV Interaction effect : The effect of each IV across the levels of the other IV When
(Same) and 2) students who
 and 2) students who") 2-Group ANCOVA The purpose of the study was to compare the Test Performance of: 1) students who had prepared for the test using practice problems that were similar in difficulty to the actual test problems
2-Group ANCOVA The purpose of the study was to compare the Test Performance of: 1) students who had prepared for the test using practice problems that were similar in difficulty to the actual test problems
610 - R1A "Make friends" with your data Psychology 610, University of Wisconsin-Madison
 610 - R1A "Make friends" with your data Psychology 610, University of Wisconsin-Madison Prof Colleen F. Moore Note: The metaphor of making friends with your data was used by Tukey in some of his writings.
Formula for the t-test
 Formula for the t-test: How the t-test Relates to the Distribution of the Data for the Groups Formula for the t-test: Formula for the Standard Error of the Difference Between the Means Formula for the
Analysis of Variance: Repeated measures
 Repeated-Measures ANOVA: Analysis of Variance: Repeated measures Each subject participates in all conditions in the experiment (which is why it is called repeated measures). A repeated-measures ANOVA is
13: Additional ANOVA Topics
 13: Additional ANOVA Topics Post hoc comparisons Least squared difference The multiple comparisons problem Bonferroni ANOVA assumptions Assessing equal variance When assumptions are severely violated Kruskal-Wallis
STATISTICAL ANALYSIS. Repeated Measures and (M)ANOVA designs
ANOVA designs") STATISTICAL ANALYSIS Repeated Measures and (M)ANOVA designs Why repeated measures? What is the greatest source of variance in a (psycholinguistic response time) experiment? Why repeated measures? What
STATISTICAL ANALYSIS Repeated Measures and (M)ANOVA designs Why repeated measures? What is the greatest source of variance in a (psycholinguistic response time) experiment? Why repeated measures? What
DESIGNING EXPERIMENTS AND ANALYZING DATA A Model Comparison Perspective
 DESIGNING EXPERIMENTS AND ANALYZING DATA A Model Comparison Perspective Second Edition Scott E. Maxwell Uniuersity of Notre Dame Harold D. Delaney Uniuersity of New Mexico J,t{,.?; LAWRENCE ERLBAUM ASSOCIATES,
One-way between-subjects ANOVA. Comparing three or more independent means
 One-way between-subjects ANOVA Comparing three or more independent means ANOVA: A Framework Understand the basic principles of ANOVA Why it is done? What it tells us? Theory of one-way between-subjects
An Old Research Question
 ANOVA An Old Research Question The impact of TV on high-school grade Watch or not watch Two groups The impact of TV hours on high-school grade Exactly how much TV watching would make difference Multiple
Multiple t Tests. Introduction to Analysis of Variance. Experiments with More than 2 Conditions
 Introduction to Analysis of Variance 1 Experiments with More than 2 Conditions Often the research that psychologists perform has more conditions than just the control and experimental conditions You might
MANOVA MANOVA,$/,,# ANOVA ##$%'*!# 1. $!;' *$,$!;' (''
 14 3! "#!$%# $# $&'('$)!! (Analysis of Variance : ANOVA) *& & "#!# +, ANOVA -& $ $ (+,$ ''$) *$#'$)!!#! (Multivariate Analysis of Variance : MANOVA).*& ANOVA *+,'$)$/*! $#/#-, $(,!0'%1)!', #($!#$ # *&,
Introduction to Analysis of Variance. Chapter 11
 Introduction to Analysis of Variance Chapter 11 Review t-tests Single-sample t-test Independent samples t-test Related or paired-samples t-test s m M t ) ( 1 1 ) ( m m s M M t M D D D s M t n s s M 1 )
Introduction to inferential statistics. Alissa Melinger IGK summer school 2006 Edinburgh
 Introduction to inferential statistics Alissa Melinger IGK summer school 2006 Edinburgh Short description Prereqs: I assume no prior knowledge of stats This half day tutorial on statistical analysis will
COMPARING SEVERAL MEANS: ANOVA
 LAST UPDATED: November 15, 2012 COMPARING SEVERAL MEANS: ANOVA Objectives 2 Basic principles of ANOVA Equations underlying one-way ANOVA Doing a one-way ANOVA in R Following up an ANOVA: Planned contrasts/comparisons
Using the GLM Procedure in SPSS
 Using the GLM Procedure in SPSS Alan Taylor, Department of Psychology Macquarie University 2002-2011 Macquarie University 2002-2011 Contents i Introduction 1 1. General 3 1.1 Factors and Covariates 3
ANCOVA. Psy 420 Andrew Ainsworth
 ANCOVA Psy 420 Andrew Ainsworth What is ANCOVA? Analysis of covariance an extension of ANOVA in which main effects and interactions are assessed on DV scores after the DV has been adjusted for by the DV
Hypothesis testing, part 2. With some material from Howard Seltman, Blase Ur, Bilge Mutlu, Vibha Sazawal
 Hypothesis testing, part 2 With some material from Howard Seltman, Blase Ur, Bilge Mutlu, Vibha Sazawal 1 CATEGORICAL IV, NUMERIC DV 2 Independent samples, one IV # Conditions Normal/Parametric Non-parametric
Using SPSS for One Way Analysis of Variance
 Using SPSS for One Way Analysis of Variance This tutorial will show you how to use SPSS version 12 to perform a one-way, between- subjects analysis of variance and related post-hoc tests. This tutorial
Difference in two or more average scores in different groups
 ANOVAs Analysis of Variance (ANOVA) Difference in two or more average scores in different groups Each participant tested once Same outcome tested in each group Simplest is one-way ANOVA (one variable as
Neuendorf MANOVA /MANCOVA. Model: X1 (Factor A) X2 (Factor B) X1 x X2 (Interaction) Y4. Like ANOVA/ANCOVA:
 X2 (Factor B) X1 x X2 (Interaction) Y4. Like ANOVA/ANCOVA:") 1 Neuendorf MANOVA /MANCOVA Model: X1 (Factor A) X2 (Factor B) X1 x X2 (Interaction) Y1 Y2 Y3 Y4 Like ANOVA/ANCOVA: 1. Assumes equal variance (equal covariance matrices) across cells (groups defined by
1 Neuendorf MANOVA /MANCOVA Model: X1 (Factor A) X2 (Factor B) X1 x X2 (Interaction) Y1 Y2 Y3 Y4 Like ANOVA/ANCOVA: 1. Assumes equal variance (equal covariance matrices) across cells (groups defined by
Descriptive Statistics
 *following creates z scores for the ydacl statedp traitdp and rads vars. *specifically adding the /SAVE subcommand to descriptives will create z. *scores for whatever variables are in the command. DESCRIPTIVES
DISCOVERING STATISTICS USING R
 DISCOVERING STATISTICS USING R ANDY FIELD I JEREMY MILES I ZOE FIELD Los Angeles London New Delhi Singapore j Washington DC CONTENTS Preface How to use this book Acknowledgements Dedication Symbols used
Extensions of One-Way ANOVA.
 Extensions of One-Way ANOVA http://www.pelagicos.net/classes_biometry_fa18.htm What do I want You to Know What are two main limitations of ANOVA? What two approaches can follow a significant ANOVA? How
Extensions of One-Way ANOVA.
 Extensions of One-Way ANOVA http://www.pelagicos.net/classes_biometry_fa17.htm What do I want You to Know What are two main limitations of ANOVA? What two approaches can follow a significant ANOVA? How
Three Factor Completely Randomized Design with One Continuous Factor: Using SPSS GLM UNIVARIATE R. C. Gardner Department of Psychology
 Data_Analysis.calm Three Factor Completely Randomized Design with One Continuous Factor: Using SPSS GLM UNIVARIATE R. C. Gardner Department of Psychology This article considers a three factor completely
ANALYTICAL COMPARISONS AMONG TREATMENT MEANS (CHAPTER 4)
") ANALYTICAL COMPARISONS AMONG TREATMENT MEANS (CHAPTER 4) ERSH 8310 Fall 2007 September 11, 2007 Today s Class The need for analytic comparisons. Planned comparisons. Comparisons among treatment means.
ANALYTICAL COMPARISONS AMONG TREATMENT MEANS (CHAPTER 4) ERSH 8310 Fall 2007 September 11, 2007 Today s Class The need for analytic comparisons. Planned comparisons. Comparisons among treatment means.
Longitudinal Data Analysis of Health Outcomes
 Longitudinal Data Analysis of Health Outcomes Longitudinal Data Analysis Workshop Running Example: Days 2 and 3 University of Georgia: Institute for Interdisciplinary Research in Education and Human Development
Data Analysis as a Decision Making Process
 Data Analysis as a Decision Making Process I. Levels of Measurement A. NOIR - Nominal Categories with names - Ordinal Categories with names and a logical order - Intervals Numerical Scale with logically
PLS205 KEY Winter Homework Topic 3. The following represents one way to program SAS for this question:
 PL05 KEY Winter 05 Homework Topic 3 Answers to Question [30 points] The following represents one way to program A for this question: Data Weeds; Input Cover $ Biomass; Cards; 66 634 63 63 633 645 69 63
1 DV is normally distributed in the population for each level of the within-subjects factor 2 The population variances of the difference scores
 One-way Prepared by: Prof. Dr Bahaman Abu Samah Department of Professional Development and Continuing Education Faculty of Educational Studies Universiti Putra Malaysia Serdang The purpose is to test the
STAT 328 (Statistical Packages)
") Department of Statistics and Operations Research College of Science King Saud University Exercises STAT 328 (Statistical Packages) nashmiah r.alshammari ^-^ Excel and Minitab - 1 - Write the commands of
Department of Statistics and Operations Research College of Science King Saud University Exercises STAT 328 (Statistical Packages) nashmiah r.alshammari ^-^ Excel and Minitab - 1 - Write the commands of
ANOVA Analysis of Variance
 ANOVA Analysis of Variance ANOVA Analysis of Variance Extends independent samples t test ANOVA Analysis of Variance Extends independent samples t test Compares the means of groups of independent observations
SPSS Guide For MMI 409
 SPSS Guide For MMI 409 by John Wong March 2012 Preface Hopefully, this document can provide some guidance to MMI 409 students on how to use SPSS to solve many of the problems covered in the D Agostino
1 Introduction to Minitab
 1 Introduction to Minitab Minitab is a statistical analysis software package. The software is freely available to all students and is downloadable through the Technology Tab at my.calpoly.edu. When you
Statistiek II. John Nerbonne. February 26, Dept of Information Science based also on H.Fitz s reworking
 Dept of Information Science j.nerbonne@rug.nl based also on H.Fitz s reworking February 26, 2014 Last week: one-way ANOVA generalized t-test to compare means of more than two groups example: (a) compare
ANCOVA. ANCOVA allows the inclusion of a 3rd source of variation into the F-formula (called the covariate) and changes the F-formula
 and changes the F-formula") ANCOVA Workings of ANOVA & ANCOVA ANCOVA, Semi-Partial correlations, statistical control Using model plotting to think about ANCOVA & Statistical control You know how ANOVA works the total variation among
ANCOVA Workings of ANOVA & ANCOVA ANCOVA, Semi-Partial correlations, statistical control Using model plotting to think about ANCOVA & Statistical control You know how ANOVA works the total variation among
Degrees of freedom df=1. Limitations OR in SPSS LIM: Knowing σ and µ is unlikely in large
 Z Test Comparing a group mean to a hypothesis T test (about 1 mean) T test (about 2 means) Comparing mean to sample mean. Similar means = will have same response to treatment Two unknown means are different
SEVERAL μs AND MEDIANS: MORE ISSUES. Business Statistics
 SEVERAL μs AND MEDIANS: MORE ISSUES Business Statistics CONTENTS Post-hoc analysis ANOVA for 2 groups The equal variances assumption The Kruskal-Wallis test Old exam question Further study POST-HOC ANALYSIS
Introduction to the Analysis of Variance (ANOVA) Computing One-Way Independent Measures (Between Subjects) ANOVAs
 Computing One-Way Independent Measures (Between Subjects) ANOVAs") Introduction to the Analysis of Variance (ANOVA) Computing One-Way Independent Measures (Between Subjects) ANOVAs The Analysis of Variance (ANOVA) The analysis of variance (ANOVA) is a statistical technique
Introduction to the Analysis of Variance (ANOVA) Computing One-Way Independent Measures (Between Subjects) ANOVAs The Analysis of Variance (ANOVA) The analysis of variance (ANOVA) is a statistical technique
psyc3010 lecture 2 factorial between-ps ANOVA I: omnibus tests
 psyc3010 lecture 2 factorial between-ps ANOVA I: omnibus tests last lecture: introduction to factorial designs next lecture: factorial between-ps ANOVA II: (effect sizes and follow-up tests) 1 general
Psy 420 Final Exam Fall 06 Ainsworth. Key Name
 Psy 40 Final Exam Fall 06 Ainsworth Key Name Psy 40 Final A researcher is studying the effect of Yoga, Meditation, Anti-Anxiety Drugs and taking Psy 40 and the anxiety levels of the participants. Twenty
Research Methodology: Tools
 MSc Business Administration Research Methodology: Tools Applied Data Analysis (with SPSS) Lecture 09: Introduction to Analysis of Variance (ANOVA) April 2014 Prof. Dr. Jürg Schwarz Lic. phil. Heidi Bruderer
The independent-means t-test:
 The independent-means t-test: Answers the question: is there a "real" difference between the two conditions in my experiment? Or is the difference due to chance? Previous lecture: (a) Dependent-means t-test:
PLS205 Lab 6 February 13, Laboratory Topic 9
 PLS205 Lab 6 February 13, 2014 Laboratory Topic 9 A word about factorials Specifying interactions among factorial effects in SAS The relationship between factors and treatment Interpreting results of an
BIOMETRICS INFORMATION
 BIOMETRICS INFORMATION Index of Pamphlet Topics (for pamphlets #1 to #60) as of December, 2000 Adjusted R-square ANCOVA: Analysis of Covariance 13: ANCOVA: Analysis of Covariance ANOVA: Analysis of Variance
Analysis of Covariance (ANCOVA) Lecture Notes
 Lecture Notes") 1 Analysis of Covariance (ANCOVA) Lecture Notes Overview: In experimental methods, a central tenet of establishing significant relationships has to do with the notion of random assignment. Random assignment
1 Analysis of Covariance (ANCOVA) Lecture Notes Overview: In experimental methods, a central tenet of establishing significant relationships has to do with the notion of random assignment. Random assignment
Analysis of Variance ANOVA. What We Will Cover in This Section. Situation
 Analysis of Variance ANOVA 8//007 P7 Analysis of Variance What We Will Cover in This Section Introduction. Overview. Simple ANOVA. Repeated Measures ANOVA. Factorial ANOVA 8//007 P7 Analysis of Variance
PSYC 331 STATISTICS FOR PSYCHOLOGISTS
 PSYC 331 STATISTICS FOR PSYCHOLOGISTS Session 4 A PARAMETRIC STATISTICAL TEST FOR MORE THAN TWO POPULATIONS Lecturer: Dr. Paul Narh Doku, Dept of Psychology, UG Contact Information: pndoku@ug.edu.gh College
The One-Way Independent-Samples ANOVA. (For Between-Subjects Designs)
") The One-Way Independent-Samples ANOVA (For Between-Subjects Designs) Computations for the ANOVA In computing the terms required for the F-statistic, we won t explicitly compute any sample variances or
The One-Way Independent-Samples ANOVA (For Between-Subjects Designs) Computations for the ANOVA In computing the terms required for the F-statistic, we won t explicitly compute any sample variances or
Experimental Design and Data Analysis for Biologists
 Experimental Design and Data Analysis for Biologists Gerry P. Quinn Monash University Michael J. Keough University of Melbourne CAMBRIDGE UNIVERSITY PRESS Contents Preface page xv I I Introduction 1 1.1
same hypothesis Assumptions N = subjects K = groups df 1 = between (numerator) df 2 = within (denominator)
 df 2 = within (denominator)") compiled by Janine Lim, EDRM 61, Spring 008 This file is copyrighted (010) and a part of my Leadership Portfolio found at http://www.janinelim.com/leadportfolio. It is shared for your learning use only.
compiled by Janine Lim, EDRM 61, Spring 008 This file is copyrighted (010) and a part of my Leadership Portfolio found at http://www.janinelim.com/leadportfolio. It is shared for your learning use only.
Multiple Comparisons
 Multiple Comparisons Error Rates, A Priori Tests, and Post-Hoc Tests Multiple Comparisons: A Rationale Multiple comparison tests function to tease apart differences between the groups within our IV when
CHAPTER 17 CHI-SQUARE AND OTHER NONPARAMETRIC TESTS FROM: PAGANO, R. R. (2007)
") FROM: PAGANO, R. R. (007) I. INTRODUCTION: DISTINCTION BETWEEN PARAMETRIC AND NON-PARAMETRIC TESTS Statistical inference tests are often classified as to whether they are parametric or nonparametric Parameter
FROM: PAGANO, R. R. (007) I. INTRODUCTION: DISTINCTION BETWEEN PARAMETRIC AND NON-PARAMETRIC TESTS Statistical inference tests are often classified as to whether they are parametric or nonparametric Parameter
Simple, Marginal, and Interaction Effects in General Linear Models: Part 1
 Simple, Marginal, and Interaction Effects in General Linear Models: Part 1 PSYC 943 (930): Fundamentals of Multivariate Modeling Lecture 2: August 24, 2012 PSYC 943: Lecture 2 Today s Class Centering and
Rule of Thumb Think beyond simple ANOVA when a factor is time or dose think ANCOVA.
 May 003: Think beyond simple ANOVA when a factor is time or dose think ANCOVA. Case B: Factorial ANOVA (New Rule, 6.3). A few corrections have been inserted in blue. [At times I encounter information that
General Linear Models. with General Linear Hypothesis Tests and Likelihood Ratio Tests
 General Linear Models with General Linear Hypothesis Tests and Likelihood Ratio Tests 1 Background Linear combinations of Normals are Normal XX nn ~ NN μμ, ΣΣ AAAA ~ NN AAμμ, AAAAAA A sum of squared, standardized
Lecture 6: Single-classification multivariate ANOVA (k-group( MANOVA)
") Lecture 6: Single-classification multivariate ANOVA (k-group( MANOVA) Rationale and MANOVA test statistics underlying principles MANOVA assumptions Univariate ANOVA Planned and unplanned Multivariate ANOVA
Lecture 6: Single-classification multivariate ANOVA (k-group( MANOVA) Rationale and MANOVA test statistics underlying principles MANOVA assumptions Univariate ANOVA Planned and unplanned Multivariate ANOVA
Lecture 11: Two Way Analysis of Variance
 Lecture 11: Two Way Analysis of Variance Review: Hypothesis Testing o ANOVA/F ratio: comparing variances o F = s variance between treatment effect + chance s variance within sampling error (chance effects)
Analysis of Covariance (ANCOVA)
") Analysis of Covariance (ANCOVA) ANOVA can be extended to include one or more continuous variables that predict the outcome (or dependent variable). Continuous variables such as these, that are not part
Analysis of Covariance (ANCOVA) ANOVA can be extended to include one or more continuous variables that predict the outcome (or dependent variable). Continuous variables such as these, that are not part
A Re-Introduction to General Linear Models (GLM)
") A Re-Introduction to General Linear Models (GLM) Today s Class: You do know the GLM Estimation (where the numbers in the output come from): From least squares to restricted maximum likelihood (REML) Reviewing
A Re-Introduction to General Linear Models (GLM) Today s Class: You do know the GLM Estimation (where the numbers in the output come from): From least squares to restricted maximum likelihood (REML) Reviewing
Analysis of Variance (ANOVA)
") Analysis of Variance (ANOVA) Used for comparing or more means an extension of the t test Independent Variable (factor) = categorical (qualita5ve) predictor should have at least levels, but can have many
Analysis of Variance (ANOVA) Used for comparing or more means an extension of the t test Independent Variable (factor) = categorical (qualita5ve) predictor should have at least levels, but can have many
DETAILED CONTENTS PART I INTRODUCTION AND DESCRIPTIVE STATISTICS. 1. Introduction to Statistics
 DETAILED CONTENTS About the Author Preface to the Instructor To the Student How to Use SPSS With This Book PART I INTRODUCTION AND DESCRIPTIVE STATISTICS 1. Introduction to Statistics 1.1 Descriptive and
df=degrees of freedom = n - 1
 One sample t-test test of the mean Assumptions: Independent, random samples Approximately normal distribution (from intro class: σ is unknown, need to calculate and use s (sample standard deviation)) Hypotheses:
From Practical Data Analysis with JMP, Second Edition. Full book available for purchase here. About This Book... xiii About The Author...
 From Practical Data Analysis with JMP, Second Edition. Full book available for purchase here. Contents About This Book... xiii About The Author... xxiii Chapter 1 Getting Started: Data Analysis with JMP...
Hotelling s One- Sample T2
 Chapter 405 Hotelling s One- Sample T2 Introduction The one-sample Hotelling s T2 is the multivariate extension of the common one-sample or paired Student s t-test. In a one-sample t-test, the mean response
Introduction to the Analysis of Variance (ANOVA)
") Introduction to the Analysis of Variance (ANOVA) The Analysis of Variance (ANOVA) The analysis of variance (ANOVA) is a statistical technique for testing for differences between the means of multiple (more
Introduction to the Analysis of Variance (ANOVA) The Analysis of Variance (ANOVA) The analysis of variance (ANOVA) is a statistical technique for testing for differences between the means of multiple (more
PLS205!! Lab 9!! March 6, Topic 13: Covariance Analysis
 PLS205!! Lab 9!! March 6, 2014 Topic 13: Covariance Analysis Covariable as a tool for increasing precision Carrying out a full ANCOVA Testing ANOVA assumptions Happiness! Covariable as a Tool for Increasing
8/04/2011. last lecture: correlation and regression next lecture: standard MR & hierarchical MR (MR = multiple regression)
") psyc3010 lecture 7 analysis of covariance (ANCOVA) last lecture: correlation and regression next lecture: standard MR & hierarchical MR (MR = multiple regression) 1 announcements quiz 2 correlation and
psyc3010 lecture 7 analysis of covariance (ANCOVA) last lecture: correlation and regression next lecture: standard MR & hierarchical MR (MR = multiple regression) 1 announcements quiz 2 correlation and
Mixed- Model Analysis of Variance. Sohad Murrar & Markus Brauer. University of Wisconsin- Madison. Target Word Count: Actual Word Count: 2755
 Mixed- Model Analysis of Variance Sohad Murrar & Markus Brauer University of Wisconsin- Madison The SAGE Encyclopedia of Educational Research, Measurement and Evaluation Target Word Count: 3000 - Actual
CHI SQUARE ANALYSIS 8/18/2011 HYPOTHESIS TESTS SO FAR PARAMETRIC VS. NON-PARAMETRIC
 CHI SQUARE ANALYSIS I N T R O D U C T I O N T O N O N - P A R A M E T R I C A N A L Y S E S HYPOTHESIS TESTS SO FAR We ve discussed One-sample t-test Dependent Sample t-tests Independent Samples t-tests
Factorial designs. Experiments
 Chapter 5: Factorial designs Petter Mostad mostad@chalmers.se Experiments Actively making changes and observing the result, to find causal relationships. Many types of experimental plans Measuring response
One-Way ANOVA Source Table J - 1 SS B / J - 1 MS B /MS W. Pairwise Post-Hoc Comparisons of Means
 One-Way ANOVA Source Table ANOVA MODEL: ij = µ* + α j + ε ij H 0 : µ 1 = µ =... = µ j or H 0 : Σα j = 0 Source Sum of Squares df Mean Squares F Between Groups n j ( j - * ) J - 1 SS B / J - 1 MS B /MS
Chapter 14: Repeated-measures designs
 Chapter 14: Repeated-measures designs Oliver Twisted Please, Sir, can I have some more sphericity? The following article is adapted from: Field, A. P. (1998). A bluffer s guide to sphericity. Newsletter
One-Way ANOVA Cohen Chapter 12 EDUC/PSY 6600
 One-Way ANOVA Cohen Chapter 1 EDUC/PSY 6600 1 It is easy to lie with statistics. It is hard to tell the truth without statistics. -Andrejs Dunkels Motivating examples Dr. Vito randomly assigns 30 individuals
Simple Linear Regression
 Simple Linear Regression 1 Correlation indicates the magnitude and direction of the linear relationship between two variables. Linear Regression: variable Y (criterion) is predicted by variable X (predictor)
Analysis of variance
 Analysis of variance Tron Anders Moger 3.0.007 Comparing more than two groups Up to now we have studied situations with One observation per subject One group Two groups Two or more observations per subject
This module focuses on the logic of ANOVA with special attention given to variance components and the relationship between ANOVA and regression.
 WISE ANOVA and Regression Lab Introduction to the WISE Correlation/Regression and ANOVA Applet This module focuses on the logic of ANOVA with special attention given to variance components and the relationship
Analysis of repeated measurements (KLMED8008)
") Analysis of repeated measurements (KLMED8008) Eirik Skogvoll, MD PhD Professor and Consultant Institute of Circulation and Medical Imaging Dept. of Anaesthesiology and Emergency Medicine 1 Day 2 Practical
Analysis of repeated measurements (KLMED8008) Eirik Skogvoll, MD PhD Professor and Consultant Institute of Circulation and Medical Imaging Dept. of Anaesthesiology and Emergency Medicine 1 Day 2 Practical
My data doesn t look like that..
 Testing assumptions My data doesn t look like that.. We have made a big deal about testing model assumptions each week. Bill Pine Testing assumptions Testing assumptions We have made a big deal about testing
22s:152 Applied Linear Regression. Chapter 8: 1-Way Analysis of Variance (ANOVA) 2-Way Analysis of Variance (ANOVA)
 2-Way Analysis of Variance (ANOVA)") 22s:152 Applied Linear Regression Chapter 8: 1-Way Analysis of Variance (ANOVA) 2-Way Analysis of Variance (ANOVA) We now consider an analysis with only categorical predictors (i.e. all predictors are
22s:152 Applied Linear Regression Chapter 8: 1-Way Analysis of Variance (ANOVA) 2-Way Analysis of Variance (ANOVA) We now consider an analysis with only categorical predictors (i.e. all predictors are
Simple, Marginal, and Interaction Effects in General Linear Models
 Simple, Marginal, and Interaction Effects in General Linear Models PRE 905: Multivariate Analysis Lecture 3 Today s Class Centering and Coding Predictors Interpreting Parameters in the Model for the Means
Review. One-way ANOVA, I. What s coming up. Multiple comparisons
 Review One-way ANOVA, I 9.07 /15/00 Earlier in this class, we talked about twosample z- and t-tests for the difference between two conditions of an independent variable Does a trial drug work better than
Problem Set 2. MAS 622J/1.126J: Pattern Recognition and Analysis. Due: 5:00 p.m. on September 30
 Problem Set 2 MAS 622J/1.126J: Pattern Recognition and Analysis Due: 5:00 p.m. on September 30 [Note: All instructions to plot data or write a program should be carried out using Matlab. In order to maintain
GLM Repeated-measures designs: One within-subjects factor
 GLM Repeated-measures designs: One within-subjects factor Reading: SPSS dvanced Models 9.0: 2. Repeated Measures Homework: Sums of Squares for Within-Subject Effects Download: glm_withn1.sav (Download
STA441: Spring Multiple Regression. This slide show is a free open source document. See the last slide for copyright information.
 STA441: Spring 2018 Multiple Regression This slide show is a free open source document. See the last slide for copyright information. 1 Least Squares Plane 2 Statistical MODEL There are p-1 explanatory