BACKGROUND REPORT: REGIONAL HYDROLOGICAL ASSESSMENT of the PEACE RIVER WATERSHED
|
|
|
- Myles Sims
- 5 years ago
- Views:
Transcription
1 BACKGROUND REPORT: REGIONAL HYDROLOGICAL ASSESSMENT of the PEACE RIVER WATERSHED This background report provided information that was incorporated into the draft State of the Watershed Report for the Peace River. It is presented here in draft format only for the convenience of reviewers. Please note that Figure and Table numbers have not yet been applied. This report will undergo editing and will have consistent formatting applied prior to final submission. Once complete, we expect that it will reside upon the website of the Mighty Peace Watershed Alliance and be available as a resource to support the Peace River State of the Watershed Report.
2 Contents 1.0 Project Overview Scope and Purpose Methodology Setting Peace River Watershed Surficial Geology Bedrock Geology Climate Surface Water Scope and Purpose Historical Stream Flow Record Lake Levels Overland Flow Groundwater Surficial Aquifers Western Basin: Smoky/Wapiti, Upper Peace River and Central Peace River Sub-Basins Eastern Basins: Lower Peace, Wabasca and Slave Sub-Basin Bedrock Aquifers Groundwater Monitoring: Groundwater Quantity Observed Groundwater Level Trends: Aquifer Vulnerability to Surface Contaminants Groundwater Monitoring: Water Quality, Water Chemistry, Trace Metal Suggestions for Groundwater Quality Monitoring: Water Allocation Comments and Suggestions Data Gaps and Suggestions for Future Work Bibliography...97
3 1.0 Project Overview Under Alberta s Water for Life Strategy, Watershed Planning and Advisory Council (WPAC) were established for every major watershed in the province. Formed in 2011, Mighty Peace Watershed Alliance (MPWA) is recognized as the official WPAC for the Peace River Basin. The MPWA is a non-profit organization comprised of multiple stakeholders and communities dedicated to ensure safe, secure drinking water, healthy ecosystems and reliable water quality supply for a sustainable economy. MPWA is in the process to complete the first state of the watershed (SOW) report for the Peace River Watershed. The inaugural state of the watershed report aims to provide a snap shot in time of the current watershed along with historical trends. The purpose of the SOW report is to educate and provide guidance for water management plan in the future. The SOW will draw informations from two separate technical reports: Aquatic Eco-health, and Regional Groundwater Assessment. The technical reports will have a comprehensive analysis of several key indicators, identified by MPWA, of current conditions in the watershed, with their main purpose being evaluation and risk assessment. The MPWA has engaged CharettePellPoscente Environmental Corp (CPP) with the development of first draft of the Peace River Watershed SOW report. 1.1 Scope and Purpose The purpose of the first draft of Regional Groundwater Assessment Report is to address the following indicators within the confine of the Peace River Watershed: Surface Water Quantity Groundwater Quantity Groundwater Quality Risk to Contaminants Water Allocation In the process of assessing the indicators, the aim of this report is to: Educate the reader by providing the necessary information on geologic setting, watershed basins, sources of surface and groundwater sources and water users. Describe how all of the factors above fits into the regional hydrogeological processes. Briefly describe the geology of the watershed, focusing on hydro-stratigraphy (water bearing units, aquifers and aquitards) Identify sources, distribution of aquifers within the watershed Compile yield test, baseline studies and provide basic description of known aquifers
4 Describe groundwater monitoring programs within the watershed both historical and currently active, and present the results of groundwater monitoring programs. Compile historic flow records of streams and rivers. Compile historic water level in lakes within the watershed Explore surface and groundwater interactions and contaminant transport Summarize water allocation within the watershed and comment on future water demands Recommendations for sustainability The scope of Regional Groundwater Assessment is limited to within the confine of the Peace River Basin in Northern Alberta. The scope of this study is the following: The geographic extent of the Peace River Basin is determined based on catchment basins and drainage to the Peace River. Upstream activities in British Columbia are considered, as it directly impacts river flow into the Peace River Watershed Regional groundwater systems are determined by geologic settings, they extend far beyond the boundaries of the Peace River Basin; therefore only groundwater flows within the boundary of the watershed are part of this study. Detailed scientific interpretations, quantifications and trend analysis are beyond the scope of this project. The Regional Groundwater Assessment only aim to provide compilation of findings from past studies and public source documents and data-sets and present the results of current monitoring program. Regulatory framework, stakeholders, monitoring programs in place. List of information gaps and recommendations of area to expand groundwater study in the watershed. There is a general lack of groundwater studies in the Peace River Watershed compared to other basins in Alberta. The Regional Groundwater Assessment will address information gaps and make recommendations on which indicators requires more study and expanding monitoring programs to. Bibliography of all sources used in this study. 1.2 Methodology Format and structure of this study was developed in collaboration by MPWA, CPP Environmental Corp and Ecoterra Solutions Inc.Research for this study primarily comes from compilation of findings from a number of existing studies in geology, hydrogeology, climate, river flow and baseline water quality. Spatial data and maps are either referenced from existing studies, or obtained from the MPWA, Alberta Environment and Sustainable Resources Development (ESRD) and Alberta Geologic Survey (AGS). Majority of the background study on geology, hydrogeology and base line water quality are from the extensive library of Alberta Geologic Survey. Geology of the watershed including
5 interpretation of sequence stratigraphy, lithology and characteristics of individual formations, quaternary depositional environment and ice movements, thickness of glacial drift, surficial geology, and location of bedrock valleys are referenced from AGS. Baseline hydrogeology studies which identified aquifers, yield, and groundwater quality and provided hydrogeological mapping were carried out by AGS and Alberta Research Council. Selected number of groundwater monitoring studies for oil and gas operations was referenced for their baseline results and diagrams on sequence stratigraphy. For this study, the 6 major basins are split into Western and Eastern Basins due to amount of data available and their vastly different settings. The Western Basins include the Smoky/Wapiti, Upper Peace and Central Peace sub-basins. The Eastern Basins refers to Lower Peace, Wabasca and Slave River sub-basin. The majority of existing groundwater studies is specific to the Western Basins. Results from regional groundwater assessment of the Peace River Area completed by Hydrogeological Consultant LTD in 2004 were heavily referenced in the Groundwater section of this report, along with several cross sections and graphs. Comprehensive Water Allocation both historical and current year (2013) in the Peace River Watershed was provided by ESRD. A brief summary of water allocation by sector in 2013 is included in this report. Analyzing trends in water allocation and water demands over the past decade can be useful in providing basis for water management planning, however due to time restraints; the aforementioned study is not included in the current draft report. Results from various active groundwater monitoring programs in the watershed were obtained from ESRD, Alberta Health, Alberta Center of Toxicology, AMEC and Matrix Solution. River flow and lake level records were obtained from ESRD and Environment Canada. A series of studies conducted by Prairie Farm Rehabilitation Authority (PFRA) and Alberta Agriculture on agricultural activities watershed are referenced. It includes various maps on agricultural density, aquifer vulnerability, livestock density etc.

6 2.0 Setting 2.1 Peace River Watershed The Peace River watershed originated from the headwater of the Peace River at the confluence of Finlay and Parsnip Rivers in the Rocky Mountains of northern British Columbia.
7 With the construction of W.A.C. Bennett Dam in 1968, the headwater of the Peace River has been altered to Williston Reservoir located near the BC/Alberta border. The extend of the Peace River watershed in BC and Alberta drains an area of roughly 326,000 km², with 60% of the watershed located in northern Alberta. [Hatfield Consultants, 2009] As the largest watershed in Alberta covering almost 30% of the province, the Peace River watershed is also the most diverse in topography, geology, climate and natural regions. Diverse landscapes of the watershed ranges from the Rocky Mountain and Foothills in the southwest to Boreal Subarctic and Peace-Athabasca Delta in the northeast. Topography varies from over 2000m above mean seal level (AMSL) in the southwest to 15m AMSL in the Peace Athabasca Delta. There are 5 major tributaries to the Peace River and 6 major sub-basins in the Peace River watershed. Major tributaries to the Peace River include the Wapiti River, Smoky River, Little Smoky River, Notikiwen River and the Wabasca River, with Smoky River being largest tributary, adding approximately 11,000,000,000 m³ of flow annually. 6 major sub-basins that drain into the major rivers in the watershed include the Smoky/Wapiti, Upper Peace, Central Peace, Lower Peace, Wabasca and Slave River Basin.
. During the Pleistocene epoch (2.58 Ma- 0.")
8 2.2 Surficial Geology The majority of recent surficial sediment across Northern Alberta is deposits formed by or in association with the continental glaciation processes of the Quaternary period (2.58Ma present). During the Pleistocene epoch (2.58 Ma- 0.01Ma, first epoch of Quaternary), episodic advancement and retreat of the Laurentide Ice Sheet deposited the majority of surficial sediment covering Alberta today. These deposits include till (glacial diamicton), glaciofluvial sediments, and glaciolacustrine sediments. The quintessential sediment in glacial dominated depositional environments is till, consisting of clay, silt, sand, gravel, cobbles, and boulders in a poorly sorted, heterogeneous arrangement. Knowing the paleo-depositional environment is key to understanding the hydrogeological properties of the sediment. Figure 1. Schematic diagram of aquifer occurrence in glaciated regions. [Freeze&Cherry, 1979] Glaciofluvial deposits are formed by melt-water channels transporting sediments to be deposited during episodes of glacial retreat. Transported sediments are typically poorly sorted and found in the outwash plain after the glacier has retreated. The meltwater channels are then back-filled by sediments to form buried channels, then subsequently buried under more till as the ice re-advances. In addition to the classical types of sediment deposited by rivers of meltwater flowing beyond the margin of glaciers, many glaciated area have deposits of sand and gravel that have formed on top of masses of stagnant ice during episodes of glacial retreat. These deposits are known as collapsed outwash, stagnant outwash, or ice-contact deposits [Freeze & Cherry, 1979]. The hydrogeological significance of glaciofluvial deposits is due to highly permeable nature of the materials, making them ideal substrates for aquifer systems. In northern Alberta, most surficial aquifers are composed of glaciofluvial deposits, either in isolated pockets or buried channels. The deepest surficial aquifers can be found in buried thalwegs, bedrock valleys, at the bottom of the glacial drift.

9 Glaciolacustrine deposits formed in pre-glacial meltwater lakes. These are generally low energy depositional environment typically dominated by fine grained silt and clay. Fine-grained glacial till and deposits of glaciolacustrine silt and clay are the most common substrate forming aquitards in northern Alberta. In many cases, extensive deposits of clay-rich till or glaciolacustrine clay can cause isolation of buried aquifers from zones of near-surface groundwater flow [Freeze&Cherry, 1979]. Figure 2. Surficial Sediment Thickness where [Alberta Geologic Survey, 1998] Surficial sediment thickness (drift thickness) refers to the thickness of the glacial deposit (till) layers above bedrock, and varies between the western and eastern basins. The drift thickness in the western basins, which includes the Smoky/Wapiti, Upper Peace, and Central Peace River Subbasins, are typically no more than 100m thick. Exceptions are present in areas where buried bedrock valleys are present. These areas include the eastwest trending High Prairie and Shaftsbury buried valleys. Buried bedrock valleys are carved by paleo-river channels, most of which are associated with fluvial and lacustrine deposits in linear bedrock lows. The eastern basins, which include the Wabasca, Lower Peace, and Slave River Sub-Basins, have drift thickness ranging from 100m to 250m thick at Birch Mountain. In reference to the regional groundwater assessment, the hydrogeological properties of surficial deposits in the Peace River Watershed can be classified into 1 of 3 hydro-stratigraphic units. The first unit is fully saturated sand and gravel aquifers located throughout surficial deposits. These deposits can extend from the top of the bedrock to the ground surface. In lower surficial deposits, they form regional groundwater networks. Because the majority of the surficial deposits across northern Alberta are of glacial origin, deposits of hydrogeological importance in the drift belongs to either buried channel deposits or the large glacial-fluvial sand and gravel deposits that exist as disconnected pockets across the watershed. The origin of the Grimmshaw Gravel, an important aquifer in the Upper Peace River Basin, is an example of the glaciofluvial depositional process. Paleo-meltwater channels carried sediments out of the ice sheets and deposited sand and gravel into river terraces during de-glaciation which was subsequently buried to form the Grimmshaw Gravel. This process deposited the majority of sand and gravel in the Peace River Watershed. The aquifer forming potential of major sand and gravel deposits and buried channels identified within the watershed will be examined in Section 4. A detailed study of the distribution, thickness, and lateral extent of sand and gravel in surficial deposits has been provided by Hydrogeological Consultants Ltd., covering the majority of the western basins, including the Smoky/Wapiti, Upper Peace River and Central Peace River Sub- Basins.
10 The second hydro-stratigraphic unit is aquitard/aquiclude, which consists of surficial deposits with low permeability. The majority of surficial deposits in the Peace River Watershed are made up of till which was compacted by the weight of the Laurentide glacier during past glaciation episodes present day surficial geology to be dominated by glacier formed landscape structures such as drumlins, fluting moraines, and outwash plains.. As grain size decreases and compaction increases, the result is low hydraulic conductivity. Where fine grained silt and clay dominates the lithology of the deposit, hydraulic conductivity of the deposit will be very low and becomes hydrologically impermeable, classified as aquitards. It can take tens of thousands of years for groundwater to travel through a silt and clay layer. In the Peace River Watershed, large silt and clay deposits are most commonly associated with glaciolacustrine depositional environments. Although most of the surficial deposits in the watershed are till, some ice contact deposits and moraine deposits are relatively permeable. However, only loosely consolidated, coarse grained sand and gravel deposits are considered economically viable aquifers in the watershed. The third hydro-stratigraphic unit is the mixture of partially and variably saturated zones in the upper surficial deposit. This unit extends from just below the groundwater table to the ground surface, including both the uppermost surficial deposits and the top soil. Below the groundwater table, surficial units are fully saturated. The groundwater table can fluctuate depending on the changing hydrogeological conditions, increasing or Figure 3. Thickness of Sand and Gravel in Drift (m), Western reducing the thickness of the partially Basins [HCL, 2004] saturated layer. Rate of infiltration to water table is influenced by the lithology of the partially saturated units above. Sand and gravel deposits near the surface and outcrops lead to greater potential for groundwater recharge. However, high rate of infiltration also increase the chances of surface contaminants reaching the groundwater table.. Within the Watershed, post-quaternary surficial deposits are generally only present to no more than 1 to 2m below the surface, except along the steep valleys of major rivers where post- Quaternary fluvial terraces are present. The majority of these deposits are either organic, colluvial, fluvial, or lacustrine, mixed with minor eolian wind deposits. Often hydrologically connected to surface water bodies, these deposits are of negligible hydrogeological importance to aquifers compared to deposits of glacial origin. In the Peace River Watershed, major rivers such as Peace, Smoky, Wapiti, Notikiwen and Wabasca Rivers all have deeply incised river

11 valleys. Slump features caused by erosional force of modern river channels lead to formation of colluvial deposits or colluvium. Sand and gravel sediment carried by the river can be deposited throughout the river valley, forming fluvial terraces. These deposits are highly hydraulically connected to the river and are capable of forming aquifers. However, the reliability of long term yields is unpredictable as evidenced by the several failed wells completed in the Wapiti terraces at Grand Prairie in the late 1960 s, when initial testing had thought the location to be economically feasible. Other non-glacial alluvial deposits in the watershed can be associated with modern day rivers and lakes; the most common being alluvial plains which make up the uppermost portion of surficial deposits. 2.3 Bedrock Geology The Peace River Watershed is located inside the Western Canada Sedimentary Basin. Bedrock geology at the western boundary of the watershed is characterized by the Peace River Arch as well as a series of isoclinal folds associated with the Alberta Syncline. On the eastern side of the watershed, sedimentary succession characteristic of Western Canada Sedimentary Basins extends all the way to the Canadian Shield. The uppermost bedrock formations in the watershed are the upper and lower Cretaceous groups, unconformably underlying Quaternary surficial overburden. The formations of the upper and lower Cretaceous period are characterized by a series of marine and non-marine sandstones, shale and siltstones. In Figure 4. Major Structural Geology Features, Alberta Geologic Survey, 1998 general, the dip direction of the strata is toward southwest in the Alberta Syncline at the western boundary of the watershed, and thickens toward southwest.


12 Stratigraphic sequences of Cretaceous formations and their lithology within the watershed have been identified by the Alberta Geological Survey (AGS). Stratigraphic columns illustrate vertical succession and relative thickness of each formation. In the western basins, cross sections have been generated, to show depth and true thickness of the upper bedrocks formations. Figure 5 is bedrock cross in the western Figure 5. Upper Bedrock Cross Sections of Western Basins. [HCL, 2004] part of the watershed, shows a general succession of the upper Cretaceous formations in the eastern limb of the Alberta Syncline. In the Western Basins, the majority of Cretaceous strata belong to 1 of 2 groups: the lower Cretaceous (older) Fort St. John Group, and the upper Cretaceous Smoky Group. The uppermost bedrock formations in the western basins include parts of the Horseshoe Canyon, the Oldman, the Foremost, the Lea Park, the Milk River, the Colorado, the Cardium, the Kaskapau, the Dunvegan, the Shaftsbury, the Peace River formations and the Manville Group [HCL, 2004]. Bedrock exposure is most frequently observed along river and stream banks, as well as some road cuts and upland margins. Laterally, bedrock formations are highly inconsistent. Individual strata can be truncated into lenses and the thickness of the formations varies locally from indistinguishable in some areas to hundreds of meter in thickness in other areas. General trends in thickness and orientation are more consistent on a regional scale. In the watershed, upper Cretaceous formations generally thin out towards north, as well as thinning eastward to a lesser extent. Equivalent strata of some formations extending well into the eastern basin should be Figure 6. Straigraphic Column of the Western Basins, Alberta Geologic Survey, 2012 noted.

13 The Fort St. John group is comprised of the Manville group, Peace River Formations, and Shaftsbury Formation up to the base of the Dunvegan formation. An alternative designation for the above formations in other areas of the basin is the Colorado Group, which consists of the Peace River formations to the base of Milk River Formation. The Upper Cretaceous Smoky Group consists of Kaskapau, Bad Heart, Puskwaskau. Again, the formations of the Smoky Group and their equivalent strata have alternative designations in different areas within the basin. Doe Creek, Pouce Coupe and Howard Creek members underlying the Kaskapau makes up the base of the Smoky Group. Puskwaskau formations are the equivalent to Cardium, Colorado Shale, Milk River, Lea Park and Foremost. Wapiti Group consists of Oldman and Horseshoe Canyon makes up the uppermost Cretaceous bedrock. Designation and grouping of the formations often changes depending on the source and location of the study. Figure 7. Stratigraphic Column of Western Sedimentary Basin [Alberta Geologic Survey, 1998] The lithology of the individual formations in the Western Basins, from oldest to youngest strata, is as follows: - The uppermost strata of the Mannville group vary in elevation, ranging from more than 2000m below surface in the southern region of the watershed, to less than 200m in the northern region. The uppermost Mannville formation in the Western Basins consists of calcareous marine shale and sandstone, as well as fine to medium grained glauconitic sandstone. In the Eastern Basins, additional non-marine sediment is also present. Equivalent to the Spirit River Formations. - The Fort St. John Group overlies the Mannville group, and consists of the Peace River and Shaftsbury Formations. The lowermost unit Peace River formation can also be broken down further into the Harmon, Cadotte, and Paddy Members. Harmon Member is the lowest member and consists of soft non-calcareous shale with thin beds of bentonite
14 and siltstone. The thickness of the Harmon Member varies from 10 to 34m. The Paddy Member is a lithic, calcareous, continental greywacke with thin coal seams. This member is restricted to southwestern areas of the watershed and reaches a maximum thickness of 40m, located south of Clear Hills [L.E. Leslie and M.M. Fenton, Alberta Geologic Survey, 2001]. Near the town of Peace River, the Paddy and Cadotte Members are exposed in the banks of the river valleys. The Cadotte member consists of coarse to fine grained marine sandstone, roughly 12 to 52m thick. The Shaftsbury Formation is composed of marine shale, with thickness ranging from 150 to 300m. The Shaftsbury Formation contains the second fish-scale bearing, dark marine shale zone; a significant geophysical indicator of the Cretaceous period. - The Dunvegan Formation is a fine grained series of feldspathic sandstone, alternated with thin layers of shale, limestone, and coal. - The Late Cretaceous Smoky Group contains the Kaskapau, Bad Heart, and Puskwaskau Formations. The transitionally overlying Dunvegan formation is the lowest member of the Kaskapau formation, containing dark grey, fissile, carbonaceous shale. The lowest strata of the Kaskapau are inter-bedded with fine-grained, quartzose sandstone [L.E. Leslie and M.M. Fenton, Alberta Geologic Survey, 2001]. This basal transitional zone is made up of the Doe Creek, Pouce Coupe, and Howard Sand Members. The Pouce Coupe sandstone member has been identified as a fine-grained, yellow, massive assemblage of clean sandstone, approximately 10m in thickness, lying 100m above the base of the Kaskapau Formation. This sandstone layer can be delineated across Peace River, to Clear Hills area, where a thick sandy zone has been identified 30m above the top of Dunvegan [J.Jones, 1966]. The Kaskapau formation can extend up to 500m thick in the southwestern part of the watershed. - The second-speckled Shale Horizon separates the upper Kaskapau from Cardium Formation. The Cardium Formation is present in the southwestern areas of the watershed. Composed of marine sand, and shale with sand and conglomerate lenses, the Cardium Formation is a major hydrocarbon bearing formation in the Smoky/Wapiti River Basin. Pembina Oil Field, one of the largest conventional oil fields in Alberta, is located east of Grande Cache and draws from the Cardium Formation. Baytree conglomerate, composed of coarse grain pebble size conglomerate, is a member of the Cardium Formation and is restricted to western edge of the watershed. - Just above the Cardium Formation is the Bad Heart Formation, often undistinguishable from the former. Wall (1960) indicated that the Bad Heart Formation has a sharp contact with the overlying Puskwaskau Formation but a gradual transition to the underlying Kaskapau Formation. The Bad Heart Formation is composed of medium to coarse grained, marine quartzose Sandstone in a massive amalgamation and spreads out tothe east. The thickness varies from 1.5 to 8m [L.E. Leslie and M.M. Fenton, Alberta Geologic Survey, 2001]. - The Puskwaskau Formation and Wapiabi Formationforms the uppermost Smoky Group, and consists of thinly bedded, dark marine shale [L.E. Leslie and M.M. Fenton, Alberta Geologic Survey, 2001]. Around the Smoky River area in the Western Basins, where the Bad Heart Formation is absent, the Wapiabi Formations is applicable to strata between Cardium and Wapiti Formation [J.Jones, 1966]. The Wapiabi Formation consists of the Colorado Shale, Milk River, Lea Park, and Foremost Formations. Puskwaskau is only in

15 the Western Basins, its equivalent in Eastern Basins being the upper members of Colorado Group, Lea Park and Foremost Formation. - The Colorado Shale Formation is predominately composed of marine shalewith interspersed sandstone. The First White Speckled Shale unit is present in this formation, with thickness ranging from 40 to 140 m [HCL, 2004]. - The Chinook Member is a localized littoral marine sandstone and sandy shale up to 25m thick around the Wapiti River area. The Chinook Member is recognized as a member of Puskwaskau Formations. [J.Jones, 1966] - The Milk River Formation overlies the Colorado Shale and has a maximum thickness of only a few tens of meters in the southwestern area of the watershed [HCL, 2004]. - The Lea Park Formation is composed of grey shale with incidental siltstone, with thickness of approximately 50m [HCL, 2004]. - : Composed of mainly marine shale and coal seams, the Foremost Formation is restricted to the southwestern part of the watershed in the Smoky/Wapiti Basin. The maximum thickness of this formation is up to 180m [HCL, 2004]. - The Oldman Formation is composed of weakly cemented freshwater sandstone, and shale the grain size ranges from fine to coarse grained [HCL, 2004]. The maximum thickness of the Oldman Formation in the watershed is less than 180m. - The uppermost Cretaceous Formation is the Horseshoe Canyon Formation in the southwestern part of the watershed. The Horseshoe Canyon Formation is composed of fluvial sandstone, siltstone, and shale in deltaic succession. The lowest and the uppermost strata of the formation are coarse grained sandstone; with the intermediate layers being comprised of fine-grained sandstone [HCl,2004]. Hydrogeological Consulting Ltd. created maps displaying the estimated depth of each bedrock formation for the majority of the Cretaceous formations. The scope of mapping is restricted to the Western Basins only. An example of this is the depth to the top of the Peace River Formation map. Figure 8. Depth to Top of Peace River Formation [HCL, 2004] Detailed mapping of the thickness and depth of each bedrock formation, along with a compilation of water well logs, production potential, and water chemistry data are needed to do a comprehensive assessment of bedrock aquifers in the watershed.
16 In the Eastern Basins, stratigraphic succession of Cretaceous bedrock is slightly varied from that of the Western Basins. Mannville, Colorado, and Belly River are the main groups. The majority of the formations have similar lithology to the formations in Northwest Alberta, making them equivalent units. -In Northeastern Alberta, the uppermost formations in the Mannville Group are the Grand Rapids A and Grand Rapids B Intervals. These are important as both a hydrocarbon bearing formation and as an aquifer zone. At Pelican Lake, in the North and South Wabasca Lake area, located in the southeastern Wabasca Sub-Basin, the base of the Grand Rapids Formations starts with the C interval, and consists of a 6 to 8m thick sandstone layer overlain and underlain by shale [AMEC, 2012]. The maximum thickness of each shale layer is no more than 13m. Sitting above the C Interval is the Grand Rapids B interval, made up of 10 to 50m thick sandstone. The uppermost Grand Rapids A Interval is a sequence of sandstone, which becomes coarser as it moves up in the profile, and shale. In the Pelican Lake area, Grand Rapids A Interval is up to 20m thick. A thin layer of shale up to 4m separates Grand Rapids A and B Intervals. Typically, the Grand Figure 9. Stratigraphic Column from the Pelican Lake Area of Alberta. [AMEC, 2012] Rapids Formation is characterized by fine to medium grained, hydrocarbon bearing sandstone units, separated by a regionally extensive shale layer [AMEC, 2012]. -The base of the Colorado Group in Northeast Alberta is equivalent to the Peace River Formations in the Northwest. The base of the Colorado Group includes the Joli Fou, Viking, and Pelican Formations. The Joli Fou Formation is 15m thick, calcareous, grey shale, interbedded with fine to medium grained sandstones [Glass, 1990]. Joli Fou Formation is considered a major aquitard in the Eastern Basins. The Viking Formation is composed of fine to coarse grained sandstone with variable shale units [Glass, 1990]. Around the Pelican Area, in Southeast Wabasca Sub-Basin, the Viking Formation is a sandstone and shale aquifer unit, ranging from 15 to 25m thick. The Viking Formation is the only regional bedrock aquifer within the Colorado Group [AMEC, 2012]. -The La Biche Formation makes up rest of the Colorado Group which,, based on the presence of geophysical markers such as the Fish Scale zone and White Speckled Shale zone, can be
17 correlated to equivalent units in the Western Basins. The La Biche Formation is predominately composed of shale units.

18 Climate The climate in the Peace River watershed varies from south to north, although it is predominately subarctic with long winters and short summers. The Wapiti basin has period of continental climate and is noticeably more humid and experience longer summers. Annual uniform precipitation map is provided by the research from Alberta Agriculture. Morton s Shallow Lake Evaporation map is provided by Alberta Environment.

19
20 3. Surface Water Surface water shares an intimate connection with climate and weather patterns. Water level in rivers and lakes quickly responds and fluctuates to hydrological events such as a large rainfall event, seasonal snow melt and periods of drought. Gradual trends in surface water can also be attributed to a changing climate. When there are observed trends in the watershed, whether the conditions are improving or deteriorating, it can be attributed to a changing climate as well as the effect of anthropogenic activities, often time it is a compounding of the two. Immediate effects and fluctuations can be observed in surface water sources responding to hydrological events and a changing climate. Whereas oftentimes groundwater sources are much slower to react to aforementioned events because the geologic setting surrounding an aquifer can act as a buffer. The largest seasonal fluctuation occurs during the spring snow melt when large volume of melt water fills the rivers and lakes in the watershed. Western Basins in the Rocky Mountain and the Foothills, the seasonally fluctuation from snow melt is quite drastic. An intimate connection exists between surface water and groundwater. Local and regional recharge and discharge from surface water to the water table and aquifers below forms intricate flow regimes in the watershed. For example, in a particularly dry year of below average precipitation and snowpack size, water level drop in lakes and rivers are expected, however the effect on groundwater has a latency period. A buffer governed by hydrogeological conditions determined how groundwater in an area responds to climate events, and the reaction is usually slower and gradual compared to surface water. In area adjacent to lakes and rivers, and where permeable unit such as sand and gravel deposit are present, immediate hydraulic connection can be expected. In this case, the latency period can be very short and immediate change in water level can be apparent. By the same hydrogeological connection, a drop in groundwater table or water level in surficial aquifers can have a gradual effect on lake and river water levels or even change direction of surface and groundwater exchange. For example, a loosing stream is one that recharges groundwater, while a gaining stream has groundwater coming in. A stream can be gaining or loosing in different sections of its course as well seasonal changes. In order to analyze surface and groundwater relationship and seasonal fluctuations in groundwater and how they relate to lakes and rivers in a regional scale such as the Peace River Watershed, hydrographs responding to historical weather events, climate trends, hydrostratigraphy, mapping of surficial deposits and hydrogeological properties (i.e. transmissivity, yield), evapotranspiration and finally numerical model of the watershed can be utilized. 3.1 Scope and Purpose Section 3 looks at surface water sources in the Peace River Watershed. This section covers surface water quantity in the watershed, historical flow rate in major rivers and streams,
21 Mar-68 Mar-69 Mar-70 Mar-71 Mar-72 Mar-73 Mar-74 Mar-75 Mar-76 Mar-77 Mar-78 Mar-79 Mar-80 Mar-81 Mar-82 Mar-83 Mar-84 Mar-85 Mar-86 Mar-87 Mar-88 Mar-89 Mar-90 Mar-91 Mar-92 Mar-93 Mar-94 Mar-95 Mar-96 Mar-97 Mar-98 Mar-99 Mar-00 Mar-01 Mar-02 Mar-03 Mar-04 Mar-05 Mar-06 Mar-07 Mar-08 Mar-09 Mar-10 Mar-11 Mean Flow Rate (m³/s) historical lake level records throughout the watershed. This section will provide a brief overview of the programs in place to monitor surface water quantity, existing studies on flow trends of the Peace River and simulated percentage contribution from basins to the major rivers. 3.2 Historical Stream Flow Record Environment Canada maintains over 50 hydrometer stations along rivers and lakes in the Peace River Watershed measuring water levels and flow rates. The majority of the stations have been actively recording flow trends of all the major rivers in the watershed for more than 3 decades. Comprehensive monitoring data for the 50 plus stations in the Peace River Watershed can be accessed through Environment Canada s Historic Hydrometer Data. ( Historic flow records of several major streams in the watershed are represented in Appendix B 07GD001 Beaverlodge River near Beaverlodge Monthly Mean Flow (m³/s) Year of Monitoring 07FD901 Peace River above Smoky River Confluence
22 Jun-15 May-18 Apr-21 Mar-24 Feb-27 Jan-30 Dec-32 Nov-35 Oct-38 Sep-41 Aug-44 Jul-47 Jun-50 May-53 Apr-56 Mar-59 Feb-62 Jan-65 Dec-67 Nov-70 Oct-73 Sep-76 Aug-79 Jul-82 Jun-85 May-88 Apr-91 Mar-94 Feb-97 Jan-00 Dec-02 Nov-05 Oct-08 Sep-11 Mean Discharge (m3/s) Sep-15 Jul-18 May-21 Mar-24 Jan-27 Nov-29 Sep-32 Jul-35 May-38 Mar-41 Jan-44 Nov-46 Sep-49 Jul-52 May-55 Mar-58 Jan-61 Nov-63 Sep-66 Jul-69 May-72 Mar-75 Jan-78 Nov-80 Sep-83 Jul-86 May-89 Mar-92 Jan-95 Nov-97 Sep-00 Jul-03 May-06 Mar-09 Mean Discharge (m3/s) May-60 Dec-61 Jul-63 Feb-65 Sep-66 Apr-68 Nov-69 Jun-71 Jan-73 Aug-74 Mar-76 Oct-77 May-79 Dec-80 Jul-82 Feb-84 Sep-85 Apr-87 Nov-88 Jun-90 Jan-92 Aug-93 Mar-95 Oct-96 May-98 Dec-99 Jul-01 Feb-03 Sep-04 Apr-06 Nov-07 Jun-09 Jan-11 Mean Discharge (m3/s) 07FD003 Peace River at Dunvegan Bridge Monthly Mean Flow (m³/s) Year of Monitoring 07HF001 Peace River at Fort Vermilion , were inactive Monthly Mean Flow (m³/s) Year of Monitoring 07GJ001 Smoky River at Watino were inactive. Monthly Mean Flow (m³/s) Year of Monitoring
23 Mean Discharge (m3/s) Aug-70 Mar-72 Oct-73 May-75 Dec-76 Jul-78 Feb-80 Sep-81 Apr-83 Nov-84 Jun-86 Jan-88 Aug-89 Mar-91 Oct-92 May-94 Dec-95 Jul-97 Feb-99 Sep-00 Apr-02 Nov-03 Jun-05 Jan-07 Aug-08 Mar-10 Oct-11 Mean Discharge (m3/s) 07JD002 Wabasca River at Highway No Monthly Mean Flow (m³/s) Year of Monitoring 07GE001 Wapiti River near Grande Prairie Monthly Mean Flow (m³/s) Year of Monitoring
![As part of the Water Yield and Streamflow Trend Analysis for Alberta Watershed study from University of Lethbridge [Stefan Kienzle, 2010], flow trends in all of the major rivers in the province are](/docs-images/85/92280672/images/24-0.jpg "analyzed to show possible recent observed changes in watershed behavior.")
24 As part of the Water Yield and Streamflow Trend Analysis for Alberta Watershed study from University of Lethbridge [Stefan Kienzle, 2010], flow trends in all of the major rivers in the province are analyzed to show possible recent observed changes in watershed behavior. The study looked at flow trends from in 102 watersheds across the province, and was able to identify a net negative trend in the Peace River watershed. For the majority of the rivers in the watershed, a net decline less than 1% annually is observed from the period The most severe declining trends occur in the Notikiwen River, Little Smoky River and around Peace River oil sands, where a maximum decline of 3% annually is observed. The limitation and margin of error to this study still applies. Without further study, it is unclear whether these historical trends are still persistent today and to what degree.
25 The Finlay River in northern B.C is the main headwater of the Peace River. With the construction of W.A.C Bennett Dam and Williston Reservoir becomes headwaters of the Peace River in the late 1960 s, natural flow trends in the Peace River have been significantly altered. The following graph shows natural flow of the Peace River has greater season fluctuations. With Bennett Dam and Williston Reservoir regulating amount of water being released to Peace River, natural seasonal fluctuations of the river haven evened out throughout the year. Overall annual volume in the Peace River has relatively stayed the same. Mean annual flow of the Peace River is 68,200,000 m³ (Alberta Environment and Water, 2011a) Figure 10. Changes of Annual Flow Due to Bennett Dam. [M.Seneka, AENV, 2004] The Smoky River with its head water in the Rocky Mountain near Mount Robson is the largest tributary to the Peace River in northern Alberta, contributing 11 x 10^9 m³ annually. [D.Koster, 2011] The Wapiti River, Notikiwen River and Wabasca River are other major tributaries to the Peace River. Major tributaries to the Smoky River are the Wapiti River and Little Smoky River. The city of Grande Prairie is located just north of the Wapiti River, where regional water supply system (Aquatera) takes water from the Wapiti River to supply drinking water to Grande Prairie and surrounding municipalities. The majority of the municipalities and counties rely on the Peace River, Smoky River and Wapiti River for their drinking water supply. See Section on water allocation for list of sources supplying drinking water to municipalities in the watershed. In the Peace River Watershed, water allocation from surface water sources (rivers, and a small number of lakes) are much greater than allocation from groundwater sources. In 2013, volume of surface water allocated is more than 6 times the volume of groundwater allocation in the watershed.
26 Figure is average monthly flow rate of the Peace River from , taken from historical records of 3 hydrometer stations in different sub-basins of the Peace River watershed. Seasonal flow trends and the effect of allocation as the Peace River moves through the watershed can be observed. The Dunvegan station is the most upstream station at the western boundary of the watershed. Peace River here is relatively untouched and the flow is very close to that of discharge at Bennet Dam and Williston Reservoir. The Peace River is located at the town of Peace River. Here the flow of the Peace River is at its greatest in the watershed due to contribution from the Smoky River. The Peace Smoky River confluence is near the town of Watino, south of town of Peace River. The For Vermillion station is located in the Wabasca basin, and the most downstream of the 3 stations. After the Peace River passes Fort Vermillion, there is no longer any significant water allocation from the river before it reaches Peace Point at Wood Buffalo park conservation area. Flow rate at this station is representative of cumulative effect of water allocation and contribution from tributaries of the Peace River. Note that other the increased flow during spring snow melt which can be attributed to tributaries in this reach of the Peace River (Notikiwen, Wabasca River), there is generally a drop in flow from town of Peace River to Fort Vermilion. With further study on flow trends of all major rivers in the watershed, It may be possible to determine cumulative effect of water allocation on the major rivers as well as observe how the rivers respond to past hydrological events (flooding, drought) and will respond to rising water demands in a changing climate in the future.

27
28 Water Level (m above sea level) Water Level (m above sea level) 3.3 Lake Levels The data used for historic lake levels are obtained from AESRD s MSLL Lake Level Database and Water Survey of Canada s database. In the Peace River Watershed, the number of lakes being monitored by AESRD as part of MSLL Lake Level program has been reduced in the past decade, and the frequency of monitoring lake water levels have reduced as well. Refer to APPENDIX B for complete list of historic lake levels. Sturgeon Lake Cardinal Lake Cardinal Lake Mean Monthly Water Level Saskatoon Lake SASKATOON LAKE Mean Monthly Water Level

29 3.4 Overland Flow The amount of overland flow/ runoff rate is largely dictated by topography and land covers (vegetation type, natural or developed zones etc) Overland flow is typical calculated with Manning s Equation. On a regional scale, it is preferred to incorporate Manning s Equation into a numerical model of the watershed to simulate overland flow processes. As part of the Water Yield and Streamflow Trend Analysis for Alberta Watershed study from University of Lethbridge [Stefan Kienzle, 2010], flow trends in all of the major rivers in the province are analyzed to show possible recent observed changes in watershed behavior. As a part of the study, Figure is an estimated volume of runoff that gets collected by sub-basins in the watershed. This map shows the amount of precipitation that did not contribute to

30 infiltration or evapotranspiration but solely as surface runoff collected by streams in a catchment basin, and eventually drains into the Peace River. Estimated overland flow can be used to determine which areas of the watershed have a large potential for runoff following a precipitation event, which directly affect how surface contaminants are transported in the watershed. Other considerations for the amount of overland flow collected in basins are identifying which basin contributes greatly to volume of water in the rivers, subsequently developing water management plans for.
31 4. Groundwater An aquifer is a water bearing geologic unit located below the groundwater table. Although all units below the groundwater table are fully saturated (except in a few unique cases), only units with materials permeable enough to allow groundwater to flow at a significant rate will be considered aquifers. Loosely stacked, non-consolidated, coarse grained materials (such as sand and gravel) are most common aquifer forming mediums. Fine grained, well sorted silt and clay have lower permeability, and are more likely to form an aquitard ; an impermeable boundary for water. It is common for groundwater to take upwards of ten thousand years to flow through an aquitard. Two primary characteristics used to describe aquifer systems are the properties of the fluid and the properties of the porous media. Properties that can directly influence the physical and chemical properties of the groundwater include (but are not limited to) the age/resident time, depth, lithology of the matrix, and contamination type or concentration. Ground waters ability to pass through porous media is governed by matrix properties such as homogeneity, isotropy, porosity, permeability and storativity which govern the ability for groundwater to flow through them. For any aquifer, properties such as potentiometric surface (NPWL-non pumping water level), lithology, depth, hardness, PH, total dissolved solids (TDS), chemical characteristics, concentration of heavy metals, transmissivity, and yield determined whether the aquifer is suitable for municipal, agricultural or industrial purposes. Section 3 will examine aquifers in the Peace River Watershed. The geologic setting of the aquifer, historic yield of water wells surveyed in different geologic units, and general chemical properties of the associated groundwater are examined. Regional groundwater monitoring programs provide a snapshot of the current conditions of selected aquifers within the Peace River Watershed. Aquifers in the Peace River Watershed are often classified as either surficial and bedrock aquifers. As stated in Section 2 of this report, sand and gravel deposits of glacial origin in overburden are the main sources of freshwater aquifers in the watershed. The majority of bedrock aquifers are associated with the sandstone formations of the upper and lower Cretaceous Period. Groundwater in bedrock aquifers becomes more saline and brackish (high TDS) with increasing depth. Generally, water quality in bedrock aquifers is poor, except in a few of the uppermost formations. Almost all of the water wells deemed suitable for drinking water or agricultural usage are contained within surficial aquifers. Saline water from the lower bedrock aquifers is often used for industrial purposes, commonly in Insitu oil and gas recovery facilities in the southwestern part of the watershed. Aquifers in surficial deposits are divided into lower and upper deposits. Lower surficial aquifers consist of buried pre-glacial fluvial sand and gravel deposits, and buried thalweg or pre-glacial buried channels, making up the lowest units in the overburden. Lower surficial aquifers can form regional groundwater networks as well as potentially recharging the upper bedrock aquifers. The majority of overburden ranges from m thick in the Peace River Watershed, except in linear bedrock valleys where the thickness of surficial deposits can reach up to 200m.

32 Upper surficial aquifers include glacial sediments made up of till and ice-contact deposits. Preglacial materials are expected to be mainly present in association with buried bedrock valleys [HCl, 2004]. Figure 10. Provincial Aquifer Classification [AGS, 2009] not provincial only grande prairie area Alberta Geological Survey has an ongoing mapping program that aims to identity all regional aquifer systems in Alberta. Figure 10 displays the classification of aquifer types in the Grande Prairie region based on the lithology of geologic sediment identified as being representative of the aquifer present within the polygon. Geologic units are classified into 4 types: surface, drift, bedrock and mixed. [AGS, 2009] Surface sediment refers to the part of the surficial deposit that is not of glacial origin. They are post Quaternary and the youngest of all the geologic units. A Drift aquifer refers to an aquifers in sand and gravel deposits formed by glacial processes. Drift aquifers are identified by assessing the aggregate resources [Edward et al ]. Large glaciofluvial, pre-glacial ice margin deposits, eskers, and buried channels are the main locations of drift aquifers in surficial deposits. Bedrock aquifers are the upper and lower Cretaceous Formations. Mixed aquifers refer to combinations of all types of aquifers. Only the western basins in the Peace River Watershed have sufficient data for mapping, though aquifers in the Eastern Basins are expected to be similar types as the Western Basins. The majority of aquifers in the watershed are either drift or bedrock units, with the exception of the Eolian, fine sand deposits along the Peace River near Grand Prairie, north of Peace River, and southwest of Fort Vermillion. Lithology and yield of surficial and bedrock aquifers in each sub-basin will be examined in detail throughout this section.4.1 Surficial Aquifers
33 4.1. Western Basin: Smoky/Wapiti, Upper Peace River and Central Peace River Sub-Basins Surficial aquifers in the Western Basins include buried channels, sand and gravel deposits associated with glaciofluvial and ice contact margins, as well as post-quaternary fluvial and eolian deposits. Available well logs, pump tests, storage and long term yield data have been compiled. An unconfined aquifer is groundwater below the water table that is flows freely and is unencased by impermeable layers, exposing it to atmospheric pressure.. The groundwater table, lakes, and springs can be considered unconfined aquifer systems. A confined aquifer is encased by impermeable units (aquitard/aquiclude) that restrict the flow of water, as well as restricting recharge from nearby units. Where an aquifer consisting of highly permeable material, such as sandstone, is overlain by a less permeable strata (i.e. shale), the water in the aquifer may be confined and put under pressure [Jones, 1966]. Confined aquifers are typically associated with artesian conditions, where the potentiometric surface of the water is higher than the top of the geologic unit. Alberta Geologic Survey Map 601 is the most recent surficial geology map of the province, while Map 600 provides the uppermost surficial deposits near the surface only. Hydrogeological Consultants Ltd. mapped the thickness and extent of buried sand and gravel deposits in the drift, which are potential aquifers in surficial deposits.

34 Post-Pleistocene (post- Quaternary) deposits not associated with glacial activity can be found up to 5m below the surface throughout the watershed. Along the deeply incised valleys of Peace, Smoky, Little Smoky, Wapiti, and Wabasca Rivers, post- Pleistocene alluvial, colluvial, and eolian deposits are present. The hydrogeological importance of non-glacial deposits is typically considered minimal in the watershed. Alluvial terraces and colluvial slump features are restricted to areas along the valleys of major rivers and therefore limited in thickness and area of distribution. These deposits form direct hydrological connection with the river and are typically not reliable aquifers, as is the case with river terraces along the Wapiti River. Extensive lateral, medium to fine grained, eolian sand deposits, which originated from the Pleistocene to Holocene periods, is present above river valleys, especially in the Smoky and Wapiti River confluences, the Smoky and Little Smoky River confluences, the Peace and Nortikewin River confluences, La Crete area, and the Peace and Athabasca deltas. Finally in the area surrounding Wapiti, Smoky, Little Smoky and Peace River, glaciolacustrine deposits composed of laminated fine sand and silt, remnant of glacial lakes and near shore environments, are the most dominant near surface deposits Smoky/Wapiti Basin: The Smoky/Wapiti Basin is located in the Rocky Mountainand Foothills regions, where surficial aquifers in the region are typically more productive, flow systems and residence times are short,
35 and water qualityhas been classified as excellent [R.Barnes, 1977]. The town of Grand Cache is located within the Smoky/Wapiti Basin, situated in the Rocky Mountain and Foothills regions, in the southwestern part of the Peace River Watershed. Surficial deposits in this region have an irregular, patchy distribution due to post-glacial erosion [Barnes, 1977]. Drift thickness is generally very thin, averaging around 15m throughout the region. A series of extensive coal seams are present in the drift, hence the concentrated coal mining in this region. Pre-glacial alluvial sand and gravel deposits are present within the Bezanson/Brazeau buried valley below the Smoky River near Smoky/Wapiti confluence. The Bezanson/Brazeau buried valley is identified as being composed of mainly quartzite and chert cobbles at a depth of 50-60m below surface in the southernmost region of Smoky/Wapiti Basin. In southern region of the Smoky/Wapiti basin, the static groundwater level on the western side of the Smoky River is very low,with wells up to 100m deep not intersecting fully saturated aquifers northwest of Grand Cache [Jones, 1966]. The static water level in wells installed in areas of overburden near Victor Lake is around 12m below the surface. Just northwest of the town of Grande Cache and west of Smoky River, static water level drops to 22m. North in the High Plains, static water level appears to be as deep as 53m in the hills west of Smoky River, then gradually rises heading northwest toward Wapiti Plain. Due to the thin overburden in the region, it appears any static water levels below 20m have a high chance of being included in the bedrock aquifers. The apparent yield of wells surveyed in surficial aquifers in this region ranges from 10igpm (2.73m³/hr) to 45igpm (12.3m³/hr), however the majority of these surficial aquifers exist as disconnected pockets of sand and gravel. The regional AGS hydrogeology map shows the majority surficial deposits have low expected yields, often no more than 20igpm (5.45m³/hr), with the exception being the large lobe of glaciofluvial gravel underlain by the upper Cretaceous Paskapoo Sandstone Formation, located northeast of Grand Cache. The modern day Smoky River intersects the western edge of this lobe. Further north is the municipality of Grande Prairie. The Wapiti, Smoky, and Simonette Rivers all have deeply incised valleys in this area. Upper surficial deposits in the region consist primarily of glaciolacustrine silt and clay with glaciofluvial sand and gravel deposits along the Wapiti and Smoky Rivers, as well as laterally Figure 11. Buried Valleys near Grande Prairie [Hackbarth, 1978] extensive, fine eolian sand deposits, extending from Grande Prairie to the confluence of the Smoky and Little Smoky Rivers. A disconnected pocket of glacial sand and gravel is present along Beaverlodge River, west of Grande Prairie in the Beaverlodge and Hynth area.
36 The Bezanson/Brazeau valley, a major pre-glacial buried valley in the region is still present. It runs parallel to and almost directly below the Smoky River in this region. Two tributaries of the Bezanson/Brazeau valley are the Grande Prairie and Wembley buried valleys, both moving northwest. The Grande Prairie buried valley runs parallel to the present day Wapiti River then curves northwest and runs underneath the municipality of Grande Prairie. The Wembley buried valley cross cuts the Wapiti River and runs parallel to the course of the present day Beaverlodge River, up to Hynthe. The outcrop of the Wembley buried valley, along the west bank of Beaverlodge River, consists of(from the uppermost strata downward) 5m of varved silt and clay, 30m of till, then 6m of coarse gravel at the bottom [Jones, 1960]. Laterally extensive coarse sand and gravel beds up to 6m thick outcrops east of the Smoky River in the Watino area. The outcrop is roughly 30m above the Smoky River channel and 1km below Little Smoky River confluence [Henderson, 1959]. Water well records in this area show near surface coarse sand and gravel deposits with yields of 30igpm. The Benzanson/Brazeau buried valley is tributary to the High Prairie buried valley, another major buried valley in this area. The High Prairie buried valley is coincidental with the present day location of Lesser Slave Lake, and runs northwest, parallel to the present day course of Little Smoky River [HCL,2004]. It is characterized by deeply buried, glacial outwashes of sand and gravel deposits up to 180m below surface. The unique lithology of this deposit is comprised of medium to coarse grained sand with well-rounded quartz, feldspar, chert, granite, gneiss, coal, and heavy minerals such as epidote, zircon, chlorite, among others [Jones, 1966]. An unnamed north-south trending tributary buried valley to the High Prairie buried valley is located at the eastern boundary of the Smoky/Wapiti basin. The Shaftsbury buried valley runs northeast, from the BC/Alberta boundary to the town of Peace River. Its course is parallel to the present day Peace River. The Shaftsbury buried valley is in excess of 20km wide in the Fairview and Dunvegan areas, with local bedrock relief up to 100m [HCL, 2004]. The Shaftsbury channel is filled with up to 240m of sediment, with sand and gravel deposits potentially up to 20m thick. Along with Shaftsbury buried valley, 2 more buried valleys in the vicinity of the town of Peace River have been identified [Tokarsky, 1967]; the I Hirodelle and the Manning channels. I Hirodelle channel is deeply buried up to 240m below the surface, trending east-west toward Peerless Lake, with a possible tributary to the Shaftsbury channel. The Manning channel was first identified by Tokarsky and isfilled with up to 150m of sediment. A fairly extensive sand and gravel deposit was found at the bottom of the channel around the town of Manning. The yield in the Manning channel ranges from 25 to 100 igpm [Borneuf, Alberta Research Council, 1981]. Test holes in the buried valley aquifers in the region have been found to have poor water quality due to high sulfates and chlorides concentrations. Notikewin buried valley is a north-south trending buried valley north of the town of Peace River. The course of Notikewin buried valley is parallel to the present day Peace River.

37 Grimshaw Gravel: Grimmshaw Gravel is an extensive glacio-fluvial deposit of coarse sand and gravel, located west of the town of Peace River and adjacent to Cardinal Lake in the Upper/Central Peace Basin. It is the most economically viable and important aquifer in the region due to its high yield and excellent water quality. The sediment in Grimshaw Gravel has been identified as Pliocene to Pleistocene Saskatchewan Gravel deposits, making Grimshaw Gravel part of the oldest surficial deposit in the region. Grimshaw Gravel started forming prior to the development of Shaftsbury buried valley in a glaciofluvial depositional environment, and was subsequently eroded and down cut by the Shaftsbury channel and its tributary, the Berwyn channel. The Grimmshaw Gravel is an unconfined aquifer divided into 3 main lobes: the southwest lobe, about 330km² in area; the central lobe, approximately 175km², and the northeast lobe approximately 90km², for a total area of 600km² [Cowen, 1994]. The Berwyn buried channel runs underneath Cardinal Lake and separates the central and southwest lobes [HCL, 2004]. Between Grimshaw Gravel and the Shaftsbury Channel, lower level terraces are also present. These terraces are less extensive in area than Grimshaw Gravel, but are excellent aquifers [PFRA, 1998].
![Figure 12 Cross Section of Grimmshaw Gravel [PFRA, 1998] The thickness of Grimshaw Gravel ranges from minimal to 30m thick.](/docs-images/85/92280672/images/38-0.jpg "The majority of the southwest lobe is over 10m thick and the central lobe over 25m thick, while the northeast lobe only has a small portion over 10m thick [HCL, 2004].")
38 Figure 12 Cross Section of Grimmshaw Gravel [PFRA, 1998] The thickness of Grimshaw Gravel ranges from minimal to 30m thick. The majority of the southwest lobe is over 10m thick and the central lobe over 25m thick, while the northeast lobe only has a small portion over 10m thick [HCL, 2004]. The general flow direction in all lobes of Grimshaw Gravel is from the northwest to the southeast, and recharge to the aquifer most often comes from Cardinal Lake. HCL recorded water levels in Cardinal Lake to be 4m higher than the groundwater associated with Grishaw Gravel, although it is unclear whether the difference is an average or fluctuates seasonally. The most recent assessment of aquifer yields was done by HCL in Out of the 128 water wells installed in Grimshaw Gravel, 8 wells have apparent yields exceeding 1,000 m³/day, 5 wells have apparent yields between m³/day, 13 have apparent yields between m³/day, and 31 have yields less than 10 m³/day [HCL, 2004]. Alberta Research Council assigned a yield of 100igpm to 500igpm to Grimmshaw Gravel in Other surficial and deeper sand and gravel deposits surrounding Cardinal Lake were assigned a 20-year safe yield of 5 to 25igpm [Borneuf, 1981]. Post-Pleistocene deposits not of glacial origin can be found up to 5m below the surface throughout the watershed.
39 4.1.2 Eastern Basins: Lower Peace, Wabasca and Slave Sub-Basin Regional groundwater studies are noticeably less comprehensive in the Eastern Basins. The majority of the groundwater assessments are restricted to small areas. AESRD does not have active groundwater monitoring programs set up in the Eastern Basins and all of the groundwater monitoring is done for local facilities dispersed throughout the basin. AGS has mapped bedrock geology, topography, and upper surficial geology. However, detail mapping of buried valleys and sand and gravel deposits are unavailable in the public domain for large portion of the Eastern Basins. The uppermost surficial geology of the Eastern Basins is quite similar to that of the Western Basins; the low lands and floodplains surrounding the major rivers are mainly covered by fine glaciolacustrine sand and silt, with patches of fine eolian sand along the river. Outcrops of glaciofluvial sand and gravel deposits are wide spread and deposited in isolated pockets. The dominant lithology is till in the form of ground and hummocky moraine. Ground Moraines are the dominant lithology in topographic highs. Extensive outcrops of diamicton (till), stagnant ice moraines, fluted moraines, and glaciofluvial sand and gravel deposits cover the Wabasca basin, while the extensive glaciolacustrine deposits of the Western Basins are minimal. Surficial geology of the Wabasca basin is dominated by glacial features, characterized by hummocky topography, fluting moraines and drumlins. Comprehensive mapping of the thickness and extent of the sand and gravel outcrops as well as other buried deposits in the Wabasca basin are currently not available.
40 Drift thickness in the Eastern Basins ranges from 50m to over 200m. Laterally extensive drift deposits cover most of the Wabasca Basin. Drift deposits up to 200m thick are present in the areas surrounding Buffalo Hills, Birch Mountain, Pelican Lake, North and South Wabasca Lake, and Peerless Lake. The major pre-glacial buried channels in the Wabasca basin include the north-south trending Misaw buried valley. The Misaw buried valley is generally greater than 150m below surface and the general lithology comprises of till interbededded with sand and gravel. Its course coincides with present day Muskwa and Loon Rivers. Two tributaries to the Misaw buried valley are the north-south Atikameg buried valley and the east-west L Hirondelle buried valley. The basal sand and gravel in the southeastern part of the Misaw buried valley has the highest aquifer potential. The northern part of the Misaw buried valley does not contain well-developed basal sand and gravel unit as shown by an assessment of a 249m deep test hole in the Red Earth settlement [Ceroici, Alberta Research Council, 1979]. In the north-south trending portion of the Misaw buried valley, the yield obtained was less than 25igpm. A pumping test carried out at the settlement encountered thin sand and gravel lenses within the till The 20 year safe yield was calculated to be 8igpm and transimissivity was 0.2 m²/day. The 20 year safe yield in the Atikameg buried valley and southern parts of Misaw buried valley is over 500igpm [Ceroici, 1979]. L Hirondelle buried valley contains a basal sand and gravel unit that may yield igpm, although high permeability and drawdown is expected in this unit [Ceroici, 1979]. Local groundwater discharge is present in all topographic lows in the Wabasca Basin. In areas such as Loon River lowland and Algar Plain, infiltration in the uplands recharges the aquifers, and regional groundwater flow systems eventually discharge into rivers and lakes. South of Gods Lake, large springs in the sandy lenses have seepage rates of 75igpm. Numerous springs in the Wabasca river valley have seepage rates less than 10igpm. Basal sand and gravel aquifers in the buried valleys are usually compacted till and under artesian conditions. Flowing artesian conditions were observed in wells located in the Misaw buried valley at the Red Earth settlement, despite the thin sand and gravel units. Flow rates are generally less than 5igpm [Ceroici, 1979].

41 North of Utikuma Lake, extensive aquifers under artesian conditions can be expected 60-90m below the surface in a 15m thick sand and gravel deposit. Artesian flow rates of 50igpm can be expected in wells in this aquifer [Ceroici, 1979]. Groundwater quality in the Peerless Lake area is generally poor. The concentration of TDS in groundwater in glaciofluvial sand and gravel aquifers and the buried valley aquifers ranges from 500mg/L in the uplands, to over 2000mg/L in the lowlands. Groundwater in the drift aquifers is primarily a Calcium/magnesium bicarbonate type [Ceroici, 1979].
, the Horseshoe Canyon formation belongs to the upper Wapiti Group.")
42 4.2 Bedrock Aquifers Western Basins: Smoky/Wapiti, Upper and Central Peace River Sub-basins - Horseshoe Canyon Aquifer: Located in the upper Horseshoe Canyon Formation, in the southwestern part of the Smoky/Wapiti sub-basin (as discussed in Section 2), the Horseshoe Canyon formation belongs to the upper Wapiti Group. Due to the thin drift thickness in the Smoky/Wapiti basin, the depth to the Horseshoe Canyon Formation is typically less than 50m [HCL, 2004]. The lithology of the aquifer includes fine grained sandstone, siltstone, and coal seams. Out of the 916 water wells surveyed in the Horseshoe Canyon Aquifer with apparent yields recorded, 52% are less than 20m³/day, while 40% range from m³/day, and 9% are greater than 175m³/day [HCL,2004]. The Horseshoe Canyon aquifer has an effective transmissivity of 8m²/day and easy access due to its location close to the surface. This makes the Horseshoe Canyon formation an efficient aquifer for use, particularly in the Beaverlodge and Grande Prairie area. The Horseshoe Canyon formation drastically thins out toward the north to the Upper Peace sub-basin. Groundwater in the Horseshoe Canyon aquifer is mainly a bicarbonate-to-sulfate type, with TDS concentrations typically around 1000mg/L [HCL, 2004]. The concentrations of TDS, sodium, chloride and fluoride have been compared to SGCDWQ, and the concentrations of TDS and sodium exceed the drinking water guidelines [HCL, 2004]. - Oldman Aquifer: The depth to the Oldman aquifer ranges from less than 50m in the northern Smoky/Wapiti basin, to more than 450m in the southern part of the
43 Smoky/Wapiti basin. In the uppermost strata of the Oldman aquifer, non-pumping groundwater typically flows toward the Smoky River. Out of 455 water wells surveyed in the Oldman aquifer, 44% produce less than 20m³/day, 47% around m³/day, and 9% producing greater than 175m³/day. Effective transmissivity was recorded at 84.9m²/day by HCL in Similar to the Horseshoe Canyon aquifer above it, the groundwater in the Oldman aquifer is mainly a bicarbonate-to-sulfate type, with TDS concentrations ranging from mg/L. The concentrations of TDS, sodium, chloride, and fluoride have been compared to SGCDWQ and concentrations of TDS and sodium exceed the drinking water guidelines [HCL, 2004]. - The Lowermost formation of the Wapiti Group is the Foremost aquifer. The depth to the top of the Foremost ranges from 50m in the southern Smoky/Wapiti basin to more than 500m to the south. The maximum thickness of the formation is 180m and, similar to the other Upper Cretaceous formations, the Foremost thins out and has eroded to the north. Out of 877 water wells surveyed in the Foremost as of 2004, 35% have apparent yields of less than 20m³/day, 53% are m³/day, and 13% exceeds 175m³/day [HCL, 2004]. Effective transimmisivity for this aquifer is recorded as 15.5 m²/day [HCL, 1988]. Groundwater in the Foremost aquifer is a bicarbonate-to-sulfate type, with calciummagnesium and sodium as the main cations. The concentrations of TDS range from mg/L [HCL, 2004]. The concentrations of TDS, sodium, chloride, and fluoride have been compared to SGCDWQ and the concentrations of TDS and sodium exceed drinking water guidelines. [HCL, 2004]. Generally the relative un-consolidated sandstone of the Wapiti formations can have high transimmisivity and yields, especially in the Grande Prairie to Beaverlodge area. East and north of Grande Prairie, the Wapiti formation thins and become more shaly, thus becoming a less reliable aquifer. - The Lea Park formation is the first formation underlying the Wapiti Group in the southern Smoky/Wapiti basin. The depth to the top of the Lea Park formation ranges from 100m in the northern part of the basin to more than 600m at the southern boundary.the thickness of the formation ranges from minimal up to 300m. Out of 53 water wells surveyed in the Lea Park formation as of 2004, 23% have apparent yields of less than 20m³/day, 45% ranges from m³/day, and 32% exceeds 175m³/day. The Lea Park formation is identified as generally fine grained and shaly in composition, making its ability to produce high yields not easily explained. Apparent transmissivity has been recorded as a range of 2.4 to 33m²/day. Water in the Lea Park aquifer has been identified as mainly a sodium-bicarbonate type. The TDS concentrations range from mg/L. Concentrations of TDS, sodium, chloride, and fluoride have been compared with SGCDWQ, and TDS and sodium exceed drinking water guidelines [HCL, 2004]. - Milk River/Colorado Shale Formations: These formations are generally not used as aquifers, due to their shaly composition and poor water quality. Although the Chinook member, present in northwestern Alberta, may have potential as an aquifer, no study of water quality has been found. The concentration of TDS ranges from mg/L.
44 The concentration of TDS, sodium, chloride, and fluoride have been compared with SGCDWQ, and the concentration of TDS, sodium and sulfate exceed drinking water guidelines [HCL,2004]. - Cardium Aquifer: This sandstone and siltstone aquifer is quite extensive in the Western Basins. The outcrop of the Cardium formation covers the Smoky/Wapiti basin and the southern part of the Upper Peace River sub-basin. The depth to top of the formation ranges from 100m to more than 900m [HCl, 2004]. In the Grande Prairie and Beaverlodge areas, the Cardium Formation is at a depth of approximately m [Jones, 1966]. Despite water quality in the Cardium becoming brackish and saline with depth, there is still a significant groundwater reserve in the sandstone of the Cardium Formation. The Baytree member has been identified as coarse sandstone with black chert and quartzite conglomerate up to 2m thick. Outcrops are restricted to the western boundary of the watershed in the Spirit River area. It is quite permeable with high potential for precipitation to infiltrate and recharge groundwater reservoir [Jones, 1966]. There are also extensive hydrocarbon reserves in the Cardium formation. The largest conventional oil field in Alberta, the Pembina Oil Field, situated in Drayton Valley, targets the hydrocarbon bearing units in the Cardium formation. Therefore, most of the water wells in Cardium aquifer are used for industrial purposes. Water wells surveyed in the Cardium aquifer in the Bear Lake area recorded long term yields of 200m³/day, based on transmissivity ranging from m²/day [HCL, 1996]. The TDS concentration in the groundwater ranges from 500 up to 5000mg/L, with TDS and sulfate concentrations exceeding SGCDWQ recommendations. - Kaskapau Aquifer: Kaskapau formation consists of the Howard Creek, Pouce Coupe and Doe Creek members, and outcrops throughout the northern part of the Smoky/Wapiti basin and the western part of the Upper Peace River basin. The depth to the top of the formation ranges from less than 100m to more than 900m in the southernmost region of the watershed. The sandstone in the Pouce Coupe member is up to 15m thick, and may be a valuable aquifer at the western boundary of the watershed. Of the 16 water wells with apparent yields recorded, 25% are less than 20m³/day, 56% are in the m³/day range, and 19% of wells exceed 175m³/day [HCL, 2004]. There have been 27 licensed wells surveyed in the Kaskapau aquifer; total diversion from this formation in 2004 is 1013 m³/day. Groundwater from the Kaskapau Aquifer is identified as mainly a bicarbonate or sulfate type, with calcium-magnesium as the main cations. The concentration of TDS ranges from mg/l, with an average of 1292mg/L. [HCl, 2004] Both TDS and sulfate concentrations exceed SGCDWQ recommendations.
45 - Dunvegan Aquifer: The Dunvegan Formation is laterally extensive in the Western Basins. It is thickest in the northwest part, at approximately 200m thick, thinning rapidly to the east and southeast. The depth to the top of the formation ranges from less than 100m north of Peace River to more than 1500m at the southern boundary of the watershed. The sandstone in the Dunvegan is mostly fine grained and silty, especially south of the town of Peace River, where the Dunvegan formation becomes very fine grained [Jones, 1960]. The Dunvegan Formation generally act as a regional aquitard, although it can act as a low yield aquifer in areas northwest of Peace River. Out of 42 water wells surveyed in the Dunvegan aquifer with apparent yields recorded, 36% are less than 20m³/day, 59% are m³/day, and 5% exceed 175m³/day. In general, the yields increase toward the northern part of basin. There have been 49 licensed wells surveyed in the Dunvegan aquifer, for a total diversion rate of 182m³/day. More than half of the diversion is for agricultural usage [HCL, 2004]. The water quality is generally poor. 35% of groundwater samples have TDSconcentrations higher than 1,200 mg/l, exceeding the SGCDWQ recommendations. - Shaftsbury Aquifer: The Shaftsbury Formation extends underneath most of the Western Basins. The depth to the top of the Shaftsbury Formation ranges from less than 100m to more than 1700m in the southernmost part of the watershed. Only 4 water wells in the Shaftsbury aquifer have defined apparent yields, and all of which are less than 20m³/day. Five licensed water wells combined for total diversion of 21m³/day, the majority (80%) of which is for recreational activities. Water Quality is generally poor, with TDS, sodium, and sulfate concentrations all exceeding SGCDWQ recommendations. - Peace River Aquifer: The Peace River Formation includes the Paddy, Cadotte, and Harmon members. The depth ranges from less than 200m to 2000m in southern part of the watershed. For most of the Western Basins, the Peace River Formation is too deeply buried to be a suitable aquifer for domestic or agricultural usage. No water wells with associated licensed diversions were found in the Peace River Formation in the Western Basins [HCL, 2004]. Groundwater Quality is recorded as poor, and TDS, sodium, sulfate and chloride concentrations all exceeded SGCDWQ recommendations. Water in the Peace River Formation could be suitable for industrial usage, such as water for in situ oil and gas recovery.
46 Eastern Basins: Lower Peace, Wabasca and Slave River Sub-Basins The extensive Upper Cretaceous formations present in the Western Basins begin to rapidly thin out to the north. In the Eastern Basin, eroding forces have reduced the thickness of Upper Cretaceous formations considerably, resulting in the Shaftsbury, Peace River, and Manville Formations being closer to the surface and in the northernmost part of the watershed, sub-crops underneath the drift. Though in the majority of the Wabasca basin, formations in the Upper Cretaceous still retain sufficient thickness to be considered aquifers/aquicludes. A Comprehensive groundwater assessment of the Eastern Basins is not currently available, as all of the groundwater studies have been done on a local scale. Hydrostratigraphy of the Pelican Lake area can be used as a representative of bedrock aquifers in the southern part of Wabasca basin. As previously discussed, the Upper Cretaceous formations have thinned out considerably. - In the Pelican Lake Area, The La Biche formation is equivalent to the Shaftsbury and above formations in the Western Basins. The formation acts as regional aquiclude immediately beneath surficial deposits. The La Biche formation is composed of dark grey and brown shales associated with calcareous white-speckled shale [Glass, 1990]. Both the First and Second White Speckled Shale units and the Base of the Fish Scale unit are present in the La Biche formation. Deeply incised bedrock valleys are present (refer to surficial aquifers section #). Based on the assessment of a regional groundwater flow model, estimated horizontal and vertical hydraulic conductivity are to the order of 3.1*10ˉ8 and 5.1*10ˉ10 m/s, respectively [Worleyparsons, 2010]. - Combined Viking and Joli Fou Formations are equivalent to the Peace River Formations in the Western Basins, and the lithology of the strata share similar characteristics. The Viking formation is composed of fine to coarse grained sandstone [Glass, 1990] and shale units. Distinctive sandstone aquifer units can be found throughout the Viking Formation, and one such aquifer unit is present in the Pelican Lake area [AMEC, 2013]. In the Pelican Lake Area, the Viking formation varies from 15 to 25m thick, a sequence of shale, siltstone and sandstones that coarsen upward. Three distinctive sandstone aquifer units are present with thicknesses of 1m, 2m, and 4.5m [AMEC, 2013]. The Viking Formation is an important hydrocarbon producing formation in the region.
47 - The lithology of the Joli Fou formation is quite similar to that of the Western Basins; dark grey calcareous shale with minor, interbedded, fine and medium-grained sandstone [Glass, 1990]. In the Pelican Lake area, the Joli Fou is 14 to 15m thick [AMEC, 2013]. The Joli Fou formation is a regional aquiclude, with horizontal and vertical hydraulic conductivities of 1.2*10ˉ8 and 1.5*10ˉ11 m/s [WorleyParsons, 2010]. - The Grand Rapids formations in the Upper Manville Group are another regional aquifer as well as a major hydrocarbon producing formation. The Grand Rapids formations is made up of 3 sandstone units: the upper A, the middle B, and lower C units [Glass, 1990]. The 3 units are separated by lower permeability mudstone. The Grand Rapids A interval is a upward coarsening sequence of lower shoreface sandstone and shale, grading upwards to near-shore, fine to medium grained sandstone [AMEC, 2013]. Above the bitumen saturated sandstone is a lean zone with a thickness of up to 5m, which has been identified as the Grand Rapids A aquifer. Hydraulic conductivity for the aquifer is 3*10ˉ5 m/s [AMEC, 2013]. Groundwater flow in the Pelican Lake area is toward the Athabasca River valley in the east. - In the Pelican Lake area, the Grand Rapids B interval consists of sandstone units, with the thickness ranging from 10-50m. Water well testing in the Pelican Lake area determined effective transmissivity to be 12m²/day and the long-term (Q20) yield to be 816m³/day. The groundwater is determined to be a sodium-bicarbonate type with TDS concentrations ranging from 1250 to 1800mg/L. - In the Peerless lake area, the water quality in bedrock aquifers is generally poor. The Smoky Group and Dunvegan Formation are mainly low permeability Cretaceous shale and siltstone sub-crop, with typical yields ranging from 5-25 igpm. 4.3 Groundwater Monitoring: Groundwater Quantity All of the water level monitoring in aquifers was done by Alberta Environment Groundwater Observation Well Network (GOWN). GOWN provides the most reliable and up to date reports of historic and current water levels in aquifers. Because groundwater levels in surficial aquifers vary seasonally, responding to precipitation, snow melt, and drought events, only water levels recorded over a span of several years can be used to comment on trends and aquifer responses to storm and drought events. 12 GOWN wells are currently active in the Peace River Watershed and it is likely the water level in these wells is recorded by pressure transducers as potentiometric surfaces or hydraulic head. Station 07GDG005 ( W6M) near Hynth is completed in the upper Wapiti Formation. Completion depth of 25.9m below surface in a sandstone aquifer. (Horseshoe Canyon, Oldman, or Foremost) Production interval is near or at the bottom.
48 Station 07GDG001 ( W6M) near Beaverlodge is completed in the upper Wapiti Sandstones as well. Completion depth 40.08m. Either Horseshoe Canyon or Oldman aquifer. Production interval is near or at the base. Station 07GDG003 ( ) near Beaverlodge. Completed in the upper Wapiti sandstones, depth is 42.7m. Either Horseshoe Canyon or Oldman aquifer. Difference in elevation of water level between this well and 07GDG001 above suggests 07GDG003 is completed in Oldman Formation and the previous well is completed in Horseshoe Canyon formation. Production interval is near or at the base.
49 07GJG004 Kleskun ( ) at Kleskun Hill east of Grande Prairie, completed in upper Wapiti sandstone to a depth of below surface. Production interval is near or at the base. 07GJG005 Watino ( ) located just west of Watino is completed in a shallow surficial aquifer west of Smoky River, 5km downstream of Smoky and Little Smoky Confluence. Depth of completion is at 8.8m. Production interval is near or at the base.
50 07FCG001 Fairview ( ) located northeast of town of Fairview and west of Grimmshaw Gravel. Well complete in deep surficial aquifer, identified as part of Grimshaw Gravel. Completion depth is 37.5m. Production interval is near or at the base. 07HAG003 Grimshaw Kendale ( ) located just west of Cardinal Lake, is also completed in Grimshaw Gravel, completion depth 53.34m but production interval is from 27-33m. 07FCG005 Grimshaw Nissan ( ) located east of Cardinal Lake is completed in Grimshaw Gravel, completion depth at 21m. Production interval is near or at the base.
51 07FCG003 Grimshaw Mercier ( ) located east of Cardinal Lake and north of town of Grimshaw is shallow well completed in the Grimshaw Gravel. Completion depth is 19.2m and production interval from m. 07HAG007 West Peace (SE ) is located on western bank of Peace River at the town of Peace River. It s a shallow well in surficial aquifer, completion depth at 8.84m. Lithology of the deposit is described as gravel; it is likely the deposit is a river terrace. Production interval is near or at the base. 07HAG009 West Peace North_0337 (NE ) is a nearby well in the shallow aquifers on the west bank of Peace River. Completion depth is 14.25m. Production interval is near or at the base.

52 07HBG001 Cadotte Lake ( ) is located northeast of town of Peace River and west of Cadotte Lake. The well is completed in a deeply buried bedrock valley. The buried valley, which could be extension of east-west trending Shaftsbury Valley, connects the north-south trending Notikewin and the North-south trending Red Earth buried valley. Completion depth is at 240m. Production interval is near or at the base. 07JDG006 La Crete ( ) located east of La Crete and south of Fort Vermilion is completed in surficial sand and gravel aquifer. Completion depth is15.2m. Production interval is from m. 07JDG004 La Crete ( ) is a nearby well completed in buried valley sand and gravel deposit. This buried valley could be a tributary to Wood Buffalo buried valley but could not be identified with certainty. Completion depth is at 83.5m. Production interval is near or at the base.
53 4.3.4 Observed Groundwater Level Trends: Upper Wapiti sandstone formations which includes the Horseshoe Canyon, Oldman and Foremost formations does not have particularly high yields except for few areas in northern part of the Smoky/Wapiti basin where the Oldman and Foremost outcrops below the drift. One monitoring well located at Kleskun is completed in the Upper Wapiti sandstone formation to a depth of with production interval near or at the base. Hydraulic head in this monitoring well has seen a drop of roughly 2m in the last 20 years. Current hydraulic head is fluctuating around 648m amsl. 07GJG005 Watino ( ) is completed in a shallow aquifer near Smoky and Little Smoky River confluence. A slight decline of 1.5m over the last 20 years can be observed. The well is completed in a shallow aquifer on the banks of the Smoky River; therefore the aquifer could share intimate hydrological connection with the Smoky River. Shallow monitoring well 07JDG006 La Crete ( ) in a shallow surficial aquifer east of La Crete and south of Fort Vermilion with a completion depth of 15.2m and production interval from m. Hydraulic head in this well has seen a drop of close to 3m in the last 2 decades. When monitoring began in the early 90 s, water level in this unconfined aquifer is close to the surface, almost artesian conditions were observed. A drawdown of 3m is estimated to be upwards of 20% of the aquifer s original available head. Although the thickness of this surficial/drift aquifer as well as lateral extensiveness of the head loss is unknown; therefore it is difficult to predict the impact of the current water usage rate on the aquifer. However it is clear this surficial aquifer is currently under some stress from water usage. A second monitoring well in La Crete/Fort Vermilion area, 07JDG004 La Crete ( ), located at the same spot as the above well but completed in an unidentified buried channel aquifer. Completion depth is at 83.5 with production interval at the base of the well. This well originally has average 71.5m of available hydraulic head when monitoring began in the early 90 s. A 3m head loss was observed in followed by a recovery in the next year. Lowest hydraulic head observed in the summer of 2013 is 261.7m relative to mean sea level, which correspond to total head loss upwards of 3%, since then the aquifer has recovery close to its original level. Note that the deeper buried channel aquifer does not seem to be connected to the above shallow aquifer and fluctuations in the two aquifers does not seem to be related Strategic expansion of Groundwater Observation Well Network program in the watershed is recommended in anticipation of rising water demand from industries and a growing population. Smoky/wapiti and Wabasca basin account for 80% of groundwater allocation in the Peace River Watershed therefore should have increased monitoring first and foremost. Southern Wabasca basin is a hot spot for In situ/sagd operations along with the region east of the town of Peace River. Several pilot projects such as Husky McMullen, Cenovus Energy Pelican
54 Lake, and Shell Canada s Cameron Creek among others are designated for operational in the next few years. As evident from the 2013 water allocation record, ESRD approved several temporary diversion licenses for commercial and industrial usage in the watershed which accounted for 88% of total groundwater allocation in the Wabasca basin. Currently in the southern Wabasca basin there is no evidence suggesting industrial and commercial usage are having an adverse effect on quantity of groundwater, however that might change if more monitoring are in place and more groundwater data are gathered in the future. Water resources in this basin seem to be quite abundant as well, although how it will accommodate for future rising water demands from industrial and commercial sector is unclear, attributed by lack of monitoring information and lack of groundwater studies in the Wabasca basin.
55 4.4 Aquifer Vulnerability to Surface Contaminants The Prairie Farm Rehabilitation Administration (PFRA), now Agriculture and Agri-Food Canada and Alberta Agriculture &Rural Development, have worked to develop several studies on surface/groundwater interaction, and identification of shallow aquifers vulnerable to surface contamination. The studies were developed for the white zone only. Aquifer vulnerability mapping of white zones in the Peace River Watershed was updated by AESRD in 2013, and is currently an on-going project. Identification of shallow aquifers is based on surficial geology maps. Various factors includes genetic composition, surface expression, slope, soil class, soil drainage, texture, modifying process, as well as several vulnerability maps (HEMS Vulnerability Map; Bayrock and Reimchen Vulnerability Map) were considered when assigning vulnerability rankings [AESRD, 2013]. Aquifer Vulnerability was assessed as low to high. Aquifer Vulnerability Index (AVI): The AVI is an assessment of likeliness of surface contamination reaching shallow aquifers. The index only takes into account certain properties of aquifers, such as depth, properties of overlying soil, surficial geology, and topography. It does not factor in land usage, natural regions, or evapotranspiration. The resulting maps can be interpreted to show areas of potential shallow aquifers under direct influence from surface water due to the potential for high infiltration rates. Similar to Groundwater Under the Direct Influence of

56 Surface Water (GUDISW). AVI can be combined with land use characteristics, such as wastewater discharge, well density, livestock density, industrial operations, or surface water quality, to determine potentially sensitive aquifers that could be under stress. Further studies can concentrate on identifying locations of potential stress combined with vulnerability of shallow aquifers to determine whether an adverse effect on the aquifers is to be expected. Figure 13 Manure Production Index (Census of Agriculture, 2001; AESRD gdex10335) Combining AVI with wastewater discharge locations, sewage lagoons, and density of manure production can be a method for predicting potential E.Coli contamination at regional scale. The Manure production index uses Statistic Canada and Agriculture Census data from It is unclear whether there will be an update to the Agriculture Census data. Surface contaminants are difficult to assess on a watershed level. As is the case with coliform bacteria, contamination could be very detrimental to local water source and aquifers. For the majority of agricultural areas where the primary water source is dugouts or shallow wells, it is difficult to ensure drinking water quality, as routine water quality testing would need to be carried out at municipal levels. Development of a database of local water source quality would be ideal. Groundwater Under Direct Influence of Surface Water (GUDISW guideline are available from Alberta Environment) is a classification system set up to identify shallow aquifers whose water is characteristically similar to the overlying surface water. While deeper aquifers are recharged as part of the regional groundwater flow regime, and groundwater could travel a great distance and take many years to reach to the aquifer, shallow aquifers are recharged directly by infiltrating surface water. Residence time of groundwater in shallow aquifers tends to be very short and local flow regimes fluctuate in reaction to the changing surface conditions, compared to the slow and methodical flow trends in deeper aquifers. Groundwater in shallow aquifers retains many of the characteristics of the infiltrating surface water, and often it becomes a pathway for contaminants to reach groundwater after a rainfall event. Manure production from industrial size feedlots or other livestock could contaminate water source with viruses and bacteria (such as E.Coli). When there is a rainfall event, contaminants could travel with runoff or stream water for quite a distance, and could ptentially infiltrate a shallow aquifer miles away. Futher groundwater

57 movement could carry the contaminants to a drinking water source. Thus, it is very difficult to track where contaminants orginate, and therefore people who rely on shallow wells and dugouts for drinking water need to understand the highly variable nature of shallow groundwater. Wastewater discharge is provided by AECOM Municipal Wastewater Facility Assessment Volume 1 [AECOM, 2009]. In AECOM s map of discharge points at wastewater facilities, each unfilled square represents a wastewater lagoon used by municipalities and a red-filled square represents an area of seasonal discharge to surface water. Effluents in all of the wastewater treatment facilities are monitored and the results are collected by ESRD annually.


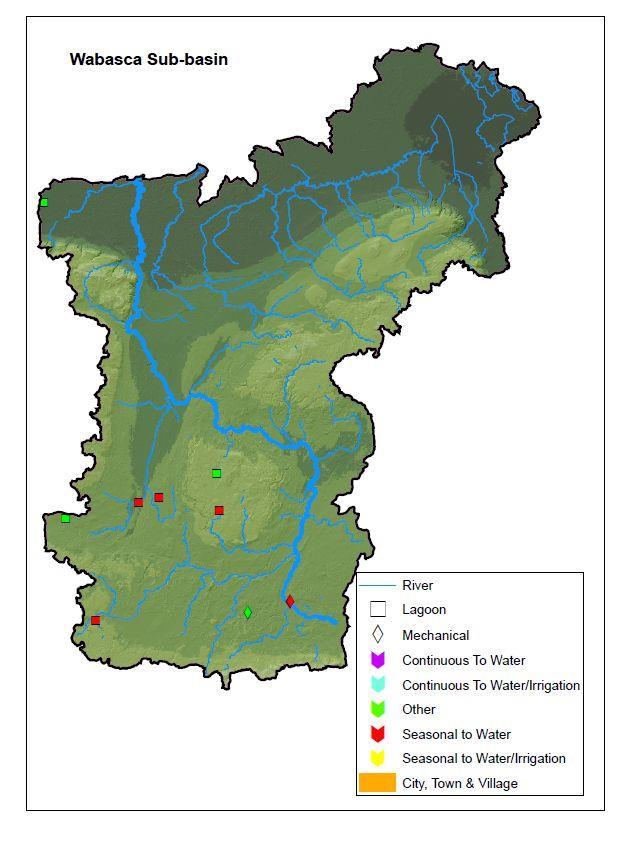
58
59 4.5 Groundwater Monitoring: Water Quality, Water Chemistry, Trace Metal The classification of aquifer type and concentration of routinely recorded dissolved constituents in groundwater are summarized in this section. Common constituents of groundwater in routine testing results include concentration of Total Dissolved Solids (TDS), nitrogen (nitrate and nitrite), sodium, nitrogen, sulfate, chloride, fluoride, bicarbonate, and others. Groundwater with TDS concentrations greater than 4000 mg/l (ppm) is considered saline groundwater. The majority of saline groundwater is allocated to the industrial sector, such as for use in SAGD facilities. Alberta Energy Regulators (AER) are responsible for the regulation and allocation of saline groundwater in the province. Smoky/Wapiti Basin: Baselines studies identified 3 hydrochemically distinctive groundwater types present in the shallow bedrock aquifers in the southern part of the Smoky/Wapiti region [Barnes, 1977]. 1) Calcium and magnesium bicarbonate types are the most widespread in the bedrock aquifers, and are found in all of the surficial aquifers. 2) Calcium and magnesium sulfate type groundwater with up to 35% chloride is present mainly in the Rocky Mountain region. 3) Sodium and potassium bicarbonate type groundwater is present east of Grande Prairie. TDS content in groundwater in the southern Smoky/Wapiti basin is typically lower than1000mg/l, and increases from southwest to northeast [R.Barnes, 1977]. The Upper Wapiti formation (Horseshe Canyon, Oldman) generally have TDS concentrations between mg/l, with calcium and magnesium as the main cations., TDS in the Wapiti formation is generally between mg/l, with sodium and potassium as the main cations. However, east of the Grande Prairie and Smoky/Wapiti river confluence, groundwater classified as a sodium and potassium bicarbonate type has a TDS concentration over 2000 mg/l. Although recharging bedrock aquifers is the dominant process, oftentimes the process is reversed.a bedrock aquifers discharging into a surficial aquifer often results in greater TDS concentrations in the surficial aquifers of the Rocky Mountain and Foothills region [R.Barnes, 1977]. In the Wapiti River Beaverlodge area, groundwater from drift aquifers (up to 61m below surface) have TDS concentrations between mg/L. The concentration of calcium is usually less than 80mg/L, whie magnesium is usually less than 40mg/L [Hackbarth, 1978]. TDS, calcium, and magnesium concentrations increase rapidly north of Saddle Hills. Baseline studies identified that the concentration of TDS in surficial aquifers is below 1500 mg/l for most of the area south of Saddle Hills [Hackbarth, 1977], although chemistry of surficial aquifers in this area is irregular and seems to be greatly controlled by local geology. TDS values less than 500 mg/l are predicted to occur in the Bezanson/Brazeau buried valley [Hackbarth, 1977]. Groundwater in the Saddle River valley and Kakut River valley have high TDS concentrations due to the topography of the area, thick lacustrine clay layers, as well being
60 underlain by shale from the Smoky Group. All of these result in poor groundwater quality [Hackbarth, 1977]. Groundwater from drift aquifers west of Grande Prairie and south of Saddle Hills has naturally high concentrations of sodium and potassium. North of Saddle Hills, the dominant cations in drift aquifers are calcium and magnesium and Bicarbonate is the main anion, except for areas with upward flowing groundwater where sulfate is the main anion [Hackbarth, 1977]. Upper and Central Peace River Basin: Groundwater chemistry in this area was studied as part of Hydrogeological Consultants Ltd. regional groundwater assessment in Groundwater from drift aquifers in this area is generally chemically hard and high in dissolved iron [HCL, 2004]. TDS in 3770 groundwater samples from drift aquifers was analyzed and 66% had TDS concentrations greater than 500 mg/l. Dissolved iron concentrations in 3511 samples of drifter aquifer were analyzed, with approximately 57.6% less than 1mg/Land 16% greater than 5mg/L [HCL, 2004]. Groundwater with elevated levels of sulfate is generally associated with elevated level of TDS. Chloride concentrations in drift aquifers are generally low; 98% of the groundwater samples had chloride ion concentrations less than 250mg/L [HCL, 2004]. Nitrogen (nitrate + nitrite) concentration from 3024 samples was studied, and 140 samples were found to have nitrogen concentrations greater than 10 mg/l [HCL, 2004]. Water quality in the Manning buried channel is poor. Many shallow wells in the Manning channel area have high concentrations of nitrate, while deeper wells in the channel encountered sodium sulfate type water with TDS concentrations ranging from mg/l. At Whitemud Hills, 3 types of groundwater can be found depending on elevations. At the foot of the hills, sodium-sulfate type water with TDS concentrations from mg/L is present. Calcium-magnesium-sulfate type groundwater with TDS concentrations from mg/l can be found at low elevations. Sodium-calcium magnesium-bicarbonate water with TDS concentrations from mg/l is found at higher elevations [D. Borneuf, 1981]. In the central and northern parts of Clear Hills County, dissolved salts in shallow groundwater are generally around 500 mg/l. The shallow groundwater is often a calcium or sodium bicarbonate type. Groundwater in the southern part of Clear Hills County has high sulfate concentrations and TDS concentrations often exceed 2000 mg/l, sometimes greater than 4000 mg/l. Water in the upper bedrock formations underneath Clear Hills is also of poor quality. Groundwater in the Dunvegan formation is a sodium bicarbonate or sulfate type, while deeper is a sodium sulfate or chloride type with TDS concentrations ranging from to mg/l, classifying it as brine [Ozoray, 1982].
61 In the area surrounding the town of High Level, groundwater of good quality can be found in eolian deposits, as well as the sand and gravel deposits near Peace River. Generally, good quality groundwater can be found in sand and gravel deposits along rivers or in high areas of Mount Watt and Caribou Mountain. Poor quality groundwater is associated with silt and clay deposits in lowland areas. Information on the quality of groundwater in the underlying bedrock formations is scarce. Tokarsky s study in 1972 was able to identify upper bedrock aquifers containing sodium chloride type water with TDS concentrations over 4400 mg/l. The majority of the bedrock aquifers in the northern Smoky/Wapiti basin and Upper and Central Peace River basins are either sodium-bicarbonate or sodium-sulfate types, however occasionally calcium takes the place of sodium as the dominant cation. TDS concentrations in the upper bedrock aquifers range from less than 500 to over mg/l. Generally, when TDS concentrations in theupper bedrock aquifers is greater than 2000 mg/l, sulfate concentrations in the same aquifer will exceed1,000 mg/l. In the Peace River area, chloride concentrations in the upper bedrock aquifers are generally less than 100mg/L, and nitrogen (nitrate and nitrite) concentrations are mostly less than 1.0mg/L [HCL, 2004]. In Hydrogeological Consultants Ltd. regional groundwater study (2004), high fluoride concentrations were encountered in upper bedrock aquifers in the Beaverlodge-Grande Prairie and Fairview areas. Fluoride concentrations from these aquifers exceed 1.5 mg/l, the maximum concentration set forth in GCDWQ. A higher percentage of the groundwater from Horseshoe Canyon, Oldman, and Foremost formations contain more fluoride than the province. Groundwater from the Milk River aquifer contains less fluoride in the Peace River area than in Alberta as a whole. However, there is still relatively little groundwater analysis available for fluoride concentrations in the Peace River area compared to other areas of the province [HCL, 2004].

62
63
64

65 Horseshoe Canyon: Oldman: Foremost: Lea Park:


66 Milk River: Colorado: Cardium: Kaskapau:


67 Dunvegan: Shaftesbury: Peace River: Manville:
68 Wabasca Basin: Groundwater quality monitoring data available in the public domain for the Wabasca Basin is insufficient for regional analysis. To date there has not been a comprehensive regional groundwater study for the Wabasca basin. The only sources of data are approved industrial facilities groundwater monitoring reports. Groundwater quality reports were obtained from Husky Oil Operation Limited s McMullen Thermal Conduction Pilot Project near Southern Wabasca Lake, and Cenovus Energy s Pelican Lake Grand Rapids SAGD Pilot at Pelican Lake, and as such the groundwater monitoring results are locally specific and should not be used assessing regional water quality. Groundwater monitoring results from the Mcmullen site were obtained in TDS in shallow monitoring wells ranges from mg/L, and are generally classified as non-saline (<4000 mg/l). TDS concentrations in all of the shallow aquifers exceed the Tier 1 natural area guidelines of 500mg/L, set forth by AESRD. The concentrations of nitrite and nitrate are below the Tier 1 guidelines of 0.06 and 2.9mg/L, respectively [Matrix Solutions, 2012]. Sodium concentrations in shallow wells range from mg/L with results from November exceeding the Tier 1 guideline (200mg/L). Chloride concentrations range from < mg/l and did not exceed the Tier 1 guideline (230mg/L). Sulfate concentrations range from mg/l, exceeding the Tier 1 guideline of 500mg/L. All other general and inorganic parameters were below the Tier 1 guidelines [Matrix Solutions, 2012]. Groundwater monitoring results for the Pelican Lake Grand Rapids Pilot site were obtained in TDS concentrations in drift aquifers ranges from mg/l. Calcium and sodium are the major cations, with concentrations of approximately 130 and 200 mg/l, respectively. Sulfate and bicarbonate are the major anions, both having concentrations of approximately mg/l. Shallow groundwater in this area have low nitrogen concentrations. The upper Cretaceous La Biche aquitard lies immediately below the drift. The Viking formation below the La Biche formation is the shallowest viable aquifer. Groundwater in the Viking formation identified TDS around 630 mg/l. Sodium is the most prevalent cation in the area, with a concentration of approximately 260 mg/l. Bicarbonate is the main anion with a concentration of approximately 700 mg/l.
69 Alberta Centre for Toxicology Groundwater Chemistry Monitoring Program: The Alberta Centre for Toxicology provided results from their water chemistry testing program as of The program has a considerable database of water samples submitted by home owners in the Peace River watershed, along with associated well information. Groundwater samples from 1258 wells was collected over the past decade and then analyzed for routine parameters such as concentrations of TDS, nitrate, nitrite, sulfate, hardness, bicarbonate, calcium, magnesium, sodium, chloride, and other attributes (such as aesthetics), as outlined in the SGCDWQ. Groundwater samples from additional 28 wells were analyzed for concentrations of trace metals, including Arsenic, Lead, Selenium, Iron, Copper, and others. See APPENDIX Completion interval is known for all of the 1,258 wells used for routine sampling. Based on the depth of well screen and geographical location, it is possible to estimate if the completion interval is completed in either drift or bedrock aquifer. Using the SRTM3 Digital Elevation Model [Rodriguez, E., C.S. Morris, J.E. Belz, E.C. Chapin, J.M. Martin, W. Daffer, S. Hensley, 2005, An assessment of the SRTM topographic products, Technical Report JPL D-31639, Jet Propulsion Laboratory, Pasadena, California] and comparing it with bedrock topography maps prepared by Alberta Geological Survey (AGS Map 550, 2010), as well as depth of completion intervals in the well database, 879 wells were classified as bedrock aquifers and 158 wells were classified as drift aquifers. AGS bedrock topography maps do not cover the Peace River Watershed in its entirety. At the time of this report, bedrock topography in NTS84E, 84F, 84G, 84H, 84K, 84J, and NTS84I have not been mapped. As a result, the 42 wells located in the unmapped areas were not accounted for. The majority of these well are located in the areas surrounding High Level, La Crete, and Fort Vermilion. Bedrock topography maps used in this study have a resolution of 500m [AGS, 2010]. The DEM used has a resolution of 90m. Because of the DEM being higher in resolution than the bedrock topography maps, there are a few instances where the surface elevation appears to drop below the top of bedrock, and the bedrock topography layer was not able to account for them due to interpolation at a lower resolution. Issues caused by the difference in resolutions are most apparent in the river valleys where the drift is thin and close to the bedrock surface. With this in mind, 179 wells were assigned as either bedrock or drift aquifers. Completion intervals in these wells are identified to within 10m of the bedrock/surficial contact. The majority of these 179 wells are more likely to be drift aquifers, however a higher resolution bedrock topography map would be required for confirmation. For future study, a 3D model of the upper Cretaceous bedrock formations would likely prove to be a valuable resource. The model could be utilized to determined completion intervals in each bedrock aquifer, thus helping to isolate and monitor groundwater in each of the bedrock formations. This would lead to a more comprehensive understanding of both water quantity and water quality.

70 Rough Maps and Examples in the Smoky/wapiti basin, See APPENDIX for full list of maps Complete map include Smoky/Wapiti, Peace River, La Crete, and compare with SGCDWQ standards for routine parameters and trace metals. TDS concentration from wells completed in bedrock aquifers
71 TDS concentration from wells completed in either bedrock or surficial aqufiers
72 TDS concentration from wells completed in known surficial aquifers
73 Chloride concentration from wells completed in bedrock aquifers
74 Chloride concentration from well completed in either bedrock or surficial aquifers

75 Chloride concentration from wells completed in surficial aquifers.

76 Concentration of Sodium in wells completed in surficial aquifers.
77 Concentration of Sodium in wells completed in bedrock aquifers.
78 Concentration of Sodium in wells completed in either surficial or bedrock aquifers.
79 Arsenic Concentration in wells completed in either surficial or bedrock aquifers
80 Lead Concentration in wells completed in either surficial or bedrock aquifers
81 4.6 Suggestions for Groundwater Quality Monitoring: The scope of monitoring programs focusing on quality of groundwater in the Peace River watershed is very limited and there are few up to date scientific studies related to groundwater quality in this watershed. Lack of monitoring and availability of up to date groundwater quality data is a prominent issue because it restricts the scope of scientific studies that can be done on the watershed. At the moment, the majority of available informations on groundwater quality are baseline studies, which describes the physical and chemical conditions of aquifers in their natural state. Baseline studies can provide a basis from which current monitoring results can be compared to and highlight any trends. The majority of regional hydrogeological studies in the Peace River watershed were carried out by Alberta Geologic Survey and Alberta Research Council from the late 1960 s to early 1980 s, from which the baseline informations on aquifers and hydrogeological mapping were created. Groundwater quality data in the Peace River watershed are limited, currently there are no programs set up to effectively monitoring quality of groundwater, as well as lack of scientific studies. The impacts of growing municipalities, agricultural, industrial and commercial activities, land use, and a changing climate has on the quality of groundwater in the watershed as well as how aquifers will respond to aforementioned stressors are mostly unknown at the moment. Design and implementing a monitoring program for a large watershed such as the Peace River watershed should carried out in phases. Identifying stressors and activities with potential of immediate adverse effect of surrounding aquifers and implementing monitoring programs is the most ideal approach. Areas with known water issues should have prioritized monitoring and studies implemented. ESRD s Groundwater Observation Well Network (GOWN) program has capability to carry out water chemistry testing for routine water quality parameters such as chlorides, nutrient and sodium. (For a list of routine parameters, see Alberta Environment Guide to Groundwater Authorization, March 2011) At the moment the scope of GOWN in the Peace River watershed is limited compared to southern Alberta. Two regions with high potential of stress and increasing limited monitoring results, in both surface water quality and groundwater quality, are the southern Smoky/Wapiti basin around Grande Cache, and the area north of Wapiti River from Grande Prairie to Beaverlodge. An expansion of GOWN program coordinated by ESRD should be considered. Three active GOWN wells are located in the area between Grande Prairie, Beverlodge, Hynth and up to Spirit River area. This region is underlain by the Peace River Arch with a large natural gas reserve in the Montney formation (Lower Triassic). This region has become a hot spot for both conventional hydrocarbon recovery as well as hydraulic fracking in recent years. For example, Encana plan to expand operation to wells in the Montney formations alone in With the increasing conventional recovery and fracking operations in the coming years, ideally there should be an expansion of GOWN wells in this region to provide groundwater monitoring for routine and trace metal concentrations.
82 The area surrounding Grande Cache in the Southern Wapiti Basin has a long history associated with mining, with coal being the most prominent resource in the region. Currently there is no active GOWN in this region or any active monitoring wells along the Smoky River from ESRD. There is also noticeably lack of scientific research and environmental assessments in this area. From the baseline studies it is apparent that Upper Wapiti Formations (Horseshoe Canyon, Oldman, Foremost) underlain the region have very low yield and poor water quality, together with low water table in most of drift aquifers in area makes groundwater resources in this region quite vulnerable and easily affected by any stress. There are existing studies highlighting the issues with water quality in this region. Particularly the high concentration of selenium in fish population in the region, which was linked to streams near mountain coal mines in a study done by Alberta Environment. Groundwater and surface water monitoring programs should be expanded to this region in order to protect drinking water sources for the residents as well as providing groundwater and surface water quality information for future studies. ESRD is aiming to phase out the usage of fresh water towards oil field injections in In situ and SAGD operations. Refer to Water Conservation and Allocation Guideline for Oilfield Injection and Water Conservation and Allocation Policy for Oilfield Injection 2006 for regulations and planning regards to oil and gas recovery operations. As part of the ESRD s groundwater policies regarding oilfield injections, all In situ and SAGD operations are required to implement formal risk assessment and groundwater monitoring programs on site in compliance to conditions determined by Alberta Environment. Groundwater monitoring reports also prepared by licensed professionals and submitted to ESRD on an annual basis for all approved industrial facilities requiring groundwater monitoring. As part of this study, groundwater monitoring reports conducted in 2012 from Husky McMullen pilot project and Cenovus Pelican Lake SAGD pilots were reviewed. Figure is a list of all industrial facilities located southern Wabasca basin with groundwater monitoring program. Annuals reports from the listed facilities as well as other industrial facilities subjected to groundwater monitoring are submitted to ESRD database. These reports are available from ESRD upon request.
83 QTR LSD SEC TWP RGE MER Approval_Num Facility_Type Company_Name General_Location Approved Facilities within the Wabasca Basin (Township 77 to 108, Range 21-W4 to 14-W5) Sour Gas Plant AltaGas Ltd. Wabasca In-situ Oil Sands CNRL Brintnell Wabasca In-situ Oil Sands SURE Northern Energy Ltd. 135km W of Ft. McMurray E Landfill CCS Corporation Wabasca Sour Gas Plant CNRL Godin Lake Wood Products/ Treatment Seehta Forest Products Red Earth Creek Sour Gas Plant CNRL Near Utikima Lake SW In-situ Oil Sands In-situ Oil Sands North Peace Energy Corp Andora Energy Corporation Red Earth Sawn Lake, 55km NW Red Earth Power Plant Mustus Energy La Crete Sour Gas Plant Penn West Seal Lake In-situ Oil Sands Cenovus Wabasca In-situ Oil Sands Cavalier Energy Wabasca In-situ Oil Sands Cenovus Sandy Lake In-situ Oil Sands Laricina Wabasca In-situ Oil Sands In-situ Oil Sands In-situ Oil Sands Husky Oil Operations Husky Oil Operations Husky Oil Operations Wabasca Wabasca Wabasca
84 5.0 Water Allocation 12,444 active water license and registrations have been issued for the year 2013, as of December 23, 2013, with combined volume of 216,566,133 m³ allocated from the Peace River Watershed. Out of the total 12,444 licenses, 190 are water resource licenses which do not expire, with total allocated volume of 75,146,197 m³. Another 10,247 licenses do not expire. These licenses include registration licenses and licenses with a low priority number. The combined allocated volume from these licenses is 96,615,995 m³. The remaining 2,014 licenses have an expiry date assigned to them; about half of them are temporary diversion licenses that expire in 2013 or expire at the end of The remaining roughly 1,000 licenses carry a 10 to 25 year active period with them. A small number of license holders are required to report actual volume of water used to ESRD, the combined volume of actual water usage from the year of 2012 is 86,283,682 m³ Allocations of Water in Peace River Watershed in 2013 are summarized in the tables below: There is no surface or groundwater allocation licensed in the Slave River Basin. Smoky/Wapiti Basin Surface Water Allocation (m³) Total Volume Groundwater Allocation (m³) Total Volume Agricultural % Agricultural % Industrial % Industrial % Municipal % Municipal % Commercial % Commercial % Registration % Other % Not Specified % Recreation % Habitat Enchancement % Habitabt Enchancement % Watershed Management % Registration % Recreation % Other % Other
85 Upper Peace Surface Water Allocation (m³) Groundwater Allocation (m³) Total Volume Allocated Total Volume Allocated Agricultural % Agricultural % Industrial % Industrial % Municipal % Municipal % Commercial % Commercial % Registration % Other % Other % Recreation % Water Management % Registration % Recreation % Habitat Enchancement % Central Peace Lower Peace Surface Water Allocation (m³) Groundwater Allocation (m³) Total Volume Allocated Total Volume Allocated Agricultural % Agricultural % Industrial % Industrial % Municipal % Municipal % Commercial % Commercial % Registration % Other % Other % Recreation % Water Management % Registration % Recreation % Habitat Enchancement % Water Act Hydrostatic Testi Surface Water Allocation (m³) Groundwater Allocation (m³) Total Volume Allocated Total Volume Allocated Agricultural % Agricultural % Industrial % Industrial % Municipal % Municipal % Commercial % Commercial % Registration % Other % Other % Recreation % Water Management % Registration % Recreation % Habitat Enchancement % Wabasca Basin Surface Water Allocation (m³) Groundwater Allocation (m³) Total Volume Allocated Total Volume Allocated Agricultural % Agricultural % Industrial % Industrial % Municipal % Municipal % Commercial % Commercial % Registration % Other % Other % Water Management Utikima Lake Enchancement Project %
86 Licensed Groundwater Allocation (m³) Smoky/Wapiti 32% Upper Peace 50% Central Peace Lower Peace 1% 7% Wabasca 10% Licensed Suface Water Allocation (m³) 1% 7% Smoky/Wapiti Upper Peace 29% 57% Central Peace Lower Peace Wabasca Basin 6%
87 Smoky/Wapiti Surface Water Allocation % 0%4% 9% 0% 2% 16% Agricultural Industrial Municipal 23% Commercial 45% Registration Smoky/Wapiti Groundwater Allocation 0% 5% 11% 1% 7% Agricultural Industrial 12% Municipal 38% Commercial Other 26%


88

89


90

91
Soils, Hydrogeology, and Aquifer Properties. Philip B. Bedient 2006 Rice University
 Soils, Hydrogeology, and Aquifer Properties Philip B. Bedient 2006 Rice University Charbeneau, 2000. Basin Hydrologic Cycle Global Water Supply Distribution 3% of earth s water is fresh - 97% oceans 1%
11/22/2010. Groundwater in Unconsolidated Deposits. Alluvial (fluvial) deposits. - consist of gravel, sand, silt and clay
 deposits. - consist of gravel, sand, silt and clay") Groundwater in Unconsolidated Deposits Alluvial (fluvial) deposits - consist of gravel, sand, silt and clay - laid down by physical processes in rivers and flood plains - major sources for water supplies
Groundwater in Unconsolidated Deposits Alluvial (fluvial) deposits - consist of gravel, sand, silt and clay - laid down by physical processes in rivers and flood plains - major sources for water supplies
=%REPORT RECONNAISSANCE OF CHISHOLM LAKE PROSPECT. October 25, 1977
 =%REPORT ON FIELD RECONNAISSANCE OF CHISHOLM LAKE PROSPECT October 25, 1977 Bruce D. Vincent Imperial Oil Limited, Minerals - Coal, CALGARY, ALBERTA CHISHOLM LAKE PROSPECT Introduction The Chisholm Lake
Description DESCRIPTION
 DESCRIPTION The location of the Upper James Watershed is located in northeastern South Dakota as well as southeastern North Dakota. It includes the following counties located in North Dakota Barnes, Dickey,
Lab 7: Sedimentary Structures
 Name: Lab 7: Sedimentary Structures Sedimentary rocks account for a negligibly small fraction of Earth s mass, yet they are commonly encountered because the processes that form them are ubiquitous in the
Land subsidence due to groundwater withdrawal in Hanoi, Vietnam
 Land Subsidence (Proceedings of the Fifth International Symposium on Land Subsidence, The Hague, October 1995). 1AHS Publ. no. 234, 1995. 55 Land subsidence due to groundwater withdrawal in Hanoi, Vietnam
Lower Mainland Surficial Geology From Wisconsin Ice Age to Protocol 21
 Lower Mainland Surficial Geology From Wisconsin Ice Age to Protocol 21 BCEIA BEST Conference 2018 Whistler, BC Kalina Malowany and Virginie Brunetaud Presentation Outline 1. Surficial Geology it s more
RIVERS, GROUNDWATER, AND GLACIERS
 RIVERS, GROUNDWATER, AND GLACIERS Delta A fan-shaped deposit that forms when a river flows into a quiet or large body of water, such as a lake, an ocean, or an inland sea. Alluvial Fan A sloping triangle
HW #2 Landscape Travel from A to B 12,
 HW #2 Landscape 2016 Section: Name: ate: 1. ase your answer(s) to the following question(s) on the map below, which represents two bridges that cross the Green River. Letters,, and represent locations
Which map shows the stream drainage pattern that most likely formed on the surface of this volcano? A) B)
 B)") 1. When snow cover on the land melts, the water will most likely become surface runoff if the land surface is A) frozen B) porous C) grass covered D) unconsolidated gravel Base your answers to questions
1. When snow cover on the land melts, the water will most likely become surface runoff if the land surface is A) frozen B) porous C) grass covered D) unconsolidated gravel Base your answers to questions
WATER ON AND UNDER GROUND. Objectives. The Hydrologic Cycle
 WATER ON AND UNDER GROUND Objectives Define and describe the hydrologic cycle. Identify the basic characteristics of streams. Define drainage basin. Describe how floods occur and what factors may make
The elevations on the interior plateau generally vary between 300 and 650 meters with
 11 2. HYDROLOGICAL SETTING 2.1 Physical Features and Relief Labrador is bounded in the east by the Labrador Sea (Atlantic Ocean), in the west by the watershed divide, and in the south, for the most part,
Geology and New England Landscapes
 Geology and New England Landscapes Jim Turenne, CPSS USDA-NRCS Warwick, RI. http://nesoil.com Why Geology? Provides the big picture of site conditions. Major part of soil formation (parent material and
Unit 4: Landscapes Practice Problems
 Name: Date: 1. Soil with the greatest porosity has particles that are A. poorly sorted and densely packed B. poorly sorted and loosely packed C. well sorted and densely packed D. well sorted and loosely
,Baynes Lake. TO...?&.?...A 2...KO.?'!!&... Sr. *logical Engineer
 > i evernment OF BRITISH COLUMBIA a TO...?&.?...A 2....KO.?'!!&... Sr. *logical Engineer... Grou,,water. Section Hydrology Division Wat.er... In~.~s.tiga.ti.On.s..Branck.... 5 u BJECT...C;.roun.dw.ater...Snve
Sediment and sedimentary rocks Sediment
 Sediment and sedimentary rocks Sediment From sediments to sedimentary rocks (transportation, deposition, preservation and lithification) Types of sedimentary rocks (clastic, chemical and organic) Sedimentary
2. PHYSICAL SETTING FINAL GROUNDWATER MANAGEMENT PLAN. 2.1 Topography. 2.2 Climate
 FINAL GROUNDWATER MANAGEMENT PLAN 2. PHYSICAL SETTING Lassen County is a topographically diverse area at the confluence of the Cascade Range, Modoc Plateau, Sierra Nevada and Basin and Range geologic provinces.
Evaluation of Subsurface Formation of Pabna District, Bangladesh
 IOSR Journal of Applied Geology and Geophysics (IOSR-JAGG) e-issn: 2321 0990, p-issn: 2321 0982.Volume 1, Issue 4 (Sep. Oct. 2013), PP 30-36 Evaluation of Subsurface Formation of Pabna District, Bangladesh
Name. 4. The diagram below shows a soil profile formed in an area of granite bedrock. Four different soil horizons, A, B, C, and D, are shown.
 Name 1. In the cross section of the hill shown below, which rock units are probably most resistant to weathering? 4. The diagram below shows a soil profile formed in an area of granite bedrock. Four different
Prentice Hall EARTH SCIENCE
 Prentice Hall EARTH SCIENCE Tarbuck Lutgens Chapter 7 Glaciers, Desert, and Wind 7.1 Glaciers Types of Glaciers A glacier is a thick ice mass that forms above the snowline over hundreds or thousands of
Michigan s Geology and Groundwater
 Michigan s Geology and Groundwater Ralph J. Haefner Deputy Director U.S. Geological Survey Michigan-Ohio Water Science Center Lansing, Michigan Outline About the USGS Geology 101 Michigan s geology Bedrock
1. The map below shows a meandering river. A A' is the location of a cross section. The arrows show the direction of the river flow.
 1. The map below shows a meandering river. A A' is the location of a cross section. The arrows show the direction of the river flow. Which cross section best represents the shape of the river bottom at
Cattaraugus Creek: A Story of Flowing Water and the Geology of the Channel It Flows Through Presentation to West Valley Citizen Task Force 4/27/16
 Cattaraugus Creek: A Story of Flowing Water and the Geology of the Channel It Flows Through Presentation to West Valley Citizen Task Force 4/27/16 Raymond C. Vaughan, Ph.D. What happens if you drop a
The Geology of Sebago Lake State Park
 Maine Geologic Facts and Localities September, 2002 43 55 17.46 N, 70 34 13.07 W Text by Robert Johnston, Department of Agriculture, Conservation & Forestry 1 Map by Robert Johnston Introduction Sebago
Climate also has a large influence on how local ecosystems have evolved and how we interact with them.
 The Mississippi River in a Changing Climate By Paul Lehman, P.Eng., General Manager Mississippi Valley Conservation (This article originally appeared in the Mississippi Lakes Association s 212 Mississippi
Weathering, Erosion, Deposition, and Landscape Development
 Weathering, Erosion, Deposition, and Landscape Development I. Weathering - the breakdown of rocks into smaller particles, also called sediments, by natural processes. Weathering is further divided into
Origin and Evolution of Formation Waters in the West-Central Part of the Alberta Basin
 Page No. 004-1 Origin and Evolution of Formation Waters in the West-Central Part of the Alberta Basin Karsten Michael* University of Alberta, 1-26 ESB, Edmonton, AB T6G 2E3 karsten@ualberta.ca and Stefan
Betsy Stevenson and Allison Mohrs (Skagit County Planning and Development Services) Jenny Baker, The Nature Conservancy
 Jenny Baker, The Nature Conservancy") TC Fisher Slough Final Design and Permitting Subject: Well Review Memorandum To: From: Betsy Stevenson and Allison Mohrs (Skagit County Planning and Development Services) Jenny Baker, The ature Conservancy
TC Fisher Slough Final Design and Permitting Subject: Well Review Memorandum To: From: Betsy Stevenson and Allison Mohrs (Skagit County Planning and Development Services) Jenny Baker, The ature Conservancy
Unit 3 Review - Surface Processes
 Unit 3 Review - Surface Processes 1. Why is the surface of Mercury covered with meteor impact craters, while Earth s surface has relatively few craters? A) Mercury is larger than Earth, so it gets hit
mountain rivers fixed channel boundaries (bedrock banks and bed) high transport capacity low storage input output
 high transport capacity low storage input output") mountain rivers fixed channel boundaries (bedrock banks and bed) high transport capacity low storage input output strong interaction between streams & hillslopes Sediment Budgets for Mountain Rivers Little
mountain rivers fixed channel boundaries (bedrock banks and bed) high transport capacity low storage input output strong interaction between streams & hillslopes Sediment Budgets for Mountain Rivers Little
Wisconsin s Hydrogeology: an overview
 2012 Soil and Water Conservation Society Conference Stevens Point, WI Feb 9, 2012 Wisconsin s Hydrogeology: an overview Ken Bradbury Wisconsin Geological and Natural History Survey University of Wisconsin-Extension
Name: Which rock layers appear to be most resistant to weathering? A) A, C, and E B) B and D
 A, C, and E B) B and D") Name: 1) The formation of soil is primarily the result of A) stream deposition and runoff B) precipitation and wind erosion C) stream erosion and mass movement D) weathering and biological activity 2)
Name: 1) The formation of soil is primarily the result of A) stream deposition and runoff B) precipitation and wind erosion C) stream erosion and mass movement D) weathering and biological activity 2)
Geology and hydrology of Tuaran
 Allnllal Geological Conference '96 ~~~~~ Jllne 8-9,1996, [(ota [(illaballl, Sabah Geology and hydrology of Tuaran MAJEED M. FAISAL, SHARIFF A.K. OMANG AND SANUDIN HJ. TAHIR University Malaysia Sabah Km
SUPPLEMENTAL MATERIAL
 SUPPLEMENTAL MATERIAL DESCRIPTIONS OF OTHER STRATIGRAPHIC SECTIONS Cherry Creek In its middle reaches, Cherry Creek meanders between three paired terraces within a narrow bedrock valley. The highest is
Section I: Multiple Choice Select the best answer to each question. Mark your final answer on the answer sheet. (1 pt each)
") Sedimentary Rocks & Surface Processes Quest Name: Earth Science 2013 Block: Date: Section I: Multiple Choice Select the best answer to each question. Mark your final answer on the answer sheet. (1 pt each)
Sedimentary Rocks & Surface Processes Quest Name: Earth Science 2013 Block: Date: Section I: Multiple Choice Select the best answer to each question. Mark your final answer on the answer sheet. (1 pt each)
Topic 6: Weathering, Erosion and Erosional-Deposition Systems (workbook p ) Workbook Chapter 4, 5 WEATHERING
 Workbook Chapter 4, 5 WEATHERING") Topic 6: Weathering, Erosion and Erosional-Deposition Systems (workbook p. 95-125) Workbook Chapter 4, 5 THE BIG PICTURE: Weathering, erosion and deposition are processes that cause changes to rock material
Topic 6: Weathering, Erosion and Erosional-Deposition Systems (workbook p. 95-125) Workbook Chapter 4, 5 THE BIG PICTURE: Weathering, erosion and deposition are processes that cause changes to rock material
Hydrogeological Assessment for Part of Lots 2 and 3, Concession 5, Township of Thurlow, County of Hastings 1.0 INTRODUCTION. 1.
 February 10,2017 25506400 Ontario Ltd. Foxboro, ON Attention: Brad Newbatt Re: Hydrogeological Assessment for Part of Lots 2 and 3, Concession 5, Township of Thurlow, County of Hastings 1.0 INTRODUCTION
Sedimentation in the Nile River
 Advanced Training Workshop on Reservoir Sedimentation Sedimentation in the Nile River Prof. Dr. Abdalla Abdelsalam Ahmed 10-16 Oct. 2007, IRTCES, Beijing, China CWR,Sudan 1 Water is essential for mankind
Executive Summary. Water Quantity
 Executive Summary Stakeholders in the Rock-Glade Watershed have taken the initiative to proceed with watershed planning as provided by the State of Washington under the Watershed Management Act (Chapter
STUDY GUIDE FOR CONTENT MASTERY. Surface Water Movement
 Surface Water SECTION 9.1 Surface Water Movement In your textbook, read about surface water and the way in which it moves sediment. Complete each statement. 1. An excessive amount of water flowing downslope
' International Institute for Land Reclamation and Improvement. 2 Groundwater Investigations. N.A. de Ridder'? 2.1 Introduction. 2.
 2 Groundwater Investigations N.A. de Ridder'? 2.1 Introduction Successful drainage depends largely on a proper diagnosis of the causes of the excess water. For this diagnosis, one must consider: climate,
Name: Mid-Year Review #2 SAR
 Name: Mid-Year Review #2 SAR Base your answers to questions 1 through 3 on on the diagram below, which shows laboratory materials used for an investigation of the effects of sediment size on permeability,
Buried Bedrock Channels in the Athabasca Oil Sands Region Conceptual Understanding and Implications to Water Supply
 Buried Bedrock Channels in the Athabasca Oil Sands Region Conceptual Understanding and Implications to Water Supply Scott Rayner 1 and Sandra Rosenthal 2 1 Matrix Solutions Inc. 118, 319 2nd Ave. SW, Calgary
Surface Water and Stream Development
 Surface Water and Stream Development Surface Water The moment a raindrop falls to earth it begins its return to the sea. Once water reaches Earth s surface it may evaporate back into the atmosphere, soak
Water Yield and Precipitation Inputs for ECA-AB Analysis Grand Prairie Forest Management Area Weyerhaeuser Canada Ltd.
 Water Yield and Precipitation Inputs for ECA-AB Analysis Grand Prairie Forest Management Area Weyerhaeuser Canada Ltd. Prepared by Watertight Solutions August 30, 2007 Introduction The objective of this
Page 1. Name:
 Name: 1) Which property would best distinguish sediment deposited by a river from sediment deposited by a glacier? thickness of sediment layers age of fossils found in the sediment mineral composition
Connecticut's Aquifers
 Page 1 of 5 DEP Search: Connecticut's Aquifers The technical definition of the word "aquifer" is: any geologic formation capable of yielding significant quantities of water to wells. By that definition,
 12 10 8 6 4 2 0 40-50 50-60 60-70 70-80 80-90 90-100 Fresh Water What we will cover The Hydrologic Cycle River systems Floods Groundwater Caves and Karst Topography Hot springs Distribution of water in
4. The map below shows a meandering stream. Points A, B, C, and D represent locations along the stream bottom.
 1. Sediment is deposited as a river enters a lake because the A) velocity of the river decreases B) force of gravity decreases C) volume of water increases D) slope of the river increases 2. Which diagram
Each basin is surrounded & defined by a drainage divide (high point from which water flows away) Channel initiation
 Channel initiation") DRAINAGE BASINS A drainage basin or watershed is defined from a downstream point, working upstream, to include all of the hillslope & channel areas which drain to that point Each basin is surrounded &
DRAINAGE BASINS A drainage basin or watershed is defined from a downstream point, working upstream, to include all of the hillslope & channel areas which drain to that point Each basin is surrounded &
Pratice Surface Processes Test
 1. The cross section below shows the movement of wind-driven sand particles that strike a partly exposed basalt cobble located at the surface of a windy desert. Which cross section best represents the
Chapter 5: Glaciers and Deserts
 I. Glaciers and Glaciation Chapter 5: Glaciers and Deserts A. A thick mass of ice that forms over land from the compaction and recrystallization of snow and shows evidence of past or present flow B. Types
Evolution of the conceptual hydrogeologic and ground-water flow model for Las Vegas Valley, Clark County, Nevada
 Evolution of the conceptual hydrogeologic and ground-water flow model for Las Vegas Valley, Clark County, Nevada Geological Society of America Annual Meeting November 14, 2 David J. Donovan Southern Nevada
Lowland Glaciation North Wales
 Lowland Glaciation North Wales Background Although there have been many glaciations and advances in ice, the most significant for this are was the Dimlington Stadial which was a period of glacial advance
Geology and Soils. Technical Memorandum
 Geology and Soils Technical Memorandum TO: FDOT FROM: HDR, Inc. DATE: February 2013 PROJECT: St Johns River Crossing FPID No: 208225-3-21-01 Clay, Duval, and St. Johns Counties; Florida Geology and soils
Napa Valley Groundwater Sustainability: A Basin Analysis Report for the Napa Valley Subbasin
 Napa Valley Groundwater Sustainability: A Basin Analysis Report for the Napa Valley Subbasin A report prepared pursuant to California Water Code Section 10733.6(b)(3) EXECUTIVE SUMMARY (354.4(A)) 1 1.0
Glauconitic Oil Reservoirs in Southern Alberta Creating the Correct Geological Model to Guide Development Drilling
 Glauconitic Oil Reservoirs in Southern Alberta Creating the Correct Geological Model to Guide Development Drilling Brad Hayes* Petrel Robertson Consulting Ltd, Calgary, AB bhayes@petrelrob.com Lisa Griffith
APPENDIX 3B OCCURRENCE OF SIGNIFICANT RIVER ALLUVIUM AQUIFERS IN THE PLATEAU REGION
 Plateau Region Water Plan January 2011 APPENDIX 3B OCCURRENCE OF SIGNIFICANT RIVER ALLUVIUM AQUIFERS IN THE PLATEAU REGION Occurrence of Significant River Alluvium Aquifers in the Plateau Region Prepared
REDWOOD VALLEY SUBAREA
 Independent Science Review Panel Conceptual Model of Watershed Hydrology, Surface Water and Groundwater Interactions and Stream Ecology for the Russian River Watershed Appendices A-1 APPENDIX A A-2 REDWOOD
UNIT 4: Earth Science Chapter 21: Earth s Changing Surface (pages )
") CORNELL NOTES Directions: You must create a minimum of 5 questions in this column per page (average). Use these to study your notes and prepare for tests and quizzes. Notes will be turned in to your teacher
CORNELL NOTES Directions: You must create a minimum of 5 questions in this column per page (average). Use these to study your notes and prepare for tests and quizzes. Notes will be turned in to your teacher
SECTION 4 TABLES. 1 Summary of Hydrogeologic Parameters for Various Stratigraphic Units FIGURES
 SECTION 4 4.0 OVERVIEW OF GEOLOGY AND HYDROGEOLOGY... 13 4.1 Comparison of East and West Sides of Study Area... 15 4.2 Bedrock Sequence... 17 4.3 Mancos Shale (Upper Cretaceous)... 18 4.4 Mesaverde Formation
Sacramento Valley Groundwater Basin, Sutter Subbasin
 Sacramento Valley Groundwater Basin, Sutter Subbasin Groundwater Basin Number: 5-21.62 County: Sutter Surface Area: 234,400 acres (366 square miles) Boundaries and Hydrology The Sutter Subbasin lies in
Laboratory Exercise #3 The Hydrologic Cycle and Running Water Processes
 Laboratory Exercise #3 The Hydrologic Cycle and Running Water Processes page - 1 Section A - The Hydrologic Cycle Figure 1 illustrates the hydrologic cycle which quantifies how water is cycled throughout
Water Supply Conditions and Outlook June 4, 2018
 Water Supply Conditions and Outlook June 4, 2018 Flow Forecasting & Operations Planning Water Security Agency Overview Water supply conditions across Saskatchewan are generally good with most reservoir
Impact of the Danube River on the groundwater dynamics in the Kozloduy Lowland
 GEOLOGICA BALCANICA, 46 (2), Sofia, Nov. 2017, pp. 33 39. Impact of the Danube River on the groundwater dynamics in the Kozloduy Lowland Peter Gerginov Geological Institute, Bulgarian Academy of Sciences,
Page 1. Name:
 Name: 1) Which event is the best example of erosion? dissolving of rock particles on a limestone gravestone by acid rain breaking apart of shale as a result of water freezing in a crack rolling of a pebble
Geology 12 FINAL EXAM PREP. Possible Written Response Exam Questions
 Geology 12 FINAL EXAM PREP Possible Written Response Exam Questions Use this study guide to prepare for the written response portion of the final exam. Name FINAL EXAM - POSSIBLE WRITTEN RESPONSE QUESTIONS
Lake Levels and Climate Change in Maine and Eastern North America during the last 12,000 years
 Maine Geologic Facts and Localities December, 2000 Lake Levels and Climate Change in Maine and Eastern North America during the last 12,000 years Text by Robert A. Johnston, Department of Agriculture,
Influence of the Major Drainages to the Mississippi River and Implications for System Level Management
 Influence of the Major Drainages to the Mississippi River and Implications for System Level Management Brian M. Vosburg Geologist Louisiana Coastal Protection and Restoration Authority brian.vosburg@la.gov
Figure 1 The map shows the top view of a meandering stream as it enters a lake. At which points along the stream are erosion and deposition dominant?
 1. In which type of climate does chemical weathering usually occur most rapidly? 1. hot and dry 3. cold and dry 2. hot and wet 4. cold and wet 2. Figure 1 The map shows the top view of a meandering stream
Erosion Surface Water. moving, transporting, and depositing sediment.
 + Erosion Surface Water moving, transporting, and depositing sediment. + Surface Water 2 Water from rainfall can hit Earth s surface and do a number of things: Slowly soak into the ground: Infiltration
Groundwater Hydrology
 EXERCISE 12 Groundwater Hydrology INTRODUCTION Groundwater is an important component of the hydrologic cycle. It feeds lakes, rivers, wetlands, and reservoirs; it supplies water for domestic, municipal,
April
 April 2016 5 993-1410-007.006 2.0 PHYSICAL SETTING AND HYDROGEOLOGY This section provides background information on the physical setting and hydrogeology of the Tumwater area based on previous investigations
Chapter 2. Regional Landscapes and the Hydrologic Cycle
 Chapter 2. Regional Landscapes and the Hydrologic Cycle W. Lee Daniels Department of Crop and Soil Environmental Sciences, Virginia Tech Table of Contents Introduction... 23 Soils and landscapes of the
Buried Bedrock Channels in the Athabasca Oil Sands Region Conceptual Understanding and Implications to Water Supply
 Buried Bedrock Channels in the Athabasca Oil Sands Region Conceptual Understanding and Implications to Water Supply Scott Rayner Matrix Solutions Inc. Sandra Rosenthal Devon Canada Corporation Presentation
Waterbury Dam Disturbance Mike Fitzgerald Devin Rowland
 Waterbury Dam Disturbance Mike Fitzgerald Devin Rowland Abstract The Waterbury Dam was completed in October 1938 as a method of flood control in the Winooski Valley. The construction began in April1935
Geologic Considerations of Shallow SAGD Caprock; Seal Capacity, Seal Geometry and Seal Integrity, Athabasca Oilsands, Alberta Canada
 Geologic Considerations of Shallow SAGD Caprock; Seal Capacity, Seal Geometry and Seal Integrity, Athabasca Oilsands, Alberta Canada Gordon T. Stabb, Michael Webb Durando Resources Corp, Suncor Energy
Summary. Streams and Drainage Systems
 Streams and Drainage Systems Summary Streams are part of the hydrologic cycle and the chief means by which water returns from the land to the sea. They help shape the Earth s surface and transport sediment
The Nubian Sandstone Aquifer System. Martina Müller Claudia Dengler Felix Leicht
 The Nubian Sandstone Aquifer System Martina Müller Claudia Dengler Felix Leicht Geography Transboundary groundwater system beneath the north-eastern Sahara total extension of over 2.2 Mio km² Shared between
Summary. Introduction. Observations and Interpretations
 Lower McMurray Formation sinkholes and their fill fabrics: effects of salt dissolution collapse-subsidence across the northern Athabasca oil sands deposit Paul L. Broughton, Chevron Canada Resources, Calgary,
Lecture Outlines PowerPoint. Chapter 6 Earth Science 11e Tarbuck/Lutgens
 Lecture Outlines PowerPoint Chapter 6 Earth Science 11e Tarbuck/Lutgens 2006 Pearson Prentice Hall This work is protected by United States copyright laws and is provided solely for the use of instructors
Geo 302D: Age of Dinosaurs. LAB 2: Sedimentary rocks and processes
 Geo 302D: Age of Dinosaurs LAB 2: Sedimentary rocks and processes Last week we covered the basic types of rocks and the rock cycle. This lab concentrates on sedimentary rocks. Sedimentary rocks have special
1. Any process that causes rock to crack or break into pieces is called physical weathering. Initial product = final product
 Weathering 1. Any process that causes rock to crack or break into pieces is called physical weathering. Initial product = final product End Result of physical weathering is increased surface area. 2. Physical
Clyde River Landslide
 Clyde River Landslide Department of Geology, Perkins Hall, University of Vermont, Burlington, VT 05405 Abstract: This paper investigates a landslide on the Clyde River in Newport, Vermont. The landslide
Glaciers. (Shaping Earth s Surface, Part 6) Science 330 Summer 2005
 Science 330 Summer 2005") Glaciers (Shaping Earth s Surface, Part 6) Science 330 Summer 2005 1 Glaciers Glaciers are parts of two basic cycles Hydrologic cycle Rock cycle Glacier a thick mass of ice that originates on land from
Glaciers (Shaping Earth s Surface, Part 6) Science 330 Summer 2005 1 Glaciers Glaciers are parts of two basic cycles Hydrologic cycle Rock cycle Glacier a thick mass of ice that originates on land from
6. Cretaceous Zone Play Results
 C H A P T E R S I X 6. Cretaceous Zone Play Results 6. Geological Overview The Mannville Group was deposited as a clastic wedge east of the mountain ranges. This wedge varies in thickness from 7 metres
Ecoregions Glossary. 7.8B: Changes To Texas Land Earth and Space
 Ecoregions Glossary Ecoregions The term ecoregions was developed by combining the terms ecology and region. Ecology is the study of the interrelationship of organisms and their environments. The term,
Jim Turenne. Soils on Social Media
 Jim Turenne USDA-NRCS 60 Quaker Lane, Suite 46 Warwick, RI. 02886 401-822-8832 Jim.turenne@ri.usda.gov Soils on Social Media www.twitter.com/soilsne www.fb.com/soilsne www.nesoil.com U.S. Department of
Bell Ringer. Are soil and dirt the same material? In your explanation be sure to talk about plants.
 Bell Ringer Are soil and dirt the same material? In your explanation be sure to talk about plants. 5.3 Mass Movements Triggers of Mass Movements The transfer of rock and soil downslope due to gravity is
What are the different ways rocks can be weathered?
 Romano - 223 What are the different ways rocks can be weathered? Weathering - the breakdown of rocks and minerals at the Earth s surface 1. 2. PHYSICAL WEATHERING Rock is broken into smaller pieces with
Mountain Rivers. Gutta cavat lapidem. (Dripping water hollows out a stone) -Ovid, Epistulae Ex Ponto, Book 3, no. 10, 1. 5
 -Ovid, Epistulae Ex Ponto, Book 3, no. 10, 1. 5") Mountain Rivers Gutta cavat lapidem (Dripping water hollows out a stone) -Ovid, Epistulae Ex Ponto, Book 3, no. 10, 1. 5 Mountain Rivers Fixed channel boundaries (bedrock banks and bed) High transport
Mountain Rivers Gutta cavat lapidem (Dripping water hollows out a stone) -Ovid, Epistulae Ex Ponto, Book 3, no. 10, 1. 5 Mountain Rivers Fixed channel boundaries (bedrock banks and bed) High transport
High-resolution Sequence Stratigraphy of the Glauconitic Sandstone, Upper Mannville C Pool, Cessford Field: a Record of Evolving Accommodation
 Page No. 069-1 High-resolution Sequence Stratigraphy of the Glauconitic Sandstone, Upper Mannville C Pool, Cessford Field: a Record of Evolving Accommodation Thérèse Lynch* and John Hopkins, Department
Laboratory Exercise #4 Geologic Surface Processes in Dry Lands
 Page - 1 Laboratory Exercise #4 Geologic Surface Processes in Dry Lands Section A Overview of Lands with Dry Climates The definition of a dry climate is tied to an understanding of the hydrologic cycle
Lecture Outline Wednesday - Friday February 14-16, 2018
 Lecture Outline Wednesday - Friday February 14-16, 2018 Quiz 2 scheduled for Friday Feb 23 (Interlude B, Chapters 6,7) Questions? Chapter 6 Pages of the Past: Sedimentary Rocks Key Points for today Be
GeoCanada 2010 Working with the Earth
 Lithofacies Identification and the Implications for SAGD Well Planning in the McMurray Formation, Christina Lake Area, Alberta Travis Shackleton*, Robert Gardner, Sung Youn, Grace Eng and Lori Barth Cenovus
Chapter 8 Fetter, Applied Hydrology 4 th Edition, Geology of Groundwater Occurrence
 Chapter 8 Fetter, Applied Hydrology 4 th Edition, 2001 Geology of Groundwater Occurrence Figure 8.42. Alluvial Valleys ground-water region. Fetter, Applied Hydrology 4 th Edition, 2001 Fetter, Applied
Weathering, Erosion and Deposition
 Weathering, Erosion and Deposition Shaping the Earth s Surface Weathering the process of breaking down rocks into smaller fragments Erosion the transport of rock fragments from one location to another
patersongroup Mineral Aggregate Assessment 3119 Carp Road Ottawa, Ontario Prepared For Mr. Greg LeBlanc March 7, 2014 Report: PH2223-REP.
 Geotechnical Engineering Environmental Engineering group Hydrogeology Geological Engineering Archaeological Studies Materials Testing 3119 Carp Road Prepared For Mr. Greg LeBlanc March 7, 2014 Paterson
Cretaceous, Dakota Formation, Terra Cotta Member South Side of I-70, Salina County, Kansas
 Cretaceous, Dakota Formation, Terra Cotta Member South Side of I-70, Salina County, Kansas Written By: Steven D.J. Baumann G-102010-1A Outcrop looking southeast Photo taken by: Steven Baumann on 10-20-2010
Glaciers Earth 9th Edition Chapter 18 Glaciers: summary in haiku form Key Concepts Glaciers Glaciers Glaciers Glaciers
 1 2 3 4 5 6 7 8 9 10 11 12 13 14 Earth 9 th Edition Chapter 18 : summary in haiku form Ten thousand years thence big glaciers began to melt - called "global warming." Key Concepts and types of glaciers.