Chapter 13: Exploration Techniques
|
|
|
- Jack Hodges
- 5 years ago
- Views:
Transcription
1 PTRT Petroleum Geology Chapter 13: Exploration Techniques - Mapping - Geophysical Techniques - Seismic Exploration
2 Mapping - Topographic Maps - Absolute Positioning - Geologic Maps - Base Maps - Subsurface Maps

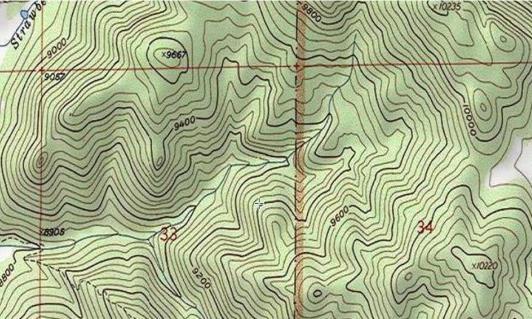
3 Topographic Maps Topographic maps usually consist of concentric rings that show the elevation and other features of a region.


4 3 rd dimension elevation of geometry is expressed by value of contour lines

5 Any two points on same contour lines represents two locations in geology field that have the same elevation No two contour lines can ever intersect each other. Any contour line is a single closed loop, no branch, no disconnection point. Elevation of any point on topographic map can be evaluated between two contour lines by proportionality. Example: 208ft
6

7 Area where interval of contour lines is large: Gentle slope Area where interval of contour lines is small: Steep slope or Cliff Given a certain direction in map, if contour lines marks increase, it means slope on this direction is rising. Vise verse, if contour lines marks decrease, slope is downward. Mapping is obtained by massive of survey data, processed and plotted in computer. Geologist measure three values at each location: x coordinates, y coordinate (horizontal) and z (elevation) Example: 10
8 Constructing Elevation and Topography

9 Geologic Maps Geologic maps are topographic maps with information on geology colorfully added to them. Colors, labels and symbols indicate particular rock "units" of the underlying geology. Once a formation has been dated, we know its relative place on the geologic time chart. An "Explanation" showing the colors and symbols for the various rock types accompanies each geologic map. This "legend" tells us how to read the geologic information on the map.

10 Each rock layer is given a different pattern, color and symbol on the map Formation: a mapable rock layer with a definite top and bottom Formation is named by location--- rock type. Such as San Andreas Limestone, Barnett Shale. Use formation when rock type is a mixture.


11

12 Geologic Maps vs. Geographical Maps Geologic Maps provide geological information on Earth s crust Geographical Maps provide information on Earth s surface only Geographical Maps are geological maps Geologic Maps Strikes and Dips Faults are characterized by Dip and Strike Dip has an inclination angle Strike is the line formed by the intersection of a horizontal plane with fault plane Dip and Strike are directional: East-West, North-South


13 The dip is the angle between the surface of the water and the rock surface. The dip is 75 degrees East. The strike is North The map symbol for this strike and dip is shown in the inset


14

15 Needs a software for this
 to +90 degrees (North Pole) The Equator is")
 to +180 degrees (East) The Greenwich Meridian is")
16 Absolute Positioning Longitude and Latitude What is latitude? Runs North and South Varies from -90 degrees (South Pole) to +90 degrees (North Pole) The Equator is the latitude line given the value of 0 degrees What is longitude? Runs East and West Varies from -180 degrees (West) to +180 degrees (East) The Greenwich Meridian is the longitude line given the value of 0 degrees; it passes over London and Accra


17

18


19 Global Positioning System (GPS) There are at least 24 GPS satellites in orbit around the earth. Each orbit takes 11 hours 58 minutes to complete and inclination and positioning of the satellites around the orbits is arranged so that wherever you are there should be several satellites visible in the sky above you Your latitude and longitude position is calculated from the time it takes the signal to reach the GPS system Used by phones, satellite maps, locators, etc.

20 A base map shows on a map, the distribution of items such as population density, mineral ores, and drilled oil wells, over a specified area Today a wide variety and diversity of base maps are proliferating with emerging Internet technologies Base Maps

21

22 Structural map Uses contour lines to show the elevation of top of a subsurface sedimentary rock layer. Domes, anticlines and faults can be identified on structural map Negative contour values imply below sea level, positive values imply above sea level Subsurface Maps Contour lines map to describe a subsurface rock layer Structural Isopach percentage


23 Structural map basic symbols

")
24 Isopach map A contour line map that shows thickness of a subsurface layer from a fixed reference (unlike topographic map as sea level) elevation.


25 Isopach map patterns


26


27 Normal fault Strike fault with dipping Anticline


28


29

30

31 Complex structures

32

33
34

35

36

37

38

39
40 Percentage map Percentage map plots the percentage of a specific rock type such as sandstone in a formation. High percentage of reservoir rock, such as sandstones and carbonates imply a better reservoir quality
41 Geophysical Techniques - Gravity - Magnetic


42 Gravity and Magnetic Exploration Gravity Gravity data provide a better understanding of the subsurface geology It s a relatively cheap, non-invasive, nondestructive remote sensing method No need of energy to operate in order to acquire data The objective in exploration work is to associate variations with differences in the distribution of densities and hence rock types
 where 1 mgal is one thousandth of 1cm/s 2 Standard")
; standard gravity is therefore 980.")
43 Observed Gravity Variation Variations in gravity on the surface of the Earth are very small; so, units for gravity surveys are generally in milligals (mgal) where 1 mgal is one thousandth of 1cm/s 2 Standard gravity ( g n or g 0 ) is taken as the freefall acceleration of an object at sea level at a latitude of 45.5 and is cm/s 2 (or equivalently m/s 2 ); standard gravity is therefore Gal or mgal
44 Observed Gravity (g obs ) - Gravity readings observed at each gravity station Corrections Latitude Correction Normal Gravity (g n ) - Correction subtracted from gobs that accounts for Earth's elliptical shape and rotation g n = ( sin 2 (lat) sin 4 (lat)) (mgal) where lat is latitude Free Air Corrected Gravity (g fa ) - The free-air correction accounts for gravity variations caused by elevation differences in the observation locations g fa = g obs - g n h (mgal) where h is the elevation (in meters)
45 Bouguer Slab Corrected Gravity (g b ) - accounts for a mass deficiency at observation points located below the elevation datum (sea level or the geoid) g b = g obs - g n h r h (mgal) where r is the average density of the rocks underlying the survey area. Terrain Corrected Bouguer Gravity (g t ) - accounts for variations in the observed gravitational acceleration caused by variations in topography near each observation point g t = g obs - g n h r h + TC (mgal) where TC is the value of the computed Terrain correction Terrain Corrected Bouguer Gravity is assumed to be caused by geologic structure
46 Gravity Exploration - Data Lab Assignment 6
47
48
49


50 N5 1W O 1E S5
51 Magnetic Exploration The magnetic field around the Earth, geomagnetic field, is believed to be mainly originated from the liquid outer core of the Earth containing high concentration of iron. Ferrous mineral deposits or buried iron and steel objects can be detected by measuring local variations of the geomagnetic field. Magnetic measurement of the Earth s total magnetic field and local magnetic gradients are usually made with proton precession magnetometers at points along a line which should be oriented at a high angle to the suspected trend of structures.
 and Remote Reservoir Resistivity Mapping CSEM survey is to a large extent complimentary to seismic, as it detects contrasts in electrical")
52 Controlled source electromagnetic (CSEM) surveying CSEM survey is a remote sensing technique that uses very low electromagnetic signals for measuring resistivity of subsurface objects in the marine environment; it is also known as Sea Bed Logging (SBL) and Remote Reservoir Resistivity Mapping CSEM survey is to a large extent complimentary to seismic, as it detects contrasts in electrical conductivity whereas seismic methods detects contrasts in acoustic impedance An electromagnetic field is generated in the substrate using a controlled source (usually towed to about ft above the sea bed) and measured at different offset locations using surface/seabed receivers Receivers are placed on sea floor and locations are based on seismic indication of hydrocarbon
53 What makes it possible to use EM methods for hydrocarbon exploration is that oil and gas have significantly lower electrical conductivity than salt water, so that a porous rock that is saturated with hydrocarbons will have a smaller conductivity (or greater resistance, hence the use of resistivity logs in well logging) than one that is saturated with salt water. The contrast could be as much as a factor of 100. So, when a transmitter (the controlled source) produces an electric current through the sea floor, the response measured at some other position will be affected if hydrocarbons are present.
54 Seismic Exploration
55 Introduction When an earthquake or explosion happens, shock waves, also called seismic waves, travel through the ground and reflect off rocks in the subsurface the same way that ripples in a pond reflect off a boat in the water; Because boundaries between different rocks often reflect seismic waves, geophysiscists use these waves to generate pictures of what the subsurface looks like Seismic data can offer us a 2D and 3D image of subsurface before well is drilled; Deepwater wells cost sometimes 100 million; a hand of fore-knowing is crucial; It takes sometimes years before decision to drill is made Seismic data involves four steps: Acquisition Processing Display interpretation

 2.")
56 Seismic Exploration 4 Stages 1. Acquisition To produce a seismic image of the subsurface, a seismic source must be generated and the resulting reflection data recorded by a field crew seismic onshore source of energy: - dynamite - specialized air - vibrator (Vibroseis) 2. Processing Next the data must be processed; the raw data go through many complex procedures using powerful computers and finally a seismic section is produced


57 3. Display Seismic sections are created from the raw data recorded by the field crew, identifying and mapping geological structures that can act as oil traps 4. Interpretation If the results of the interpretation seem favorable, then an exploration borehole will be drilled. A well in a previously unexplored area is called a wildcat
58 Seismic Exploration Environments Land - covers almost every type of terrain, such as jungle, desert, forest, urban settings, mountain regions and savannah, that exists on Earth, each with its own logistical problems. Transition Zone (TZ) - area where the land meets the sea, such as river deltas, swamps and marshes, coral reefs, beach tidal areas and the surf zone; water is too shallow for large seismic vessels but too deep for the use of land traditional methods of acquisition Marine - zone is either in shallow water areas (water depths of less than 30 to 40m for 3D marine seismic operations) or in the deep water areas, such as the Gulf of Mexico
59 Principles of seismic Various layers of subsurface have different acoustical properties. Sound wave travels in different speed in different density rock, like light reflection between air and water boundary. The deeper the layer, the longer the echo takes to reach a hydrophone. where d is the depth of the reflector and V is the wave velocity in the rock
60 Acoustic Impedance Acoustic Impedance (AI) is the scientific term that determines whether an interface will reflect seismic waves or not AI is dependent on the density of the medium and the seismic velocity through the medium Changes in AI give rise to reflected seismic waves j k AI 1 = AI 2 j k AI 1 AI 2 r 1 v 1 =r 2 v 2 r 1 v 1 r 2 v 2 No reflection where r is the density and v is the wave velocity in the rock

61 Reflection coefficient AI w = r w v w j AI 1 = r 1 v 1 k AI 2 =r 2 v 2 If r 1 v 1 =r 2 v 2 no reflection Reflection coefficient can be 1 only if V 2 =0; this means the incident wave can not penetrate through the layer 2

62 Seismic Data Acquisition Land survey acquisition Sound source (vibrator truck or dynamite) Shock wave transmitted Reflections (echoes) at the subsurface boundaries between various layers are recorded by receivers called geophones at different angle


63 Marine survey acquisition Sound source: air gun Receivers are called hydrophones

64 Sources of noise Airwave travels directly from the source to the receiver and is an example of coherent noise; it travels at a speed of 330 m/s, the speed of sound in air Rayleigh wave propagates along a free surface of a solid Refraction/head wave refracts at an interface, travelling along it, within the lower medium and produces oscillatory motion parallel to the interface Cultural noise includes noise from planes, helicopters and electrical pylons and all of these can be detected by the receivers Multiple reflection is an event on the seismic record that has incurred more than one reflection. Multiples are common in marine seismic data, and are suppressed by seismic processing.
65 Data Acquisition Terms Common MidPoint (CMP) Number The numbering system used across the top of a seismic profile is the CMP number. Each CMP is a vertical wiggle trace and has its own sequential number and x,y co-ordinate so that it can be located on an ordinance survey map. The distance between each CMP on a given seismic profile is the same, and a tradition has arisen in the seismic industry where 12.5m, 25m and 50m are the most common intervals.
66 Base Map A base map of an ares is the positioning of receivers. It may be constructed perfectly, but if the lines are misinterpreted, the map will be misleading. The basemap should have clearly legible line and shotpoint numbers. The base map should be printed accurately, but sometimes mistakes occur. Accuracy of the base map partly determines the accuracy of your geological interpretation BA-1 BA-3 Seismic Line Shot point BA-2 BA-4 BA-6 BA-8 BA-5 BA-7 BA-10 BA-12 BA-14 BA-16 BA-9 Well No.1 BA-11 A Base map of an area 1 cm=100m
67 Two Way Time A seismic wave is often represented in diagrams as a straight line to show it as a ray; Two way time is the time taken for a surface-generated seismic wave to reach a subsurface rock layer and return to the surface. It is usually measured in milliseconds (1 sec = 1,000 milliseconds)

68 Seismic Velocity There is a wide range of values of velocity as the rocks themselves are very variable. Things that affect the velocity at which the seismic wave can travel through a rock may be: degree of compaction, the presence of fluid, the type of fluid. Typical seismic velocity Material (m/s) Air 330 Water Sandstone Limestone Clay
 and from a trough to a peak (negative to positive).")
69 Peaks and Troughs Seismic wave itself is a series of peaks and troughs, a wiggle trace which shows it is composed of peaks and troughs with a zero crossing between the two Seismic interpreters differentiate between a zero crossing from a peak to a trough (positive to negative) and from a trough to a peak (negative to positive).
 of each line (seismic trace) indicates the")

70 Black wiggly lines Colored coded cross sections Intensity (amplitude) of each line (seismic trace) indicates the strength of the reflected signal. Interval between the strong amplitudes lines measures the time from one received signal to the next.
71 3D Acquisition Techniques A group of hydrophones in one stream create one 2D seismic image. Accurate imaging of sediments beneath hard seafloors, salt, basalt, and carbonate layers has presented a long-standing challenge to developers of seismic technology. In deep water, towed-streamer geometries are currently the only viable solutions for acquisition of large 3D data sets. 3D seismic image needs to be created by many streams of hydrophones. Different approaches have been applied. Narrow azimuth (NAZ) Multi azimuth (MAZ) Wide azimuth (WAZ) Rich azimuth (RAZ) Seismic wave pass through thick layer of salt often result in distorted data due to well crystallized materials has large refraction effect on wave or light. Multi-azimuth, wide azimuth and rich azimuth seismic has helped improve seismic data in these areas.
72 Azimuth acquisition geometries Term Meaning Remarks NAZ MAZ WAZ WATS RAZ Narrow-azimuth Multi-azimuth Wide-azimuth Wide-azimuth towed streamer Rich-azimuth One vessel towing an array of streamers and source(s). Three or more coincident NAZ surveys with different survey azimuths combined in processing, dualazimuth combines acquisition in two directions. Typically two or more vessels used simultaneously to increase the range of azimuths and offsets available for each shot gather in processing. A particular flavor of WAZ pioneered by BP. Typically a combination of MAZ and WAZ designed to yield the most continuous distribution of azimuths and offsets possible with towed streamer. FAZ Full-azimuth Perfect azimuth and offset distribution at every point in the survey. Possible only in practice when the source and receivers can be physically decoupled decoupled from the receiver spread, such as land or OBC 3D seismic.

73 NAZ Conventional narrow-azimuth 3D surveys, usually acquired using a single vessel, have proved their value in a wide variety of geologic circumstances.

74 NA Z

75 NA Z

76

77 Seismic Data Processing Alteration of seismic raw data to suppress noise Enhance signal, stack, and migrate seismic events to the appropriate location in space. Processing steps typically include analysis of velocities and frequencies, static corrections, deconvolution, normal moveout, dip moveout, stacking, and migration, which can be performed before or after stacking. Seismic processing facilitates better interpretation because subsurface structures and reflection geometries are more apparent. Seismic data can be initial processed on recording vessel and further processed and analyzed in computing center.
78 Seismic data can be initial processed on recording vessel and further processed and analyzed in computing center. Processing usually passes through three stages: Deconvolution (Filtering) Initial processing firstly eliminate bad records and correct for unwanted shallow surface effects and reduce the effect of multiple reflections Multiple reflections: multiple reflections (rays bouncing back and forth between layers before reflecting back to the surface) are common in marine seismic data, and are suppressed by seismic processing. Noises are also cleaned up Airwave travels directly from the source to the receiver and is an example of coherent noise; it travels at a speed of 330 m/s, the speed of sound in air Rayleigh wave propagates along a free surface of a solid Refraction/head wave refracts at an interface, travelling along it, within the lower medium and produces oscillatory motion parallel to the interface Cultural noise includes noise from planes, helicopters and electrical pylons and all of these can be detected by the receivers

79 Stacking Over 100 recordings at different locations are combined to form one seismic trace. The goal is to reduce noise ratio and multiple reflections within a single layer. Migration Migration is used to correct the seismic signal reflected from dipped surface. Sound need to be submitted underground such as in a testing well. Velocity of sound in each layer of rock need to be measured in seismic logs. Migration can be performed in time or depth. Migration of seismic section in time domain is time migration which gives the accurate measure of reflection points in constant velocity.


80 Seismic Data Display Simple 2D vertical slices provide first looks at the geology. Horizontal slices (time slices) can also be displayed. 3D cube can be rotated to get different views of the image of the subsurface
81 Seismic Data Interpretation Goal of all previous works is to make correct interpretation and then economic decisions. Knowledge from geophysicists, geologist, petrophysicist and reservoir engineers are needed as they search for the source rock, reservoir and trap for direct indicators of hydrocarbon presence. Direct hydrocarbon indicators (DHI): DHI is an information obtained from seismic analysis that can calibrate other hydrocarbon reservoir information to predict new accumulations. Most common DHI is bright spot Both shale layer and salted water sandstone layer are high acoustic impedance zone. Acoustic signal travel through their boundary has low contrast (small change). If sandstone is replaced by hydrocarbon, which is low acoustic impedance. Acoustic signal travel through the boundary will have high contrast (large change). This increasing contrast is bright spot
82 Seismic Maps The main purpose of interpretation is to obtain depth map (structural map) of the surveyed area. These maps are given to the geologist to locate: 1- Exploration wells 2- Exploitation wells 3- Development wells Type of seismic maps: 1- Isochrones (Time) map 2- Velocities map 3- Depth map
83 Construction of seismic maps: The following tools are required: 1- Base map It consists of the following elements: a- Seismic lines b- Names and number of the seismic lines c- Shot point number d- Location of a wells e- Scale and north symbol

84 Two way Time (msec) 2- Seismic sections It is a product of a final stage of data processing Shot point Seismic section of the line BA-3shows subsurface layers

85 Two way Time (msec.) No. of Trace Well No. 1 Seismic section of the line BA-14 shows subsurface features

86 3- Synthetic seismogram a theoretical seismic response model for a geological situation Well No.1 Synthetic seismogram Limestone Marl Clay Actual Synthetic seismogram
87 1-The synthetic seismogram of the well is prepared Well No The depths of the different geological unit are obtained from the geological column of the well. 3- The velocity of different geological unit (or formation) are calculated from the well survey. 4- The two way time is calculated for each layer by: TWT = Depth/Velocity 5- From the calculated TWT, different reflectors on Synthetic seismogram are picked. 6- Then the synthetic seismogram coincides with the seismic section No. BA-14 at its proper location 7- The reflectors will be picked on this seismic line and then on other lines using the intersection points Limestone Gypsum Sandstone Limestone

88 Two way Time (msec.) Seismic Data Interpretation No. of Trace Well No. 1 Limestone Gypsum Sandstone Limestone Seismic section of the line BA-14 shows subsurface features
89 7- Measurements of TWT are taken for each reflector and on each seismic section 8- The measurements are recorded in the following table: Shot point No. Two way time (msec) Reflector-1 Reflector-2 Reflector-3 Reflector The measurements of TWT for each reflector are plotted on the base map of the area for drawing isochrone map 10- From velocity analysis the average velocity map for each reflector is drawn also. 11- Then by coinciding the velocity map over isochrone map the depth maps for each layer are drawn.
90 QS QS 4 QS 10 QS 8 QS 13 QS 9 QS 507 a QS 606A QS 137 QS 29 NE QS 133 QS QS 905 QS 3 QS 606B QS 507 a well CH-9 QS 12 QS 507 QS 4 QS 606A QS 137 QS 13 QS 6 QS 133 QS 905 QS 9 QS 9 QR 5 QS 507 QS 29 NE QS 10 QS 8 QS 606B X 244 X 41 X 45 X QS 5 X 24 well QR-1 QS 12 X 455 X 475B X 495 X 1B QS X 41 X 24 X 244 Legend seismic line Deep well X X 1B km X 475B X Base map

91 Isochrone map of reflector-1

92 Average velocity map of reflector-1

93 Depth map of reflector-1
94
95 Isochrone map x Velocity map = Depth map Isochrone map(h1) - Isochrone map(h2) = Interval Time map Interval Time map x Interval velocity map = Isopach map Depth map (H2) - Depth map (H1) = Isopach map


96
97 Amplitude of seismic signal is affected by: Offset angle: horizontal distance between source and receiver. Acoustic properties of the reservoir and sealing rock above the reservoir, sound velocity and rock density. The content of the reservoir. i.e., oil, gas, or water
98 4D seismic Another parameter, time is added into seismic data to trace change of the reservoir during production phase of oil or gas. Acoustic properties are changed as oil or gas in a reservoir is evacuated from the reservoir. Seismic Software dsbca8w
PTRT 1473: Exploration and Production II. Chapter 3: Exploration
 PTRT 1473: Exploration and Production II Chapter 3: Exploration Hydrocarbon Accumulators Four conditions for hydrocarbon accumulation 1.A source rock rich in kerogen (waxy organic matter formed from buried
PART A: Short-answer questions (50%; each worth 2%)
") PART A: Short-answer questions (50%; each worth 2%) Your answers should be brief (just a few words) and may be written on these pages if you wish. Remember to hand these pages in with your other exam pages!
PART A: Short-answer questions (50%; each worth 2%) Your answers should be brief (just a few words) and may be written on these pages if you wish. Remember to hand these pages in with your other exam pages!
Subsurface Geology and Resource Exploration
 LAB 11. Subsurface Geology and Resource Exploration Locating earth resources such as aluminum, copper, gold and gemstones has been an important job for geologists for a long time. This lab deals with the
Chapter 7: Reflection Seismology Homework Solutions (Jan. 2010)
") Chapter 7: eflection Seismology Homework Solutions (Jan. 200). Why do marine seismic reflection surveys not record (a) S waves? (b) refracted rays? 2 μ a) For ideal fluid, μ=0, thus, v s = = 0 ρ b) eflection
Chapter 7: eflection Seismology Homework Solutions (Jan. 200). Why do marine seismic reflection surveys not record (a) S waves? (b) refracted rays? 2 μ a) For ideal fluid, μ=0, thus, v s = = 0 ρ b) eflection
Geophysical Site Investigation (Seismic methods) Amit Prashant Indian Institute of Technology Gandhinagar
 Amit Prashant Indian Institute of Technology Gandhinagar") Geophysical Site Investigation (Seismic methods) Amit Prashant Indian Institute of Technology Gandhinagar Short Course on Geotechnical Aspects of Earthquake Engineering 04 08 March, 2013 Seismic Waves
Geophysical Site Investigation (Seismic methods) Amit Prashant Indian Institute of Technology Gandhinagar Short Course on Geotechnical Aspects of Earthquake Engineering 04 08 March, 2013 Seismic Waves
Tim Carr - West Virginia University
 Tim Carr - West Virginia University Understanding Seismic Data Resolution (Vertical and Horizontal) Common Depth Points (CDPs) Two way time (TWT) Time versus depth Interpretation of Reflectors 2 Able to
3. Magnetic Methods / 62
 Contents Preface to the Second Edition / xv Excerpts from Preface to the FirstEdition / xvii Mathematical Conventions / xix 1. Introduction / 1 Reference / 5 2. Gravity Methods / 6 2. I. Introduction /
Static Corrections for Seismic Reflection Surveys
 Static Corrections for Seismic Reflection Surveys MIKE COX Volume Editors: Series Editor: Eugene F. Scherrer Roland Chen Eugene F. Scherrer Society of Exploration Geophysicists Tulsa, Oklahoma Contents
ERTH2020 Introduction to Geophysics The Seismic Method. 1. Basic Concepts in Seismology. 1.1 Seismic Wave Types
 ERTH2020 Introduction to Geophysics The Seismic Method 1. Basic Concepts in Seismology 1.1 Seismic Wave Types Existence of different wave types The existence of different seismic wave types can be understood
Geothermal Energy Resources Exploration using Gravity and magnetics. By Mariita, N.O. KenGen
 Geothermal Energy Resources Exploration using Gravity and magnetics By Mariita, N.O. KenGen What is Geothermal Energy? Geothermal Energy = heat from the Earth Transmitted by fluids via fractures and pores
FUNDAMENTALS OF SEISMIC EXPLORATION FOR HYDROCARBON
 FUNDAMENTALS OF SEISMIC EXPLORATION FOR HYDROCARBON Instructor : Kumar Ramachandran 10 14 July 2017 Jakarta The course is aimed at teaching the physical concepts involved in the application of seismic
INTRODUCTION TO APPLIED GEOPHYSICS
 INTRODUCTION TO APPLIED GEOPHYSICS EXPLORING THE SHALL0W SUBSURFACE H. Robert Burger Anne F. Sheehan Craig H.Jones VERSITY OF COLORADO VERSITY OF COLORADO W. W. NORTON & COMPANY NEW YORK LONDON Contents
A Petroleum Geologist's Guide to Seismic Reflection
 A Petroleum Geologist's Guide to Seismic Reflection William Ashcroft WILEY-BLACKWELL A John Wiley & Sons, Ltd., Publication Contents Preface Acknowledgements xi xiii Part I Basic topics and 2D interpretation
Last Time. Today s s Agenda. Geophysics. Geophysics. Geophysics. MAS 603: Geological Oceanography. Lecture 21: Geophysics 1: Gravity
 UNIVERSITY OF SOUTH ALABAMA Last Time MAS 603: Geological Oceanography Extinctions Lecture 21: 1: http://www.cartoonstock.com/newscartoons/cartoonists/for/lowres/forn441l.jpg Today s s Agenda Introduction
An Introduction to Geophysical Exploration
 An Introduction to Geophysical Exploration Philip Kearey Department of Earth Sciences University of Bristol Michael Brooks Ty Newydd, City Near Cowbridge Vale of Glamorgan Ian Hill Department of Geology
2011 SEG SEG San Antonio 2011 Annual Meeting 771. Summary. Method
 Geological Parameters Effecting Controlled-Source Electromagnetic Feasibility: A North Sea Sand Reservoir Example Michelle Ellis and Robert Keirstead, RSI Summary Seismic and electromagnetic data measure
Amplitude variation with offset AVO. and. Direct Hydrocarbon Indicators DHI. Reflection at vertical incidence. Reflection at oblique incidence
 Amplitude variation with offset AVO and Direct Hydrocarbon Indicators DHI Reflection at vertical incidence Reflection coefficient R(p) c α 1 S wavespeed β 1 density ρ 1 α 2 S wavespeed β 2 density ρ 2
Rock Physics and Quantitative Wavelet Estimation. for Seismic Interpretation: Tertiary North Sea. R.W.Simm 1, S.Xu 2 and R.E.
 Rock Physics and Quantitative Wavelet Estimation for Seismic Interpretation: Tertiary North Sea R.W.Simm 1, S.Xu 2 and R.E.White 2 1. Enterprise Oil plc, Grand Buildings, Trafalgar Square, London WC2N
Determination of Subsurface Bulk Density Distribution for Geotechnical Investigation using Gravity Technique
 Journal of Earth Sciences and Geotechnical Engineering, vol. 7, no.2, 2017, 63-69 ISSN: 1792-9040 (print), 1792-9660 (online) Scienpress Ltd, 2017 Determination of Subsurface Bulk Density Distribution
National Geophysical Survey Science Opportunities
 National Geophysical Survey Science Opportunities Anton Ziolkowski Professor of Petroleum Geoscience University of Edinburgh BGS Keyworth 4 April 2016 Outline Brief biography Science opportunities High
Geophysics for Environmental and Geotechnical Applications
 Geophysics for Environmental and Geotechnical Applications Dr. Katherine Grote University of Wisconsin Eau Claire Why Use Geophysics? Improve the quality of site characterization (higher resolution and
Reflection Seismic Method
 Reflection Seismic Method Data and Image sort orders; Seismic Impedance; -D field acquisition geometries; CMP binning and fold; Resolution, Stacking charts; Normal Moveout and correction for it; Stacking;
SEISMIC SURVEYS FOR IMAGING THE REGOLITH
 SEISMIC SURVEYS FOR IMAGING THE REGOLITH Barry Drummond Geoscience Australia. PO Box 378, Canberra, ACT 2601. E-mail: barry.drummond@ga.gov.au 1. INTRODUCTION Seismic reflection and refraction imaging
Elements of 3D Seismology Second Edition
 Elements of 3D Seismology Second Edition Copyright c 1993-2003 All rights reserved Christopher L. Liner Department of Geosciences University of Tulsa August 14, 2003 For David and Samantha And to the memory
Using Map and Compass Together
 Using Map and Compass Together In situations where you foresee a potential evacuation on foot, where there are no roads, and no indication as to the direction of travel (i.e., road signs), it is recommended
P Wave Reflection and Refraction and SH Wave Refraction Data Processing in the Mooring, TN Area
 P Wave Reflection and Refraction and SH Wave Refraction Data Processing in the Mooring, TN Area Abstract: Author: Duayne Rieger Home Institution: Slippery Rock University of Pennsylvania REU Institution:
INTEGRATED GEOPHYSICAL INTERPRETATION METHODS FOR HYDROCARBON EXPLORATION
 INTEGRATED GEOPHYSICAL INTERPRETATION METHODS FOR HYDROCARBON EXPLORATION Instructor : Kumar Ramachandran 31 July 4 August 2017 Jakarta COURSE OUTLINE The course is aimed at imparting working knowledge
Exploration Geophysics
 Exploration Geophysics Bearbeitet von Mamdouh R. Gadallah, Ray Fisher. Auflage 2008. Buch. xxii, 266 S. Hardcover ISBN 978 3 540 8559 2 Format (B x L): 5,5 x 23,5 cm Gewicht: 649 g Weitere Fachgebiete
P066 Duplex Wave Migration for Coal-bed Methane Prediction
 P066 Duplex Wave Migration for Coal-bed Methane Prediction N. Marmalevskyi* (Ukrainian State Geological Prospecting Institute), A. Antsiferov (UkrNIMI), Z. Gornyak (Ukrainian State Geological Prospecting
Compass Basics. Quick Map Basics Review For Compass Use
 Compass Basics Quick Map Basics Review For Compass Use A topographic map tells you where things are and how to get to them, whether you're hiking, biking, hunting, fishing, or just interested in the world
Last Time. GY 305: Geophysics. Seismology (Marine Surveys) Seismology. Seismology. Other Seismic Techniques UNIVERSITY OF SOUTH ALABAMA
 Seismology. Seismology. Other Seismic Techniques UNIVERSITY OF SOUTH ALABAMA") UNIVERSITY OF SOUTH ALABAMA Last Time GY 305: Geophysics Lecture 12: Introduction to (resolution versus penetration) Techniques (marine versus terrestrial) (Marine Surveys) http://www.glossary.oilfield.slb.com/displayimage.cfm?id=236
UNIVERSITY OF SOUTH ALABAMA Last Time GY 305: Geophysics Lecture 12: Introduction to (resolution versus penetration) Techniques (marine versus terrestrial) (Marine Surveys) http://www.glossary.oilfield.slb.com/displayimage.cfm?id=236
Application of High Resolution Seismic Survey in CBM Exploration A Case study, Sohagpur West Block, Madhya Pradesh
 P - 421 Application of High Resolution Seismic Survey in CBM Exploration A Case study, Sohagpur West Block, Madhya Pradesh T. Seshunarayana, D.Viswaja*, K.N.S.S.S. Srinivas, P. Srinivasa Rao, S. Trupti,
A Study of Uphole to Determine the Shooting Medium for Seismic Reflection Survey at Himalayan Foot Hill Area
 A Study of Uphole to Determine the Shooting Medium for Seismic Reflection Survey at Himalayan Foot Hill Area Summary Binode Chetia Frontier Basins, ONGC, Dehradun E-mail: chetia_binode@ongc.co.in Acquiring
The Pennsylvania State University. The Graduate School. Department of Electrical Engineering LOCATING PETROLEUM SOURCES USING DSP TECHNIQUES
 The Pennsylvania State University The Graduate School Department of Electrical Engineering LOCATING PETROLEUM SOURCES USING DSP TECHNIQUES A Thesis in Electrical Engineering by Wenxin Song 2015 Wenxin
Tan K. Wang National Taiwan Ocean University, Keelung, Taiwan, R.O.C.
 SEISMIC IMAGING IN THE OCEANS Tan K. Wang National Taiwan Ocean University, Keelung, Taiwan, R.O.C. Keywords: Converted wave, multi-channel seismic, ocean-bottom seismometer, travel-time inversion, virtual
Chapter 3 Models of the Earth. 3.1 Finding Locations on the Earth. 3.1 Objectives
 Chapter 3 Models of the Earth 3.1 Finding Locations on the Earth 3.1 Objectives Explain latitude and longitude. How can latitude and longitude be used to find locations on Earth? How can a magnetic compass
Improved Interpretability via Dual-sensor Towed Streamer 3D Seismic - A Case Study from East China Sea
 Improved Interpretability via Dual-sensor Towed Streamer 3D Seismic - A Case Study from East China Sea S. Rongfu (CNOOC Shanghai), C. Hua (CNOOC Shanghai), W. Yun (CNOOC Shanghai), Z. Yabin (CNOOC Shanghai),
EOS 350 MIDTERM OCT 4, 2013 STUDENT NAME: TEAM #:
 EOS 350 MIDTERM OCT 4, 2013 STUDENT NAME: TEAM #: Some equations which may, or may not, be useful: Distance from sensor to a dipole z ~ x ½, Distance to line of dipoles z ~ 0.75x ½ B = μh, M = κh Seismic
Seismic tests at Southern Ute Nation coal fire site
 Seismic tests at Southern Ute Nation coal fire site Sjoerd de Ridder and Seth S. Haines ABSTRACT We conducted a near surface seismic test at the Southern Ute Nation coal fire site near Durango, CO. The
Vertical and horizontal resolution considerations for a joint 3D CSEM and MT inversion
 Antony PRICE*, Total E&P and Don WATTS, WesternGeco Electromagnetics Summary To further explore the potential data content and inherent limitations of a detailed 3D Controlled Source ElectroMagnetic and
Earth in 2-D, 3-D & 4-D
 Earth in 2-D, 3-D & 4-D We will consider the scientific tools and techniques used to map surface features, reconstruct the layered structure of Earth, and interpret Earth history, including the origin
Walkaway Seismic Experiments: Stewart Gulch, Boise, Idaho
 Walkaway Seismic Experiments: Stewart Gulch, Boise, Idaho Lee M. Liberty Center for Geophysical Investigation of the Shallow Subsurface Boise State University Boise, Idaho 1. Summary CGISS conducted walkaway
FINAL REPORT GEOPHYSICAL INVESTIGATION WATER TOWER NO. 6 SITE PLANT CITY, FL
 APPENDIX B FINAL REPORT GEOPHYSICAL INVESTIGATION WATER TOWER NO. 6 SITE PLANT CITY, FL Prepared for Madrid Engineering Group, Inc. Bartow, FL Prepared by GeoView, Inc. St. Petersburg, FL February 28,
Introduction to the use of gravity measurements in Ge111A
 Introduction to the use of gravity measurements in Ge111A Background & basic intuition Data reduction Use of the instrument See Reynolds for detailed quantitative discussion What and Why Gravity measures
Mandatory Assignment 2013 INF-GEO4310
 Mandatory Assignment 2013 INF-GEO4310 Deadline for submission: 12-Nov-2013 e-mail the answers in one pdf file to vikashp@ifi.uio.no Part I: Multiple choice questions Multiple choice geometrical optics
SEG Houston 2009 International Exposition and Annual Meeting
 The role of EM rock physics and seismic data in integrated 3D CSEM data analysis I. Brevik*, StatoilHydro, Pål T. Gabrielsen, Vestfonna and Jan Petter Morten, EMGS Summary An extensive 3D CSEM dataset
GRAVITY AND MAGNETIC METHODS
 Presented at Short Course IX on Exploration for Geothermal Resources, organized by UNU-GTP, GDC and KenGen, at Lake Bogoria and Lake Naivasha, Kenya, Nov. 2-24, 2014. Kenya Electricity Generating Co.,
THE BETTER SUBSURFACE IMAGING USING A QUALITY SEISMIC PROCESSING
 THE BETTER SUBSURFACE IMAGING USING A QUALITY SEISMIC PROCESSING Muchlis 1,Ibnu Rusydy 2, Marwan 3, Fakhrurrazi 3,Nurul Aflah 1,Asrillah 4 1 Departmen of Mining Engineering, Faculty of Engineering, University
TAKE HOME EXAM 8R - Geology
 Name Period Date TAKE HOME EXAM 8R - Geology PART 1 - Multiple Choice 1. A volcanic cone made up of alternating layers of lava and rock particles is a cone. a. cinder b. lava c. shield d. composite 2.
Marine Science and Oceanography
 Marine Science and Oceanography Marine geology- study of the ocean floor Physical oceanography- study of waves, currents, and tides Marine biology study of nature and distribution of marine organisms Chemical
ERTH3021: Exploration and Mining Geophysics
 Course Profile ERTH3021: Exploration and Mining Geophysics Semester 2, 2014 Course Outline: This course builds on the general introduction provided by ERTH2020, and examines common applied-geophysical
Magnetic and Gravity Methods for Geothermal Exploration
 Magnetic and Gravity Methods for Geothermal Exploration Dr. Hendra Grandis Geophysics - ITB method and survey procedure Aero- or ground magnetic (covers a large area) Schlumberger resistivity mapping and
Available online Journal of Scientific and Engineering Research, 2016, 3(2):1-7. Research Article
:1-7. Research Article") Available online www.jsaer.com, 2016, 3(2):1-7 Research Article ISSN: 2394-2630 CODEN(USA): JSERBR Assessment of the Reliability of Magnetic Method to Delineate Geologic Features in a Basement Complex:
Available online www.jsaer.com, 2016, 3(2):1-7 Research Article ISSN: 2394-2630 CODEN(USA): JSERBR Assessment of the Reliability of Magnetic Method to Delineate Geologic Features in a Basement Complex:
Topographic Maps and Landforms Geology Lab
 Topographic Maps and Landforms Geology Lab Ray Rector: Instructor Today s Lab Activities 1) Discussion of Last Week s Lab 2) Lecture on Topo Maps and Elevation Contours 3) Construct Topographic Maps and
ANGLE-DEPENDENT TOMOSTATICS. Abstract
 ANGLE-DEPENDENT TOMOSTATICS Lindsay M. Mayer, Kansas Geological Survey, University of Kansas, Lawrence, KS Richard D. Miller, Kansas Geological Survey, University of Kansas, Lawrence, KS Julian Ivanov,
ENVI.2030L - Plate Tectonics - Geomagnetism, Earthquakes, and Gravity
 I. Geomagnetism Name ENVI.2030L - Plate Tectonics - Geomagnetism, Earthquakes, and Gravity The earth's magnetic field can be viewed as a simple bar magnet located near the center of the earth and inclined
IODP Science Evaluation Panel: Guidelines and Rationale for Site Characterization Data (Revised: August 2013)
") Site Characterization Data Guidelines IODP Science Evaluation Panel: Guidelines and Rationale for Site Characterization Data (Revised: August 2013) This document outlines the method and rationale for data
Site Characterization Data Guidelines IODP Science Evaluation Panel: Guidelines and Rationale for Site Characterization Data (Revised: August 2013) This document outlines the method and rationale for data
A) B) C) D) 4. Which diagram below best represents the pattern of magnetic orientation in the seafloor on the west (left) side of the ocean ridge?
 B) C) D) 4. Which diagram below best represents the pattern of magnetic orientation in the seafloor on the west (left) side of the ocean ridge?") 1. Crustal formation, which may cause the widening of an ocean, is most likely occurring at the boundary between the A) African Plate and the Eurasian Plate B) Pacific Plate and the Philippine Plate C)
1. Crustal formation, which may cause the widening of an ocean, is most likely occurring at the boundary between the A) African Plate and the Eurasian Plate B) Pacific Plate and the Philippine Plate C)
Downloaded 11/20/12 to Redistribution subject to SEG license or copyright; see Terms of Use at
 AVO crossplot analysis in unconsolidated sediments containing gas hydrate and free gas: Green Canyon 955, Gulf of Mexico Zijian Zhang* 1, Daniel R. McConnell 1, De-hua Han 2 1 Fugro GeoConsulting, Inc.,
Chapter 3 SECTION 1 OBJECTIVES
 Chapter 3 SECTION 1 OBJECTIVES Distinguish between latitude and longitude and locate coordinates on maps. Explain how latitude and longitude can be used to locate places on Earth s surface. Explain the
Multifocusing 3D diffraction imaging for dectection of fractured zones in mudstone reservoirs
 Multifocusing 3D diffraction imaging for dectection of fractured zones in mudstone reservoirs Alana Schoepp, Evgeny Landa, Stephane Labonte Shell Canada Ltd., Geomage, Shell CanadaLtd Summary Unconventional
Mapping Earth. How are Earth s surface features measured and modeled?
 Name Mapping Earth How are Earth s surface features measured and modeled? Before You Read Before you read the chapter, think about what you know about maps Record your thoughts in the first column Pair
Reservoirs and Production
 Lesson Plan - Page 1 Topic Reservoirs and Production Source Oil and Natural Gas, pages 24-25, 26-27 Objective The students will learn that porosity refers to the percentage of holes (pores) in the rock.
Geoelectricity. ieso 2010
 Geoelectricity ieso 2010 1 RESISTIVITY SURVEY AT VENETO VILLA GRITTI AT THE TOWN OF TREVISO (VENETO REGION) The survey was carried out to verify the underground presence of the fondations of a rustic building.
Geography 3202 Unit 4 S.C.O. 4.3 & 4.5. Primary Resource Activities Offshore Oil And Gas
 Geography 3202 Unit 4 S.C.O. 4.3 & 4.5 Primary Resource Activities Offshore Oil And Gas Factors Affecting The Decision To Recover Offshore Oil And Gas (4.3.1) Physical Factors 1. Ocean Related Factors
Lab 7: Sedimentary Structures
 Name: Lab 7: Sedimentary Structures Sedimentary rocks account for a negligibly small fraction of Earth s mass, yet they are commonly encountered because the processes that form them are ubiquitous in the
Azimuthal Velocity Analysis of 3D Seismic for Fractures: Altoment-Bluebell Field
 Azimuthal Velocity Analysis of 3D Seismic for Fractures: Altoment-Bluebell Field Khaled Al Dulaijan and Gary F. Margrave CREWES Summary The 3D seismic data was acquired within Bluebell Field, the eastern
PETROLEUM GEOSCIENCES GEOLOGY OR GEOPHYSICS MAJOR
 PETROLEUM GEOSCIENCES GEOLOGY OR GEOPHYSICS MAJOR APPLIED GRADUATE STUDIES Geology Geophysics GEO1 Introduction to the petroleum geosciences GEO2 Seismic methods GEO3 Multi-scale geological analysis GEO4
Estimating vertical and horizontal resistivity of the overburden and the reservoir for the Alvheim Boa field. Folke Engelmark* and Johan Mattsson, PGS
 Estimating vertical and horizontal resistivity of the overburden and the reservoir for the Alvheim Boa field. Folke Engelmark* and Johan Mattsson, PGS Summary Towed streamer EM data was acquired in October
Summary. Introduction
 Xian Qiang*, Liu Yonglei, Lv Dong, An Haiting, He Xiaosong, Li Haiyin, Xiao Yong, Zhou Chenguang, Xu Jianyang, Dong Lei,and Mao Xianyu,BGP,CNPC Summary Although high density, FAZ(Full azimuth) seismic
Principles of 3-D Seismic Interpretation and Applications
 Principles of 3-D Seismic Interpretation and Applications Instructor: Dominique AMILHON Duration: 5 days Level: Intermediate-Advanced Course Description This course delivers techniques related to practical
FloatSeis Technologies for Ultra-Deep Imaging Seismic Surveys
 FloatSeis Technologies for Ultra-Deep Imaging Seismic Surveys 25 th January, 2018 Aleksandr Nikitin a.nikitin@gwl-geo.com Geology Without Limits Overview 2011-2016 GWL Acquired over 43000 km 2D seismic
A 3D seismic survey for mapping shallow targets
 A 3D seismic survey for mapping shallow targets Don C. Lawton, Robert R. Stewart, and Malcolm B. Bertram Department of Geoscience University of Calgary 2500 University Drive N.W. Calgary, Alberta T2N 1N4
Earthquakes How and Where Earthquakes Occur
 Earthquakes How and Where Earthquakes Occur PPT Modified from Troy HS Is there such thing as earthquake weather? Absolutely NOT!!! Geologists believe that there is no connection between weather and earthquakes.
Seismic reflection notes
 1 of 13 20/02/2006 3:29 PM Seismic reflection notes Introduction This figure was modified from one on the Lithoprobe slide set. LITHOPROBE is "probing" the "litho" sphere of our continent, the ground we
Shear wave statics in 3D-3C : An alternate approach
 P-157 C. B. Yadava*, M Singh, Kuldeep Prakash, Kunal Niyogi GEOPIC, Oil & Natural Gas Corporation Ltd, Dehradun Summary 3D-3C data was acquired in Sayan-Tadkeshwar area of Cambay basin to bring out sand
High Resolution Seismic for Minerals
 High Resolution Seismic for Minerals Greg Turner HiSeis Pty Ltd MEGWA April 2013 WELCOME HiSeis Pty Ltd, Suite 4 Enterprise Unit 3, 9 DeLaeter Way, Bentley, WA 6102 Ph: +61 8 9470 9866 www.hiseis.com Used
Topic 5: The Dynamic Crust (workbook p ) Evidence that Earth s crust has shifted and changed in both the past and the present is shown by:
 Evidence that Earth s crust has shifted and changed in both the past and the present is shown by:") Topic 5: The Dynamic Crust (workbook p. 65-85) Evidence that Earth s crust has shifted and changed in both the past and the present is shown by: --sedimentary horizontal rock layers (strata) are found
Topic 5: The Dynamic Crust (workbook p. 65-85) Evidence that Earth s crust has shifted and changed in both the past and the present is shown by: --sedimentary horizontal rock layers (strata) are found
Downloaded 05/01/17 to Redistribution subject to SEG license or copyright; see Terms of Use at
 Mapping Imbricate Structures in the Thrust Belt of Southeast Turkey by Large-Offset Seismic Survey Oz Yilmaz*, Anatolian Geophysical, Istanbul, Turkey; and Serdar Uygun, Ali Ölmez, and Emel Çalı, Turkish
Seismic Reflection Imaging across the Johnson Ranch, Valley County, Idaho
 Seismic Reflection Imaging across the Johnson Ranch, Valley County, Idaho Report Prepared for the Skyline Corporation Lee M. Liberty Center for Geophysical Investigation of the Shallow Subsurface (CGISS)
High Resolution Geophysics: A Better View of the Subsurface. By John Jansen, P.G., Ph.D., Aquifer Science and Technology
 High Resolution Geophysics: A Better View of the Subsurface By John Jansen, P.G., Ph.D., Aquifer Science and Technology Geologist Use Only Part of the Information Available To Them Most Geologist rely
Near-Surface Seismic Reflection Applications
 Near-Surface Seismic Reflection Applications Don Steeples, The University of Kansas, Lawrence, KS USA Abstract Nonintrusive methods of gaining knowledge about the Earth s subsurface comprise several of
Imaging through gas-filled sediments using marine shear-wave data
 GEOPHYSICS, VOL. 64, NO. 3 (MAY-JUNE 1999); P. 668 677, 12 FIGS. Imaging through gas-filled sediments using marine shear-wave data John R. Granli, Børge Arntsen, Anders Sollid, and Eilert Hilde ABSTRACT
Multicomponent seismic surveys at Sibbald Flats, Alberta
 Multicomponent seismic surveys at Sibbald Flats, Alberta Robert R. Stewart and Don C. Lawton ABSTRACT We conducted a 3C seismic survey, using vibrators, over a 5 km line in the Sibbald Flats area some
MT Prospecting. Map Resistivity. Determine Formations. Determine Structure. Targeted Drilling
 MT Prospecting Map Resistivity Determine Formations Determine Structure Targeted Drilling Cross-sectional interpretation before and after an MT survey of a mineral exploration prospect containing volcanic
Oil and Gas Research Institute Seismic Analysis Center Faults Detection Using High-Resolution Seismic Reflection Techniques
 Oil and Gas Research Institute Seismic Analysis Center Faults Detection Using High-Resolution Seismic Reflection Techniques Ghunaim T. Al-Anezi (KACST) March 2013 1 Objectives The objective of the survey
Feasibility and design study of a multicomponent seismic survey: Upper Assam Basin
 P-276 Summary Feasibility and design study of a multicomponent seismic survey: Upper Assam Basin K.L.Mandal*, R.K.Srivastava, S.Saha, Oil India Limited M.K.Sukla, Indian Institute of Technology, Kharagpur
Mapping Earth. Technology and Mapmaking
 CHAPTER 1 LESSON 2 Mapping Earth Technology and Mapmaking Key Concepts What can a topographic map tell you about the shape of Earth s surface? What can you learn from geologic maps about the rocks near
Tu P05 06 Duplex Wave Migration Case Study in Yemen
 Tu P05 06 Duplex Wave Migration Case Study in Yemen G. Markarova* (Calvalley Petroleum Inc), I. Blumentsvaig (TetraSeis Inc.), A. Kostyukevych (TetraSeis Inc.) & N. Marmalyevskyy (TetraSeis Inc.) SUMMARY
Vertical Hydrocarbon Migration at the Nigerian Continental Slope: Applications of Seismic Mapping Techniques.
 ROAR HEGGLAND, Statoil ASA, N-4035 Stavanger, Norway Vertical Hydrocarbon Migration at the Nigerian Continental Slope: Applications of Seismic Mapping Techniques. Summary By the use of 3D seismic data,
Ground-Water Exploration in the Worthington Area of Nobles County: Summary of Seismic Data and Recent Test Drilling Results
 Ground-Water Exploration in the Worthington Area of Nobles County: Summary of Seismic Data and Recent Test Drilling Results Jim Berg and Todd Petersen Geophysicists, DNR Waters January 2000 Table of Contents
Land seismic sources
 Seismic Sources HOW TO GENERATE SEISMIC WAVES? Exploration seismology mostly artificial sources à active technique Natural sources can also be used (e.g. earthquakes) usually for tectonic studies (passive
The Dynamic Crust 2) 4) Which diagram represents the most probable result of these forces? 1)
 4) Which diagram represents the most probable result of these forces? 1)") 1. The diagrams below show cross sections of exposed bedrock. Which cross section shows the least evidence of crustal movement? 1) 3) 4. The diagram below represents a section of the Earth's bedrock. The
1. The diagrams below show cross sections of exposed bedrock. Which cross section shows the least evidence of crustal movement? 1) 3) 4. The diagram below represents a section of the Earth's bedrock. The
Unit I: Earth Dimensions. Review Book pp.19-30
 Unit I: Earth Dimensions Review Book pp.19-30 Objective #1 Describe the actual shape of the Earth and explain 3 pieces of evidence for its actual shape. Earth s Shape The Earth appears to be the shape
EPS 50 Lab 6: Maps Topography, geologic structures and relative age determinations
 Name: EPS 50 Lab 6: Maps Topography, geologic structures and relative age determinations Introduction: Maps are some of the most interesting and informative printed documents available. We are familiar
Geo 302D: Age of Dinosaurs. LAB 2: Sedimentary rocks and processes
 Geo 302D: Age of Dinosaurs LAB 2: Sedimentary rocks and processes Last week we covered the basic types of rocks and the rock cycle. This lab concentrates on sedimentary rocks. Sedimentary rocks have special
GEOL 3700 STRUCTURE AND TECTONICS LABORATORY EXERCISE 3
 GEOL 3700 STRUCTURE AND TECTONICS LABORATORY EXERCISE 3 Goals: 1. Improve your map-reading and map-making skills. 2. Learn to generate and interpret structure contour maps. 3. Learn to generate and interpret
Acquisition and preliminary analysis of the Castle Mountain shallow VSP dataset
 Castle Mountain shallow VSP Acquisition and preliminary analysis of the Castle Mountain shallow VSP dataset Joe Wong, Henry C. Bland, Kevin W. Hall and Robert R. Stewart ABSTRACT As part of the 2006 geophysics
Detection, Delineation and Characterization of Shallow Anomalies Using Dual Sensor Seismic and Towed Streamer EM data
 Detection, Delineation and Characterization of Shallow Anomalies Using Dual Sensor Seismic and Towed Streamer EM data A.J. McKay* (Petroleum Geo-Services ASA), M. Widmaier (Petroleum Geo- Services ASA),
We apply a rock physics analysis to well log data from the North-East Gulf of Mexico
 Rock Physics for Fluid and Porosity Mapping in NE GoM JACK DVORKIN, Stanford University and Rock Solid Images TIM FASNACHT, Anadarko Petroleum Corporation RICHARD UDEN, MAGGIE SMITH, NAUM DERZHI, AND JOEL